Examining the Process of Visual Cues during Dressing Movements in Patients with Hemiplegia: A Cross-Sectional Pilot Study
Background: Reportedly, in patients with hemiplegia, higher brain dysfunction is associated with difficulty in dressing. Nevertheless, it is not clear how patients with hemiplegia take in clothing information (visual information). Objective: This study aimed to compare the process of taking in visual cues during dressing in patients with hemiplegia. Methods: A cross-sectional observational study was conducted on 11 patients with hemiplegia and 11 age- and gendermatched healthy adults. The two groups wore eye mark recorders between 2009 and 2015, and their eye movements were observed as they wore the shirts. Results: The number of fixations per second in patients with hemiplegia was negatively correlated with paralyzed upper limb function (rs = 0.90, p = 0.001). In comparison with the control group, patients with hemiplegia had a higher number of fixations per second (p = 0.020), and the ratio of fixation time to movement execution times was also higher (p = 0.008). Additionally, whereas the control group more often demonstrated fixation at tags (p = 0.001), patients with hemiplegia fixated more often at the body of the clothes (p = 0.001) and sleeves (p = 0.001), especially fixation on their own nonparalyzed hands (p = 0.001). Conclusions: In hemiplegic patients, the more severe the paralysis, the more the patients’ movements tended to rely on visual cues. Nevertheless, their perception of visual cues was very inefficient when compared with the control group, suggesting that they disrupted the execution of movements.
Yumi Suzuki1,2*, Hiromi Fujii1,2 and Emiko Fukuda3
Keywords: Visual Cues; Hemiplegia; Clothing; Fixation Durations; Fixation Position
Introduction
Dressing actions are acquired in childhood, and adults perform these actions, almost unconsciously and automatically [1]. Conversely, it has been reported that many patients with hemiplegia after cerebrovascular accidents have difficulty changing clothes [2]. Walker et al. reported that 76% of therapists felt that “orientating clothing and relating it to body parts was a major dressing difficulty” [3]. There are reasons for difficulty in dressing, for example, problems with higher brain functions, including perception and cognition, such as confusion in motor procedures or the pure inability to orient clothing [4, 5, 6]. In clinical practice, patients with hemiplegia have been observed to move their clothes impatiently to find their sleeves. These behaviors are also observed in patients with hemiplegia without unilateral neglect or loss of dressing, which makes dressing difficult. When observing such situations in our practice, we began to consider that patients with hemiplegia might be taking in different visual information into their brains when they get dressed than healthy people.
Land et al. reported that when people with normal brains attempt to do something, they first look at the object with their eyes to obtain this information, but “objects irrelevant to the task are rarely fixated” [7]. Based on this statement, we hypothesized that the change in fixation during the dressing action in normal subjects may involve a process that facilitates the manipulation of clothing by efficiently incorporating visual cues. If patients with hemiplegia have problems taking in visual information, the problem occurs before the brain can recognize the clothing. However, previous reports have only suggested that problems occur in the cognitive processing process in the brain after the intake of visual information (hemiparetic neglect) or problems in planning and executing movements (dressing apraxia) [8]. Thus, we decided to investigate how visual information is taken in by patients with hemiplegia when they dressed. This study aimed to compare the process of taking in visual cues during dressing in patients with hemiplegia with those of healthy individuals and to elucidate the characteristics. We hope to obtain a better understanding of the factors that contribute to the difficulty in dressing faced by patients with hemiplegia. We will also be able to provide more detailed guidance on how to check the garment.
Materials and Methods
This study was designed as a pilot cross-sectional observational and analytical study and was conducted from October 2009 to September 2015. Both patients with hemiplegia and controls were fitted with a device for measuring eye movement. We observed and analyzed patients’ eye movements while they put on a shirt.
Participant
Patients with hemiplegia were recruited from among individuals attending the public Okiyama General Hospital. The median age (minimum–maximum) of the participants was 65 (range, 49–79) years in patients with hemiplegia and 63 (range, 36–72) years in the controls. Both groups were required to fulfill the following participation criteria: (1) age between 20 and 80 years, (2) ability to dress themselves independently, (3) near visual acuity of 0.5 or better with the naked eye on the Randolph ring test [9], and (4) ability to understand instructions given in Japanese. The participation criteria for patients with hemiplegia were as follows: (5) occurrence of only one stroke, (6) no hemorrhage or infarction of the posterior cerebral artery or damage to the posterior cerebral region, and (7) no clinical signs of visual field defects or higher brain dysfunction.
The exclusion criteria were as follows: concomitant degenerative neurologic disease, severe eye disease, history of neurosurgery, severe osteoarticular disease, and severe dementia.
The experiment was conducted according to the Declaration of Helsinki, and prior approval was obtained from the Ethical Review Committees of the Public Okiya General Hospital (02078) and Yamagata Prefectural University of Health Sciences (17-1109). The research collaborators who would serve as participants were informed of the purpose and implementation of the study and provided written consent for research cooperation.
Mechanical Materials
The experiment was conducted under fluorescent illumination of approximately 1000 lux. The equipment used in this study included an eye movement measurement system (EMR-8B, NAC) comprising three devices: an eye camera attached to the head unit, an eye mark signal (viewpoint position relative to the viewing image) detection unit, and a controller. In this experimental setup, eye movements within a circle of 29.1 cm in diameter were detected, corresponding to an analysis capacity of approximately 1.4 mm. The controller matched the eye mark signal with the field-of- view image sent from the eye camera and output the image along with the pupil image to a connected 640 × 480-pixel monitor (KV-14MF1, Sony Corporation) at 60 Hz. Hence, the temporal and spatial resolutions were 0.017 s and 0.762 mm, respectively. We used EMRd Factory (NAC) as the analysis software for eye movements.
Task
The experimental task was to unfold a folded yellow- green band collar shirt (hereafter referred to as “the shirt”) and reach into the sleeves. We chose this garment because, although pullover shirts worn over the head have been suggested as a suitable garment for teaching dressing [10], the participants in this study were independent in their dressing. Additionally, we determined that this shirt would require more confirmation from the participants, as it has more components than the pullover shirt does. Figure 1 shows the schematic diagram of the experimental setup and each part of the shirt and the part to be analyzed.
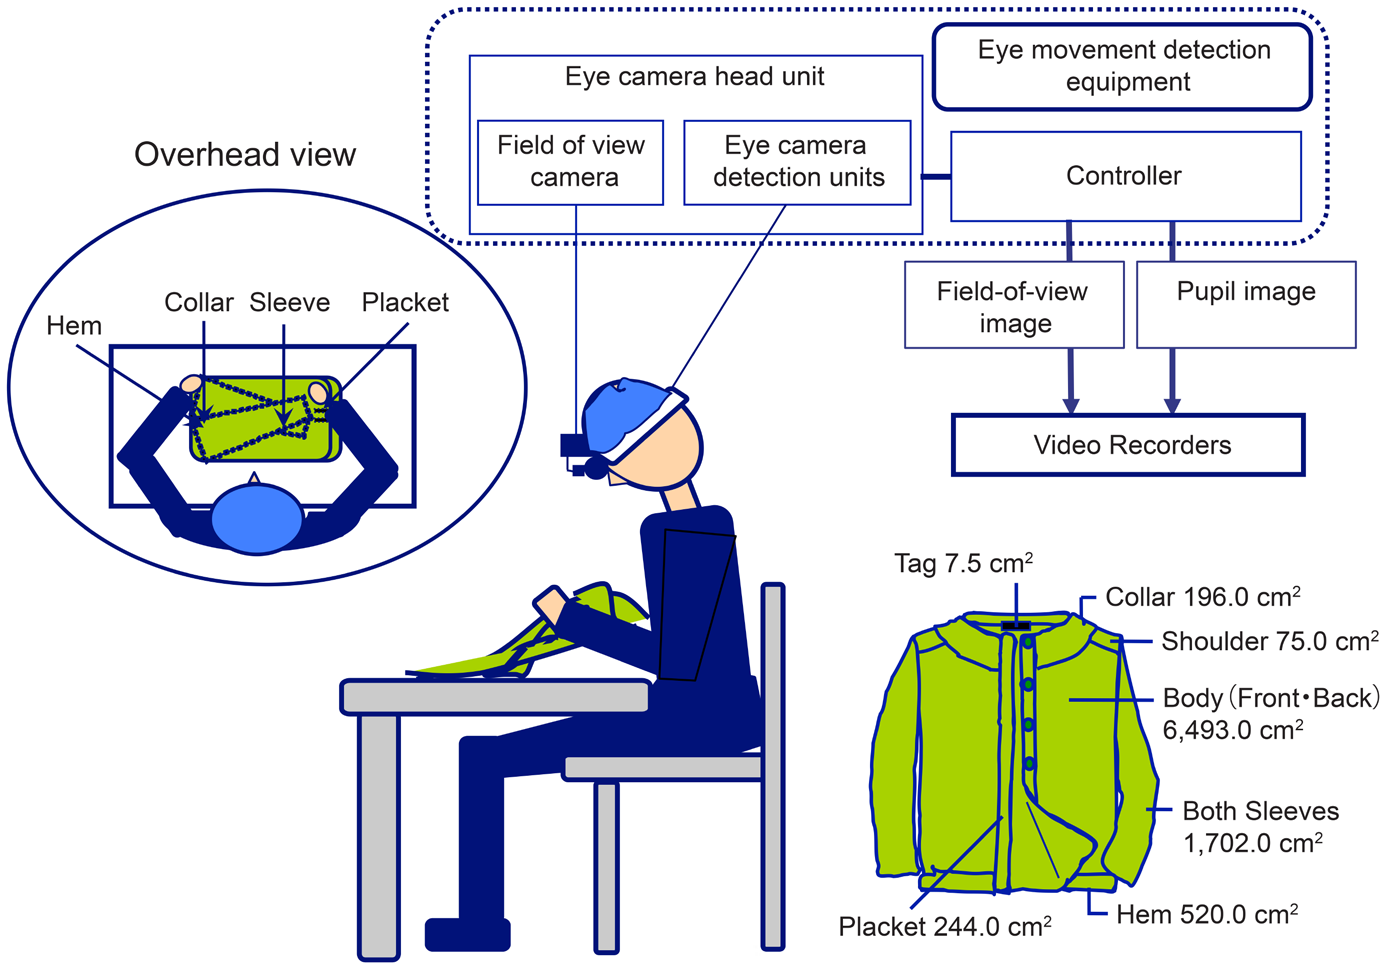
Figure1: Experimental Setup.
Procedure
Primary outcome measures (eye movements during dressing) The participants weared the head unit and sat in front of a flat desk that was 70 cm high, with a space of approximately 40 cm in front of them to operate the shirts. Participants were calibrated before the experiment to match their head movements with the eye mark signals and the visual field images captured by the visual field camera, and then, they stood still and waited for the experiment to start.
Just before the start of the experiment, the examiner placed a folded shirt in front of the subject and covered the shirt with a shielding cloth to avoid involving visual information as much as possible. The starting point of the experiment was set at the time at which the examiner removed the shielding cloth with a shout of “please begin.” The experiment endpoint was set as the time at which the subject’s hand entered the sleeve.
During the experiment, no instructions were given regarding the action procedure, and the participants followed their normal dressing motions. Thus, to avoid prediction, we did not provide the participants with any information about the shirt to be used, except for the instruction, “Please unfold your clothes and put them on.” Because the equipment used is able to detect eye mark signals with or without head or trunk movement, no restrictions on head or trunk movement were implemented.
Evaluation of secondary clinical outcomes (physical and cognitive function tests) The perceptual evaluation (superficial and deep senses) was performed on all participants. We also conducted perceptual tests on the control group because there are disorders that can occur even if patients are not aware of them, such as peripheral neuropathy [11]. For the perception test, the Semmes–Weinstein monofilament test was performed on the index finger and thumb of the participants, and an evaluator size of ≦3.22 was considered normal and 3.61 4.31 or less was considered “reduced light touch” [12, 13]. Deep sensory testing was performed using the Rivermead Assessment of Somatosensory Performance joint motion and motion direction identification method in 10 directions: one direction at the elbow, four directions at the wrist, and five directions at the fingers [14]. Physical assessment was performed in patients with hemiplegia, including the Brunstrom recovery stage (BRS) of the upper limbs and fingers [15] and the Manual Function Test (MFT) [16]. Additionally, for patients with hemiplegia, as a matter of confirmation, because higher brain dysfunction affects dressing behavior, we administered the line-cutting test of the Behavioral Inattention Test [17] and the visuospatial perception test of the Stroke Injury Assessment Set [18].
Analysis
The primary outcomes were (1) time of task execution, (2) total fixation duration, (3) average number of fixations per second, (4) average fixation duration per fixation, (5)
fixation position, and (6) ratio of total fixation duration to total motion time. Outcomes 1–4 were analyzed by EMRd Factory. (5) The fixation positions recorded on the video recorder were first analyzed using EMR d Factory because they needed to be corrected for the subject’s neck and trunk movements and shirt movements. Next, the data were imported into PowerPoint 2016 using a personal computer (Sony Corporation VAIO PCV-R51) and analyzed after correction with fixation.
Fixation of the viewpoint was defined as a phenomenon in which the viewpoint remains fixed on the object or part of the object [19, 20]. Specifically, the eye mark signal was fixed continuously at the same position in the visual field image for more than about 100 ms [21, 22]. However, considering the physiological nystagmus of the eye, a visual angle of approximately 0.2° [23] was set as the same position on the PowerPoint. Secondary clinical outcomes were analyzed by examining the relationship between the results of the primary outcomes and the results of the BRS upper extremities and fingers, MFT paralyzed and nonparalyzed sides, line-cutting test, and visuospatial perception test. Statistical Analysis For statistical processing, we performed the chi-square test for gender and used Spearman’s correlation coefficient for the relationship between the primary and secondary clinical outcomes of patients with hemiplegia and the relationship between task execution time and total fixation duration. Mann–Whitney U test was used for the comparison of task execution time, number of fixations, fixation duration, and between total task execution time and total fixation duration. The level of significance for each was set at p< 0.05. The statistical software used was SPSS ver 24.
Results
Participant attributes and results of secondary clinical outcomes Table 1 shows the attributes of the test participants. Of the11 patients with hemiplegia, eight had middle cerebral artery infarction and one each of brainstem infarction, subcortical and thalamic hemorrhage. Table 1 shows the attributes of the patients with hemiplegia and the results of the secondary clinical outcomes.
Relationship between primary and secondary clinical outcomes of patients with hemiplegia Table 2 shows the relationship between the primary and secondary clinical outcomes of patients with hemiplegia. There was a high negative correlation between the number of fixations per second and the BRS upper limb, finger, and MFT paralyzed side.
Comparison of patients with hemiplegia and control group Table 3 shows the results of the comparison of the primary outcomes of patients with hemiplegia and the healthy control group. There were differences in the time of task execution, total fixation duration, average number of fixations per second, and ratio of total fixation duration to motion times.
Comparison of the number of times and duration of fixations on each part of the shirts Table 4 shows the comparison of the number of times and duration of fixations on each part of the shirts. Patients with hemiplegia had a higher number of fixations for the body of the clothes and sleeve but lower for the tag. In terms of fixation duration, patients with hemiplegia had a longer duration of hand, sleeve, and other fixations than the healthy control group did. Nevertheless, they had a shorter fixation duration for tag and placket than the healthy control group did.
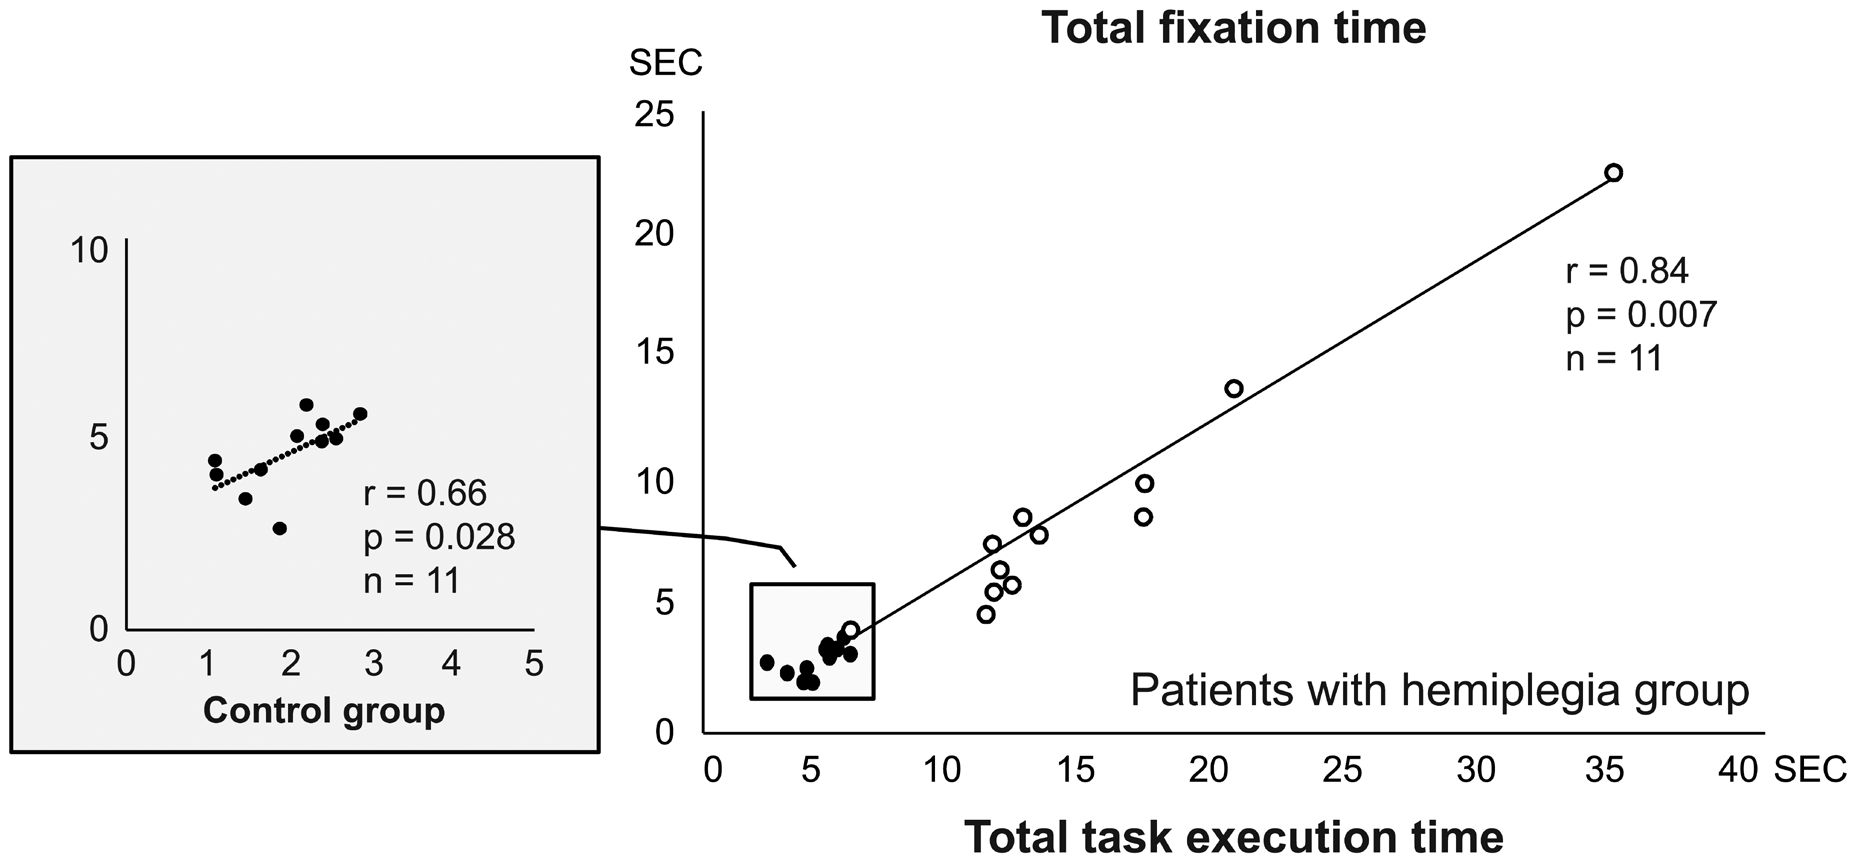
Relationship between task execution and total fixation duration In patients with hemiplegia, there was a high correlation between total task execution time and total fixation duration (Figure 2).
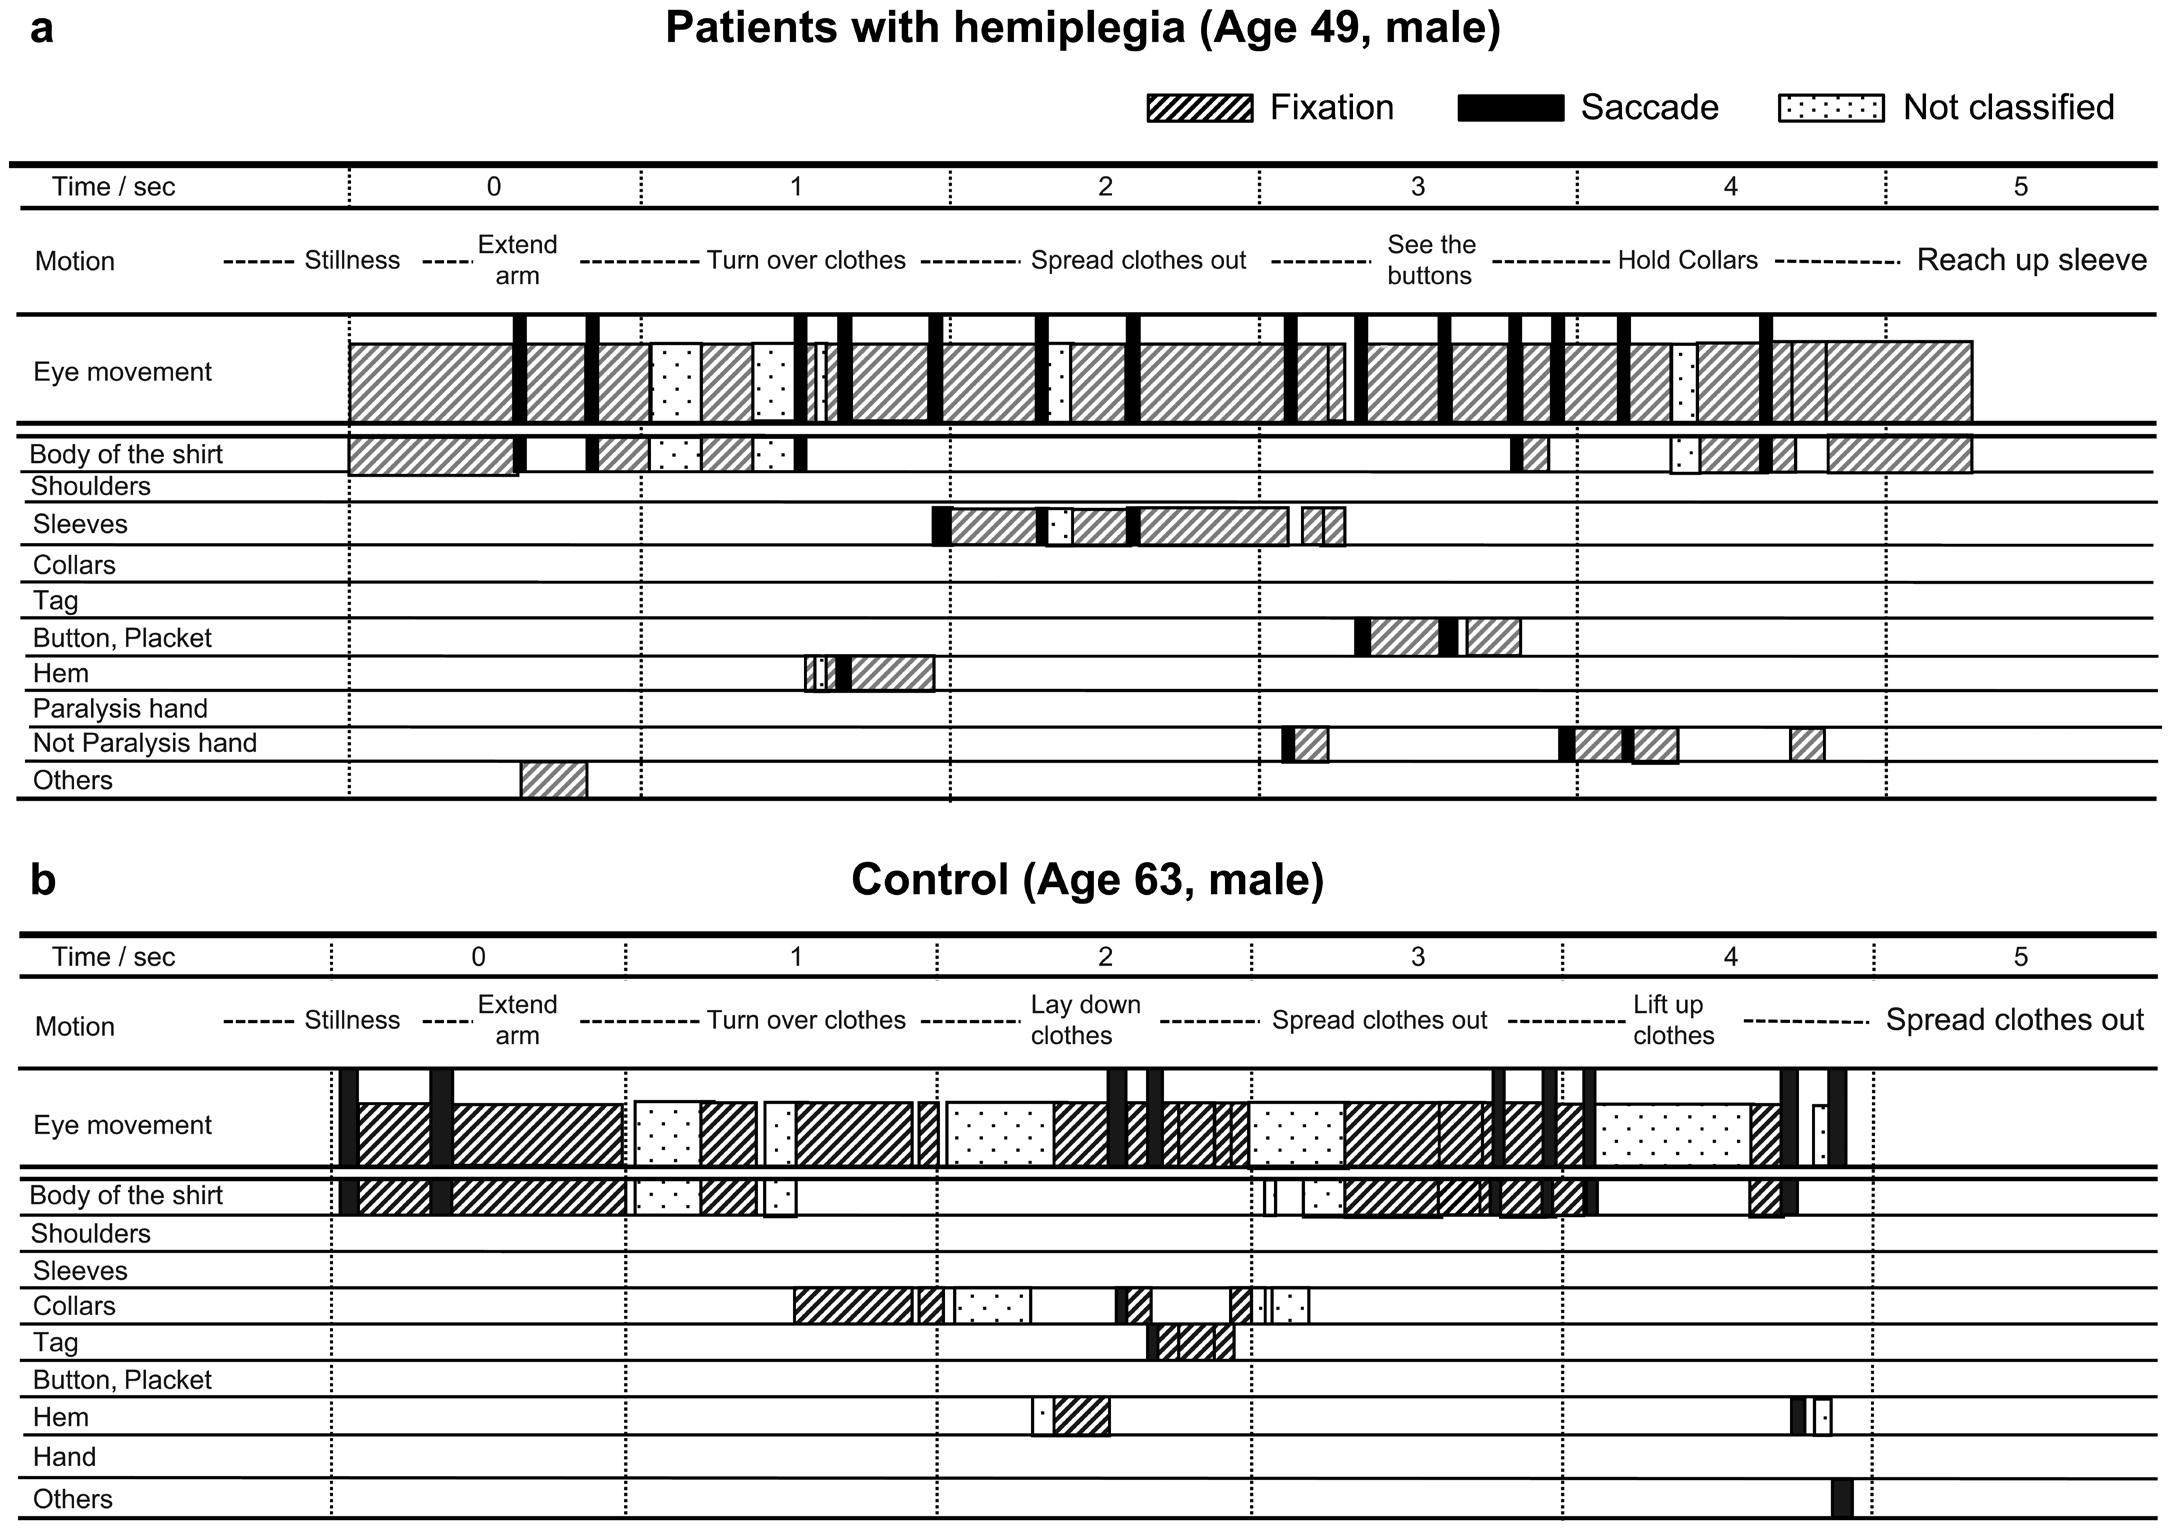
Comparison of eye movements during the task between patients with hemiplegia and control Figure 3 shows examples of eye movements during the task. A shows a patient with hemiplegia (age 49 years, male), and B shows a healthy subject (age 63 years, male). The performance time of each task was 5,247 ms for A and 4,884 ms for B. A frequently fixated on shirts in general and showed multiple fixations at one site. Thus, A often returned to the area after looking at it once. A was also observed to not look at the tag or collar but to look at the nonparalyzed hand that was performing the movement. Conversely, B was often found to be fixated nowhere, even when performing an action. B’s eyes then went to the collar and tag, and he never looked at his own hands.
Figure 3 shows the uptake of visual cues by one patient with hemiplegia (A) and one healthy control (B) during dressing in terms of eye movements and uptake position. The horizontal axis is time (s). The blocks in the second row of the horizontal axis show the movements of the dressing action, and the blocks in the third row show the eye movements during each action. The third row shows the eye movements at each time point, where the diagonal lines are fixations and the black bars are saccades. The dotted blocks are eye movements that cannot be classified. The blocks in the fourth and subsequent lines represent the parts of the shirt and show the eye movements observed during the dressing process.
| ID | Age | Sex*1 | Stroke characteristics*2 | Date from the onset (Month) | Results of Primary Outcomes | |||
|---|---|---|---|---|---|---|---|---|
| Task execution time (ms) | Number of fixations per second | Duration of fixation per time (ms) | Ratio of total fixation duration to task execution time (%) | |||||
| 1 | 79 | M | L MCA distribution | 23 | 12,111 | 3.1 | 231 | 70.6 |
| 2 | 64 | M | R MCA distribution | 13 | 10,725 | 5.1 | 220 | 43.1 |
| 3 | 70 | F | L Subcortical hemorrhage | 36 | 11,253 | 2.9 | 165 | 57.1 |
| 4 | 65 | F | L MCA distribution | 14 | 12,705 | 2.7 | 165 | 61.6 |
| 5 | 58 | F | R MCA distribution | 16 | 10,956 | 3.3 | 226 | 68.3 |
| 6 | 78 | M | L Brainstem infarction | 18 | 34,485 | 3.3 | 211 | 63.3 |
| 7 | 65 | F | R MCA distribution | 26 | 16,698 | 3.3 | 190 | 59.2 |
| 8 | 49 | F | L Thalamic hemorrhage | 15 | 5,275 | 2.9 | 225 | 77.4 |
| 9 | 69 | F | R MCA distribution | 20 | 20,064 | 3.3 | 204 | 68.3 |
| 10 | 56 | M | R MCA distribution | 15 | 16,844 | 1.4 | 292 | 41.7 |
| 11 | 64 | F | L MCA distribution | 13 | 11,645 | 2.1 | 224 | 46.2 |
Table 1: Relationship between the result of primary outcomes and secondary clinical outcomes BRS: Brunstrom recovery stage; MFT:
- *1M: male F: female R: right L: left; *2MCA: middle cerebral artery
- Relationship between the result of primary outcomes and secondary clinical outcomes
- Secondary clinical outcomes
- Median (min– max) n = 11
- Time of task execution
- Total of fixation duration
- Number of fixations per second
- Duration of fixation time rs ρ value rs
- Ρ value rs
- Ρ value rs
- Ρ value
- BRS U/L
- Ⅳ(II– V)
- −0.03
- 0.90
- −0.27
- 0.38
- −0.85
- 0.01*
- 0.25
- 0.42
- BRS Finger
- V (II–VI)
- −0.08
- 0.77
- −0.33
- 0.28
- −0.76
- 0.01*
- 0.00
- 0.97
- MFT Paralyzed side(%)
- 56.3 (12.5–96.3)
- −0.03
- 0.90
- −0.37
- 0.23
- −0.90
- 0.01*
- 0.26
- 0.39
- MFT Nonparalyzed side(%)
- 93.8 (78.1–96.9)
- −0.32
- 0.30
- −0.32
- 0.30
- 0.33
- 0.29
- 0.26
- 0.40
- Line-cutting
- 9 (8–9)
- 0.07
- 0.81
- 0.37
- 0.23
- 0.00
- 1.00
- −0.07
- 0.81
- Test (score)
- 0 (0-0)
- ―
- ―
- ―
- ―
- ―
- ―
- ―
- ―
- Visuospatial Perception
- Test (score)
- 3(3-3)
- ―
- ―
- ―
- ―
- ―
- ―
- ―
- ―
Table 2: Relationship between the result of primary outcomes and secondary clinical outcomes
| Comparison item | Patients with hemiplegia | Controls | |||
|---|---|---|---|---|---|
| Median (min–max) | P value | r | |||
| Age | 65 (49–79) | 63 (36–72) | 0.22 | ||
| Sex (male/female) | 5/6 | 4/7 | 1.00 | ||
| Sensorysuperficial(normal/mildblunted/blunted) | 8/2/1 | 11/0/0 | 0.18 | ||
| Deep (normal/mild blunted/ blunted) | 8/1/2 | 11/0/0 | 0.18 | ||
| Time of task execution (ms) | 12,111(5,247–34,485) | 5742(4,884–11,979) | 0.01 | 0.81 | |
| Total of fixation duration | 4,059(7,458–21,815) | 1,883(1,108–2,574) | 0.01 | 0.82 | |
| Duration of fixation per time (ms) | 220 (165–231) | 206 (130–292) | 0.72 | ||
| Number of fixations per second(n) | 3.1(1.4–5.1) | 2.0(1.3–3.3) | 0.02 | 0.49 | |
| Ratio of total fixation time to total motion time(%) | 63.2 (43.1–77.4) | 43.7 (25.2–72.8) | 0.01 | 0.55 |
Table 3: Comparison of patients with hemiplegia and control group. A: Number of fixations
| Comparison Item | Patients With Hemiplegia | Control | P Value | r |
|---|---|---|---|---|
| Body of the clothes | 17 (7–33) | 6 (4–12) | 0.01 | 0.66 |
| Shoulder | 0 (0–3) | 0 (0–1) | 0.39 | |
| Sleeve | 11 (3–37) | 1 (0–6) | 0.01 | 0.68 |
| Collars | 3 (0–7) | 2 (1–5) | 0.25 | |
| Tag | 0 (0–1) | 2 (0–4) | 0.01 | 0.64 |
| Placket | 3 (0–8) | 2 (0–4) | 0.01 | 0.59 |
| Hem | 2 (0–5) | 0 (0–7) | 0.04 | 0.42 |
| Hand (not paralysishand) | 2 (0–13) | 0 (0–1) | 0.01 | 0.72 |
| Others | 1 (0–17) | 0 (0–3) | 0.01 | 0.61 |
Table 4: Comparison of the number of times and duration of fixations on each part of the shirt
B: Duration of fixations(msec)
| Comparison Item | Patients With Hemiplegia | Control | P Value | r |
|---|---|---|---|---|
| Body of the clothes | 199 (153–257) | 124 (103–194) | 0.95 | |
| Shoulder | 0 (0–165) | 0 (0–132) | 0.05 | |
| Sleeve | 205 (139–330) | 101 (0–132) | 0.01 | 0.56 |
| Collars | 125 (0–363) | 165 (100–165) | 0.69 | |
| Tag | 0 (0–99) | 154 (0–231) | 0.01 | 0.68 |
| Placket | 93 (0–244) | 116 (0–393) | 0.01 | 0.58 |
| Hem | 33 (0–215) | 93 (0–244) | 0.04 | 0.42 |
| Hand (not paralysishand) | 132 (0–247) | 0 (0–33) | 0.01 | 0.67 |
| Others | 173 (0–396) | 0 (0–99) | 0.01 | 0.66 |
Table 5: Comparison of the number of times and duration of fixations on each part of the shirt
Discussion
In this study, we examined the uptake of visual information in patients with hemiplegia and healthy controls during the initial action of dressing.
First, the number of fixations per second in patients with hemiplegia was highly negatively correlated with the motor function of their paralyzed hand but not with the function of the nonparalyzed hand. This is consistent with the assertion of Shingh et al who reported that eye movements in patients with hemiplegia are affected by the status of motor paralysis [24]. Additionally, patients with hemiplegia had a greater number of fixations per second than the control group did. Specifically, most of the control group looked only at the shirt area once or twice, whereas patients with hemiplegia were observed to repeatedly look at the shirt area several times. Although this is the case for right-brain-injured patients, it has been reported that patients with hemiplegia without hemiplegic neglect should be immobilized more frequently than healthy individuals [25].
Patients with hemiplegia had a higher frequency of fixation on a wide area, such as the torso and sleeves of the garment, and a longer total fixation time, whereas the control group had a higher frequency of fixation to the tags, with a clear difference in the area of concentration. Because the role of fixation in behavioral processes is to extract information [26], we guessed that the control group was able to detect the orientation of the garment, such as inside out, up and down, and left and right, from the small tags. However, patients with hemiplegia did not try to find the small tags. Additionally, they showed a marked tendency to fixate on objects other than shirts. We thought that the reason for this might be that patients with hemiplegia have a lower level of selective attention and divided attention [27]. This led us to speculate that patients with hemiplegia might have potential attentional deficits that affect their behavior, although not significantly so [28, 29]. Furthermore, patients with hemiplegia had a marked fixation on their nonparalyzed hands. Similar to the present study, many previous reports have indicated that patients with hemiplegia looked at their hands during upper limb movements, whereas the control group was able to perform the task without looking at their hands [25, 30, 31]. The control group has shown the ability to perform the task without directly observing the position of the hand, as long as the sensory information is normal [30].
The high rate of fixation in the patients with hemiplegia is indicative of inadequate visual processing [32]. The total fixation time ratio to the execution time of movements in patients with hemiplegia was generally high. For these reasons, we speculated that because tactile sensations are more sensitive to visual information, patients with hemiplegia might look at their hands in an attempt to directly confirm their movements or to facilitate tactile stimulation by looking at their hands [33, 34, 35]. Our results suggest that although patients with hemiplegia rely heavily on visual information for dressing, they also take in a lot of highly biased information because of motor paralysis and poor attention.
Limitations
This study has some limitations that should be noted. The number of participants was small, and future studies should increase the number of participants. Eye movements were stored in a video camera and analyzed in this experiment, so the time resolution was coarse, and it was difficult to distinguish details such as micro saccades. In terms of fixation time, we did not consider <100 ms as fixation in this study. Thus, it cannot be denied that there were cases of fixation that were <100 ms. We also assumed that more accurate findings will be obtained by more rigorously identifying the damaged area of the brain.
Conclusion
In patients with hemiplegia, the number of fixations per second was negatively correlated with upper limb function. Conversely, we found a high correlation between total task execution time and total fixation time. Additionally, when compared with the control group, we noted differences in task execution time, total fixation time, average number of fixations per second, and the ratio of total fixation time to movement time. Among patients with hemiplegia, the number of fixations on the garment body and sleeves was higher, and that on the tag was lower.
Acknowledgments
We would like to express our sincere thanks to all of the participants who participated in this study. For English editing, we received great assistance from ENAGO (Crimson Interactive Pvt. Lt.).
Declaration of Interest Statement
The authors declare no conflicts of interest associated with this manuscript. The authors have no conflicts of interest directly relevant to the content of this article.
References
-
Flensborg Madsen T, Gronkjær M, Mortensen EL (2019) Predictors of early life milestones: Results from the Copenhagen Perinatal Cohort. BMC Pediatr 19(1): 420.
-
Walker CM, Walker MF (2001) Dressing ability after stroke: A review of the literature. Br J Occup Ther 64(9): 449-454.
-
Walker CM, Walker MF, Sunderland A (2003) Dressing after a stroke: A survey of current occupational therapy practice. Br J Occup Ther 66(6): 263-268.
-
Titus MN, Gall NG, Yerxa EJ, Roberson TA, Mack W (1991) Correlation of perceptual performance and activities of daily living in stroke patients. Am J Occup Ther 45(5): 410-418.
-
Walker CM, Sunderland A, Sharma J, Walker MF (2004) The impact of cognitive impairment on upper body dressing difficulties after stroke: A video analysis of patterns of recovery. J Neurol Neurosurg Psychiatry 75(1): 43-48.
-
Fujita T, Sato A, Yamamoto Y, Otsuki K, Tsuchiya K, Tozato F (2016) Motor function cutoff values for independent dressing in stroke patients. Am J Occup Ther 70(3): 1-7.
-
Land MF (2009) Vision, eye movements, and natural behavior. Vis Neurosci 26(1): 51-62.
-
Walker MF, Sunderland A, Fletcher Smith J, Drummond A, Logan P, et al. (2012) The DRESS trial: A feasibility randomized controlled trial of a neuropsychological approach to dressing therapy for stroke inpatients. Clin Rehabil 26(8): 675-685.
-
Rohrschneider K, Spittler AR, Bach M (2019) Comparison of visual acuity measurement with Landolt rings versus numbers. Ophthalmologe 116(11): 1058-1063.
-
Day HM, Horner RH (1986) Response variation and the generalization of a dressing skill: Comparison of single instance and General Case instruction. Appl Res Ment Retard 7(2): 189-202.
-
Dabbagh A, Mac Dermid JC, Yong J, Packham TL, Macedo LG, et al. (2021) Diagnostic accuracy of sensory and motor tests for the diagnosis of carpal tunnel syndrome: A systematic review. BMC Musculoskelet Disord 22(1): 337.
-
(2011) North Coast Medical, Inc. Touch-test sensory evaluator. In: Touch-Test-Sensory- Evaluator. Available: https://www.ncmedical.com/products/touch-test- sensory-evaluators_1278.html
-
Suda M, Kawakami M, Okuyama K, Ishii R, Oshima O, et al. (2020) Validity and reliability of the Semmes- Weinstein monofilament test and the thumb localizing test in patients with stroke. Front Neurol 11: 625917.
-
Winward CE, Halligan PW, Wade DT (2002) The Rivermead Assessment of Somatosensory Performance (RASP): Standardization and reliability data. Clin Rehabil 16(5): 523-533.
-
Da Cunha MG, Da Cunha MG, Da Cunha ALG, Tamura BM (2017) Botulinum toxin: Complications and their management. Clin Approaches Proc Cosmet Dermatol 1-13.
-
Miyamoto S, Kondo T, Suzukamo Y, Michimata A, Izumi SI (2009) Reliability and validity of the Manual Function Test in patients with stroke. Am J Phys Med Rehabil 88: 247-255.
-
Hartman Maeir A, Katz N (1995) Validity of the Behavioral Inattention Test (BIT): Relationships with functional tasks. Am J Occup Ther 49(6): 507-516.
-
Tsujimoto K, Mizuno K, Kobayashi Y, Tanuma A, Liu M (2020) Right as well as left unilateral spatial neglect influences rehabilitation outcomes and its recovery is important for determining discharge destination in subacute stroke patients. Eur J Phys Rehabil Med 56(1): 5-13.
-
Hayhoe MM, Shrivastava A, Mruczek R, Pelz JB (2003) Visual memory and motor planning in a natural task. J Vis 3(1): 49-63.
-
Abekawa N, Gomi H, Diedrichsen J (2021) Gaze control during reaching is flexibly modulated to optimize task outcome. J Neurophysiol 126: 816-826.
-
Kotowicz A, Rutishauser U, Koch C (2010) Time course of target recognition in visual search. Front Hum Neurosci 4: 31.
-
Rajashekar U, van der Linde I, Bovik AC, Cormack LK (2007) Foveated analysis of image features at fixations. Vision Res 47(25): 3160-3172.
-
Bergamin O, Straumann D (2001) Three dimensional binocular kinematics of torsional vestibular nystagmus during convergence on head-fixed targets in humans. J Neurophysiol 86(1): 113-122.
-
Singh T, Perry CM, Fritz SL, Fridriksson J, Herter TM (2018) Eye movements interfere with limb motor control in stroke survivors. Neurorehabil Neural Repair 32(8): 724-734.
-
Meadmore KL, Exell TA, Burridge JH, Hughes AM, Freeman CT, et al. (2018)Upper limb and eye movement coordination during reaching tasks in people with stroke. Disabil Rehabil 40(20): 2424-2432.
-
Foulsham T (2015) Eye movements and their functions in everyday tasks. Eye (Lond) 29(2): 196-199.
-
Lodha N, Patel P, Shad JM, Casamento Moran A, Christou EA (2021) Cognitive and motor deficits contribute to longer braking time in stroke. J Neuroeng Rehabil 18(1): 7.
-
Hyndman D, Pickering RM, Ashburn A (2008) The influence of attention deficits on functional recovery post stroke during the first 12 months after discharge from hospital. J Neurol Neurosurg Psychiatry 79(6): 656-663.
-
Spaccavento S, Marinelli CV, Nardulli R, Macchitella L, Bivona U, et al. (2019) Attention deficits in stroke patients: The role of lesion characteristics, time from stroke, and concomitant neuropsychological deficits. Behav Neurol 7835710.
-
Santello M, Flanders M, Soechting JF (2002) Patterns of hand motion during grasping and the influence of sensory guidance. J Neurosci 22(4): 1426-1435.
-
Vercher JL, Sares F, Blouin J, Bourdin C, Gauthier G (2003) Role of sensory information in updating internal models of the effector during arm tracking. Prog Brain Res 142: 203-222.
-
Walle KM, Nordvik JE, Becker F, Espeseth T, Sneve MH, et al. (2019) Unilateral neglect post stroke: Eye movement frequencies indicate directional hypokinesia while fixation distributions suggest compensational mechanism. Brain Behav 9(1): e01170.
-
Juravle G, Velasco C, Salgado Montejo A, Spence C (2015) the hand grasps the center, while the eyes saccade to the top of novel objects. Front Psychol 6: 633.
-
Fisk GD, Mennemeier M (102) Common neuropsychological deficits associated with stroke survivors’ impaired performance on a useful field of view test. Percept Mot Skills 102(2): 387-394.
-
Villarreal S, Linnavuo M, Sepponen R, Vuori O, Jokinen H, et al. (2020) Dual Task in large perceptual space reveals subclinical hemispatial neglect. J Int Neuropsychol Soc 26(10): 993-1005.
- Electrolyte Considerations for Athletes
- Comprehensive Rehabilitation in Adults with Diabetic Peripheral Neuropathy: A Literature Review on Frequency, Intensity, and Duration Parameters
- Exercise Duration and Its Association with ADHD Symptom Severity in Children and Adolescents: A Parent-Reported Survey Study
- Adaptation of the Adult Neurophysiology of Pain Questionnaire for Use in Pediatrics
- A Non-Pharmacological Multidisciplinary Pain Program within a Hospital Wellness Program: A Mixed Methods Study
- The Effect of Frenkel's Exercise with PNF on Functional Reach in Stroke Survivors: A Randomized Control Trial