Segmentation of Electrocardiograms as an Example of Experimental Curves Processing Using Variable Resolution
<p>A new segmentation method of signals on the example of electrocardiograms is proposed. Unlike other known methods, for example, the canny method, a priori data on interference and / or a signal (image) is not used. Segmentation of signals and halftone images distorted by interference is one of the oldest problems in computer vision. But human vision solves this task almost independently of our consciousness. It was discovered for visual neurons, that sizes of receptive fields' excitatory zones change during visual act, which eventually mean dynamical changes in visual system's resolution i.e. coarse-to-fine phenomenon in living organism. We assumed that "coarse-to-fine" phenomenon, i.e. several different resolutions, is used in human vision to segment images. A "coarse-to-fine" algorithm for segmentation of experimental graphs was developed. The main difference of algorithm mentioned above from others is that decision is made taking into account all partial solutions for all resolutions being used. This ensures stability of final global solution. The algorithm verification results are presented. It is expected that the method can naturally be expanded to segmentation of halftone images.</p>
Short Communication
Experimental curves represent the results of measurements, as a rule, distorted by interference. The most basic feature of the experimental curve is its shape, which displays function that generates the observed realization of curve and characterizes parameters of the displayed object or process. It is assumed that the measured values are represented the realization of some unknown function existing on a given measurement interval, and the result of the measurement is a finite sequence of pairs "reference number-value". Since different curves that relate to the same object can differ from each other in scale, interference level, number of measurements, etc., direct use of neural network methods or methods that rest on statistical pattern recognition for solving the problem of comparing the shape of graphs or curves does not seem possible. In this case, the unknown functions that describe experimental curves must be approximated by functions that are invariant to affine transformations for their subsequent processing and comparison.
Bioinformatics & Proteomics Open Access Journal
Analytical description of a curve based on parametrically defined splines [1, 2] is one of the suitable forms for further processing and analysis. However, the methods of presentation of the experimental curves by splines suggest that obtained experimental curves represent processes or phenomena that are determined by unknown smooth functions. At the same time a large number of practical problems require processing of experimental curves that can be represented adequately only by unknown piecewise smooth functions. It is natural to assume that the approximating function must also be piecewise smooth. The curve defined by function y = f(x), (a ≤ x ≤ b) is piecewise smooth if the function y = f(x) has a finite number of discontinuities on [a, b] and the segment [a, b] can be divided by points into a finite number N of partial segments, so that function y = f(x) has continuous derivatives not equal to zero simultaneously on each segment. If splines are selected as approximating function, this function takes the form of a sequence of polynomials $$ y = f ^ {(1)} (x) \mid \left(t _ {0} \leq x < t _ {1}\right), f ^ {(2)} (x) \mid \left(t _ {1} \leq x < t _ {2}\right), \dots , f ^ {(N - 1)} (x $$
x < t ),...,f
$$ \left(t _ {0} \leq x < t _ {1}\right), f ^ {(2)} (x) \mid \left(t _ {1} \leq x < t _ {2}\right), \dots , f ^ {(N - 1)} (x) \mid \left(t _ {N - 1} \leq x \leq t _ {N}\right), $$ Where $$ f (x) \mid \left(t _ {n} \leq x < t _ {n + 1}\right) = a _ {0} ^ {(n)} x ^ {k} + a _ {1} ^ {(n)} x ^ {k - 1} + \dots + a _ {k - 1} ^ {(n)} x + a _ {k} ^ {(n)} $$ − ≤
![Figure 1: Segmentation of experimental curve. Thus, it is necessary to consider a set of boundary points _T_= {_t__0_, _t__1_, …, _t__N_} and their number _N+1_ in order to segment the experimental curve (Figure 1). Phenomenon of selecting the separate segments on a graph is an act of visual perception by its nature. The discontinuities of the curve or its gradient are identified visually and used for making decisions. Segmentation of images (i.e. object contour selection) presumably has the same nature as graph segmentation. So the mechanisms of visual perception and known methods of image segmentation should be taken into account when developing the method for segmentation of experimental curves. The aim of our research is to introduce new methods for processing signals and images, in particular, to develop a new algorithm for segmenting experimental curves suitable for automated signal processing based on these methods and finally, to demonstrate the results of this algorithm's application to one-dimensional signals distorted by interference. As an example, automatic processing of electrocardiograms can be considered [3,4]. The task of segmenting the ECG into cycles must be solved first. In 70s of the last century, neurophysiologists discovered the phenomenon of changes in sizes of receptive fields’ excitatory zones in the visual system neurons, which was investigated and confirmed later [5]. If at the beginning of visual act receptive field consists of maximum number (tens, sometimes hundreds) of receptors, then by the end of visual act this amount decreases to minimum possible amount - 1-2 receptors. Thus, we can assume that: 1) for visual system, there exists a variable resolution that is changing during visual act and is determined by the size of excitatory zone of the neuron receptive field at each moment of time; 2) the receptive field of a neuron is a discrete analogue of $$](/fulltextimages/1508/fig_1.png)
Figure 1: Segmentation of experimental curve. Thus, it is necessary to consider a set of boundary points T= {t0, t1, …, tN} and their number N+1 in order to segment the experimental curve (Figure 1). Phenomenon of selecting the separate segments on a graph is an act of visual perception by its nature. The discontinuities of the curve or its gradient are identified visually and used for making decisions. Segmentation of images (i.e. object contour selection) presumably has the same nature as graph segmentation. So the mechanisms of visual perception and known methods of image segmentation should be taken into account when developing the method for segmentation of experimental curves. The aim of our research is to introduce new methods for processing signals and images, in particular, to develop a new algorithm for segmenting experimental curves suitable for automated signal processing based on these methods and finally, to demonstrate the results of this algorithm's application to one-dimensional signals distorted by interference. As an example, automatic processing of electrocardiograms can be considered [3, 4]. The task of segmenting the ECG into cycles must be solved first. In 70s of the last century, neurophysiologists discovered the phenomenon of changes in sizes of receptive fields’ excitatory zones in the visual system neurons, which was investigated and confirmed later [5]. If at the beginning of visual act receptive field consists of maximum number (tens, sometimes hundreds) of receptors, then by the end of visual act this amount decreases to minimum possible amount - 1-2 receptors. Thus, we can assume that: 1) for visual system, there exists a variable resolution that is changing during visual act and is determined by the size of excitatory zone of the neuron receptive field at each moment of time; 2) the receptive field of a neuron is a discrete analogue of $$ f (x) \mid \left(t _ {n} \leq x < t _ {n + 1}\right) = a _ {0} ^ {(n)} x ^ {k} + a _ {1} ^ {(n)} x ^ {k - 1} + \dots + a _ {k - 1} ^ {(n)} x + a _ {k} ^ {(n)} $$ − ≤ neighborhood of point in a continuous 2-dimensional space. To analyze continuity of a function in continuous two- dimensional space, the classical definition of continuity of a function in εεε form is successfully used: if for each ε>0 there exists such ε>0 that for any value of variable x that belongs to δ-neighborhood of point c the values of function f(x) belong to ε-neighborhood of f(c). You should pay attention to how the continuity of function is checked at a point. Starting with a certain value |x1-c|, the neighborhood of the point c decreases (|x1−c|>|x2−c|, |x2−c|>|x3−c|,) tending to 0. Here f(x) is assumed to be continuous at a point c if the neighborhood f(c) also tends to 0 (|f(x1)-f(c)|>|f(x2)-f(c)|, |f(x2)-f(c)|>|f(x3)-f(c)|,). Thereby, to analyze the continuity of a function at a point, changing neighborhood of this point is used. The decrease in the size of receptive field excitatory zone can be considered as a decrease in proportions of point neighborhood at center of the receptive field. The process, which is used in the analysis of continuity of a function at a point in classical mathematical analysis, is repeated in visual system of human and animals each visual act. The essential difference between resolution Bioinformatics & Proteomics Open Access Journal
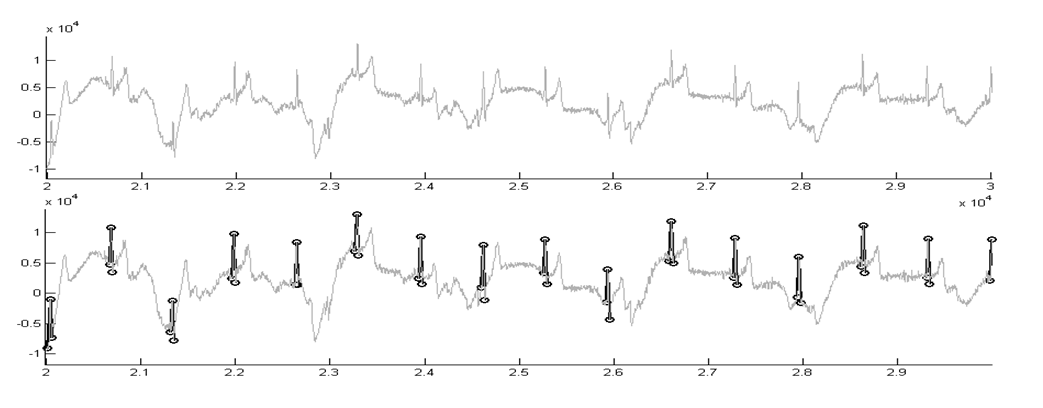
changes in visual system from analysis of continuity of a function at a point is that the elements of the receptive field are objects of a discrete space. Similarly, the classical definition is unsuitable for analyzing continuity of experimental curves, since they are representations of unknown functions and are identified as sequences of values, which in turn are sets of points in some discrete space. However, at the initial moments of visual act, the excitatory zones of neurons contain many points (receptors) and until the receptor sets in the excitatory zones of the receptive fields are not empty, the definition of continuity can be applied to the brightness function determined in the discrete space of receptors and it does not contradict to classical theory of discontinuity. Thus, the above phenomenon of resolution changes in human visual system can be used to create new method of signal processing based on the concept of variable resolution. At the moment, the idea to consider initial data with variable resolution is used by researchers and developers spontaneously, most often to effectively solve problems of large computational complexity that arise when processing the visual representation of signals. Such an approach makes it possible to exclude inappropriate objects or non-informative signal sections at the early stages of processing and apply the computationally- intensive part of algorithm to reduced volume of data. In [6], a review of methods from the field of signal processing that use the idea of variable resolution to save computational resources is presented. The original image is considered with several reduced resolutions in each of them. In the automated processing of noisy images, preliminary processing of the input image using different filters is used to eliminate undesirable details. In the simplest case, a Gaussian filter is applied and the processing algorithm receives a blurred image on the input. Such a procedure is used, for example, in the Canny algorithm [7]. The result of his work depends on the unknown parameter σ - "blur", which has the meaning of dispersion. In general, if you use a filter to preprocess a noisy image, the result will depend on the size of the filter aperture. It was shown in [2] that the artificial blurring of the original image allows solving the task of recognizing text on a textural background, which in principle cannot be solved by traditional methods of recognition, but nothing has been said about the sufficient degree of blurring. As you can see, regardless of the purpose for which the idea of variable resolution is applied, the exact resolution at which it is necessary to consider this or that image has not yet been evaluated. For the first time, an algorithm for segmenting an experimental curve using a variable resolution has been developed and implemented as a computer program (Figure 2). Figure 2: a.1, b.1 shows the numbers of samples of the experimental curve along the abscissa axis and the number of resolutions at which the experimental curve is investigated on the ordinate axis. The segments in Figure 2: a.1, b.1 corresponds to the intervals in the region of the exact samples on which discontinuities in the continuity of the experimental curve are found. Figure 2: b.1 shows that information on the available jumps in the experimental curve obtained at low resolutions makes it possible to exclude from consideration regions at maximum resolution in which jumps are detected due to the presence of noise. With minor additions, the algorithm was also applied in the cardiac signal segmentation application, and was tested on more than 100 samples. The results of segmentation for the 90-second cardiac signal are shown in Figure 3.
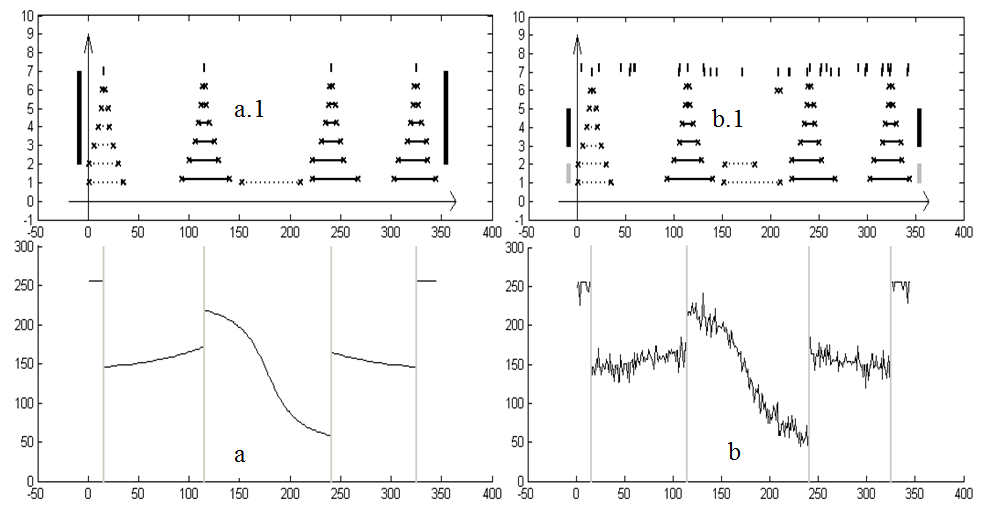
Figure 2: Segmentation example of normal (a) and noisy (b) lines of images based on variable resolution concept. The automatic separation of the cardiac signal into cardiac cycles usually occurs along the R-wave, the amplitude of which is usually much greater than the amplitude of the other components of the cycle. This assumption can’t be applied to the signal on Figure 2 due to the presence of interference, which causes the drift of the zero-level isoline from cycle to cycle. The proposed algorithm, based on the concept of variable resolution, made it possible to perform segmentation in this case. Thus, the segmentation of the experimental curve can be carried out as a search for the points of discontinuity of the piecewise smooth function that generates it. It is possible to construct new methods for segmenting experimental curves using the concept of variable resolution based on the classical theory of continuity of functions and actual advances in the field of neurophysiology of vision. In the proposed algorithm the processing results for all used resolution values are taken in consideration when making decision on segmentation. The efficiency of the algorithm is confirmed by the results of processing for signals and graphs distorted by interference. In this case no a priori information about the noise level was used.
References
-
Vitaliy Vishnevskey, Vladimir Kalmykov, Tatyana Romanenko (2008) Approximation of experimental data by Bezier curves. International Journal Information theories & applications Sofia 15(3): 235.
-
Tatyana Romanenko, Vitaliy Vishnevskey, Vladimir Kalmykov (2013) Analytical Representation of Graphs by Means of Parametrically Defined Splines. Proceedings of the international conference on applications of information and communication technology and statistics in economy and education. ICAICTSEE 536-542.
-
Jakub Parák, Jan Havlík (2011) ECG Signal Processing and Heart Rate Frequency Detection Methods. Conference: Technical Computing.
-
Max E Valentinuzzi (2007) Bioelectrical signal processing in cardiac and neurological applications and electromyography: physiology, engineering, and noninvasive applications, BioMedical Engineering OnLine 6: 27. Bioinformatics & Proteomics Open Access Journal
-
Ruksenas O, Bulatov A, Heggelund P (2007) Dynamics of Spatial Resolution of Single Units in the Lateral Geniculate Nucleus of Cat During Brief Visual Stimulation. J Neurophysiol 97(2): 1445-1456.
-
Anton Sharypanov, Alexandra Antoniouk, Vladimir Kalmykov (2014) Joint study of visual perception mechanism and computer vision systems that use coarse-to-fine approach for data processing. International Journal Information content & processing 1(3): 287-300.
-
Canny JF (1986) A computational approach to edge detection. IEEE Trans. Pattern Anal Machine Intell 8(6): 679-698.
-
Vladimir Kalmykov, Anton Sharypanov (2017) Segmentation of Experimental Curves Distorted by Noise. Journal of Computer Science Systems Biology 10(3): 050-055.
- Carbon Code for Analysis of Protein Stability in Protein Mutation
- Number of Contiguous Amino Acids in Nanon of 16A Diameter
- Identification of Hub Genes and Pathways in Cervical Cancer by Statistical and Bioinformatics Analysis
- Effect of Dietary Inclusion Levels of Moringa Olerifera Oil on the Growth Performance and Nutrient Retention of Broiler Starter Chicks
- Proteomics Loans in Kinetoplastids during the Last Decade
- “Identification of SARS-CoV-2 in Human Genome based on Protein Dynamics Conversion and Target Genes Marking via Bioinformatics Approaches”