Reproductive Performance Trends among Villagers of Birsingha Gram, Ghatal under Midnapore District, in West Bengal, India
Health is considered to be the most significant factor that triggers building of a nation. Factors related to health are the prime concern of research for medical and social researchers. The status of health among the rural population of India needs attention, and under this backdrop the present study has aimed at exploring the reproductive performance among villagers of Birsingha Gram, Ghatal under Midnapore District, in West Bengal, India. We tried to understand some of the determinants of reproductive health such as: Age at menarche, marriage, conception and childbirth as well as desired no. of children, gender preference and other health care practices. All these factors affect women’s reproductive health, which in turn affects the wellbeing of their families and overall economic growth of the nation. A total of 300 responses were taken into consideration for the present study.
Abhishikta Ghosh Roy*, Banerjee B, Naaz F and Behera B
Anthropological Survey of India, Ministry of Culture, India
Introduction
Today, health is described in a way that it encompasses all three possible definitions, given by the World Health Organization and the Lancet, in one compact description. It says health is the absence of any disease or impairment and a balanced state that allows the individual to adequately cope with all demands of daily life and the individual in turn, establishes equilibrium within himself and between himself and his socio-physical environment [1, 2]. The overall health of a population is affected by many factors. Reproductive health is an integral part of them. According to the definition given by WHO, reproductive health implies that people are able to have a satisfying and safe sex life and that they have the capability to reproduce and the freedom to decide if, when and how often to do so [3].
This implies that people should have the availability of the information and access to safe, effective, affordable and acceptable methods of birth control, access to affordable and appropriate health care services of sexual, reproductive medicine and implementation of health education programs to stress the importance of women to go safely through pregnancy and childbirth could provide couples with the best chance of having a healthy infant [4]. It further implies that reproduction is carried to a successful outcome in the form of infant and child survival, through growth and healthy child development. Reproductive fate of a population is determined by several cultural and socio-economic as well as geographical factors. The focus of the conventional demographic literature was majorly on the behavioral mechanisms which influence reproductive health, including the functioning of households, and the distribution of resources, that consequently affect the well-being of women and their children.
Problems related to reproductive health remain the leading cause of ill health and death for women of childbearing age worldwide. Impoverished women, especially those living in developing countries such as India, suffer disproportionately from unintended pregnancies, maternal death and disability, plethora of sexually transmitted diseases including HIV, gender-based violence and other problems related to their reproductive system and sexual behavior. Education and dwelling places make great differences in the fertility, fecundity and the Infant Mortality Rate (IMR) [5]. For example, an educated urbane woman tends to have a smaller number of children as compared to an uneducated rural woman. Reproductive health of a woman is hugely affected by the fertility rate and spacing among births. Studies have shown that the women in the age-group 20-24 years old have the highest age-specific fertility rate [6]. The use of various methods of contraception’s are best known alternative. To obtain an acceptable standard of good health amongst the general population of the country, National Health Policy in India was established in 1983. Under this backdrop the present study has aimed at exploring the reproductive performance among villagers of Birsingha Gram, Ghatal under Midnapore District, in West Bengal, India. We attempted to know some of the determinants of reproductive health such as: Age at menarche, marriage, conception and childbirth as well as desired no. of children, gender preference and other health care practices. All these factors affect women’s reproductive health, which in turn affects the well-being of their families and overall economic growth of the nation.
Methods and Methodology
Study Design
Studies have shown that reproductive health care for women-as well as men-would improve in India if health care providers included men and marital family members in discussions and education about women’s reproductive health issues. Taking this into consideration, we designed a qualitative study involving Focus Group Discussions (FGDs) and In-depth Interviews (IDIs) among the villagers of Birsingha Gram, Ghatal under Midnapore District, in West Bengal, India to for gain in-depth explanations of the prevailing perceptions and practices regarding their reproductive performance and other socio- cultural factors that influencing it [7].
Study Setting
The studied area, Birsingha village, is situated in Ghatal Tehsil of West Midnapur district under Burdwan Division in West Bengal, India. The village is situated 13.9km away from sub-district headquarter Ghatal. Midnapur is the district headquarter of Birsingha village. As per 2009 stats, Beersingha is the gram panchayat of Birsingha village.
Study Participants and Sampling
Prior to the study, all the villagers were introduced with the researchers by the local chiefs and a small group discussion was arranged to introduce the objective of the study. Amongst 300 informants, female to male ratio was predetermined as 1:1. The FGD participants were selected based on sex, age and residence while IDI participants were selected based on their knowledge on socio-cultural practices, religious teaching and their role within the community [8].
Data Collection
We collected data from 300 respondents using an open- ended semi-structured questionnaire to understand of participants’ knowledge of reproductive health, fertility and other reproductive practices. Discussions and interviews were conducted in Bengali language as the population was mostly comprised of Bengali speaking people and later translated to English. The FGDs for men and women were conducted separately given the sensitivity of the research topic. The IDIs were conducted privately as the respondents might shy away from answering sensitive questions [9].
Ethical Consideration
A verbal consent was obtained from all the participants after informing them about the objective of the study. Due to the cultural sensitivities and low literacy rate in the population it was adjudged pertinent to procure verbal consent and Left thumb impression on the consent forms followed by signature from the researchers verifying that consent was really taken. We had to include minor’s underage of 18 as child marriage system is prevailing in the area. In that case, married adolescents were considered as mature/ emancipated minors. Thus, their perception regarding reproductive health in terms of family planning and their knowledge about medical services a t their disposal was impaired to be studied [10].
Data Analysis
We developed an open-ended questionnaire and collected qualitative data. Then, for the purpose of review and validation, we prepared a code sheet for collecting quantitative data from FGDs and IDIs. They were then translated verbatim into English. A set of codes were developed based on the interview tools and the emerging themes from the discussions. Statistical analysis was done using SPSS and graphs were plotted using Microsoft Excel.
Results
The findings from this study identified several key socio- cultural factors influencing reproductive health: age at marriage, age at menarche, conception and child birth, age at 1st conception, age at first birth, desired no. of children as fertility preferences, gender dynamics in terms of son preference, antenatal care, medicines taken, non-medical care, place and mode of delivery, types of delivery, breast feeding, breast feeding duration, colostrum, knowledge of contraceptives and decision-making, sources of family planning methods [11].
Age at Marriage
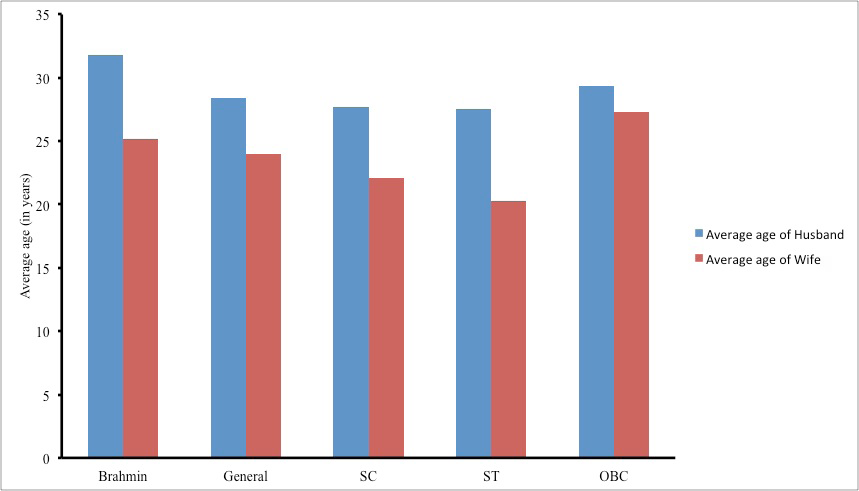
Age at marriage is a very important demographic and health characteristic. It indicates average time of family formation. Age at marriage is important factor for influencing population growth and it helps in determining the reproductive span of women. The present study on Birsingha village has found that the practice of child marriage is somewhat absent in all the caste groups except for scheduled caste and tribe category. Though, the legal provision for the age at marriage in India, for girls is 18 years it was reported in the present study that the average age at marriage among SC women (14.3 years) and ST women (12.9 years) respectively. It was also found that the girls have comparatively earlier age at marriage in comparison to the boy cutting across the castes of the village [12].
| Caste | Mean±SD (in years) | Range (in years) | ||
|---|---|---|---|---|
| Husband | Wife | Husband | Wife | |
| Brahmin | 31.80±2.59 | 25.2 ± 3.42 | 29 – 35 | 21 – 30 |
| General | 28.42±3.29 | 24.00±3.39 | 24 – 35 | 19 – 30 |
| SC | 27.71±3.24 | 22.06±2.60 | 24 – 35 | 18 _ 27 |
| ST | 27.54±3.20 | 20.27±2.28 | 23 – 34 | 16 – 23 |
| OBC | 29.33±1.52 | 27.33±4.16 | 28 – 31 | 24 – 32 |
Table 1: Age Distribution.
The above Table 1 shows that the mean age at marriage for males among the Scheduled Castes and tribes are similar (27.71±3.24; 27.54±3.20); on the other hand, Brahmins shows elevated age at marriage for males (31.80±2.59).
Females on the other hand show a more or less uniform mean age at marriage cutting across the caste groups. The general trend of males getting married later than females are in corroboration with the present study (Figure 1).
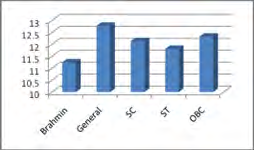
Age at Menarche
Menarche is considered as an important physiological as well as physical episode. It indicates the specific stage of first periodical regular flow of blood from womb in all the healthy normal females. The first menstruation start is taken into account at the age of puberty and maturity and from this stage females are biologically capable to conceive. Various researchers have reported that the average age at menarche of Indian girls varies from 12 to 14 years [13]. Onset of menarche is determined by on so many factors, such as: genetic influences, socioeconomic conditions, general health and well-being, nutritional status, certain types of exercise, seasonality, and family size possibly play a role. Commencing of first menstrual cycle does not only beget physiological changes in the body, but various socio-economic factors of the family also get influenced by it.
| Mean±SD (years) | Range (in years) | |
|---|---|---|
| Brahmin | 11.25±0.95 | 10 - 12 |
| General | 12.78±1.42 | 10 - 16 |
| SC | 12.14±1.52 | 10 - 16 |
| ST | 11.81±1.32 | 9 - 14 |
| OBC | 12.33±0.577 | 12 - 13 |
Table 2: Mean Age at Menarche.
The above Table 2 represents the mean age at menarche of the studied population. Mean age was similar amongst all the communities and follows the general secular trend. Although, the Brahmin girls tend to have a comparatively lower age of onset (11.25±0.95). Whereas, the average age of menarche in OBC population is somewhat elevated (12.33±0.577). Girls belong to SC and ST castes groups seemed to have a similar mean age at menarche (12.14±1.52; 11.81±1.32) (Figure 2).
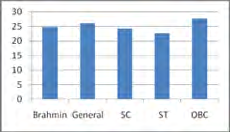
Age at First Conception
Studies show that there is a strong association between young maternal age and increased risk for maternal anaemia. Also, the biological context of pregnancy changes with increasing maternal age and can also affect the psychological adjustment during pregnancy. Thus, age at first conception is an imperative factor to study reproductive health. In this study we tried to find out the range of age of women when they first conceived and the percentage of pregnant underdeveloped adolescents [14].
The Table 3 shows that the mean age at first conception of the populations is similar among all the populations. However, the age range varies significantly from lowest of age 20 (recorded in ST population) to 32 (in OBC population). However, the ST population has a lower mean of age at first conception (22.63±1.96) compared to that of OBC population (27.66±3.78). Also, there is a preconceived notion amongst the women that if they do not conceive at an early age, they will fail to conceive their second issue (Figure 3).
| Community | Mean±SD (years) | Range (in years) |
|---|---|---|
| Brahmin | 24.75±2.87 | 21 – 28 |
| General | 26.07±3.36 | 21 – 32 |
| SC | 24.21±1.86 | 21 – 28 |
| ST | 22.63±1.96 | 20 – 25 |
| OBC | 27.66±3.78 | 25 – 32 |
Table 3: Age at Conception.
Age at First Birth
In 2018, according to UNICEF, the global adolescent birth rate was substantially high. Amongst 1000 cases 44 births were for girls aged 15 to 19. Maternal morbidity and mortality rates are highly likely to be at risk if the pregnancy occurs before adolescents are fully developed [15]. Conceiving at an early age is one of the leading global causes of death for women aged 15-19. In 2003 UNFPA found that the girls under 15 are five times more likely to die than the quantity of girls die during pregnancy and childbirth at the age between 15 to 19). Also, babies born to these adolescents are subjected to poor health condition and malnourishment. The younger a woman is when she first gives birth, the longer her total child-bearing period and the more children she is likely to have which increases the risks to the life and health of both mothers and children.
| Mean±SD (years) | Range (in years) | |
|---|---|---|
| Brahmin | 25.25±2.5 | 22 – 28 |
| General | 26.85±3.37 | 22 – 32 |
| SC | 25.09±1.89 | 22 – 29 |
| ST | 23.54±2.11 | 20 – 26 |
| OBC | 28.33±3.21 | 26 – 32 |
Table 4: Age at First Conception.
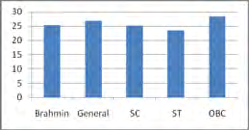
The above Table 4 represents the mean age at first birth of the populations, where we can see the mean ages are similar amongst the caste groups, whereas ST population has the lowest recorded age of first birth, i.e.; 20 and the highest age is found to be 32 in OBC population. Although, the ST population has a lower mean age at first birth (23.54±2.11) and OBC population has the increased mean age at first birth (28.33±3.21) (Figure 4) [16].
Desired No. of Children
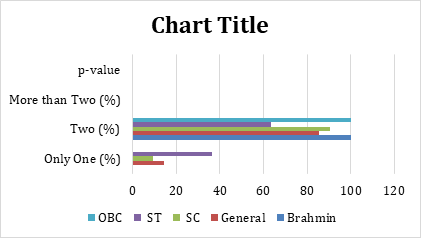
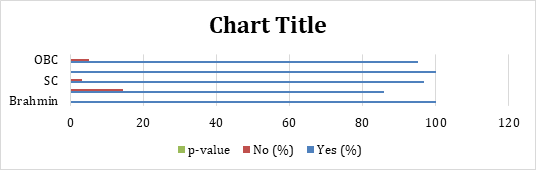
In many regions of India, due to the modernization process women’s health improved as a result of the levels of income, industrialization and urbanizations, before even they adopt contraception. These women tend to have an increased number of childbirths. Therefore, information on the number of children desired and trends in that number is required to know if they are conscious of any family planning and if there exists any population policy concerns. This information is helpful in knowing if the population demands for any services. The important factor in modern reproductive preferences uses is the desired or ideal number of children-particularly the proportion of women that report wanting no more children. In this study we wanted to see if the women of the populations have a particular trend in desired number of children [17].
| Only One (%) | Two (%) | More than Two (%) | p-value | |
|---|---|---|---|---|
| Brahmin | 0 | 100 | 0 | P<0.227 |
| General | 14.3 | 85.7 | 0 | P<0.227 |
| SC | 9.5 | 90.5 | 0 | P<0.227 |
| ST | 36.4 | 63.6 | 0 | P<0.227 |
| OBC | 0 | 100 | 0 | P<0.227 |
Table 5: Desired Number of Children.
The above Table 5 shows across all the caste groups, desire for more than two children is not prevalent. However, all the members from Brahmin and OBC caste groups want to have two children, whereas desire for only one child is higher in percentage (36.4%) in ST caste group. On the other hand, 90.5% members from SC caste group long for two children. None of the caste groups want to have more than two children (Figure 5).
Son Preference
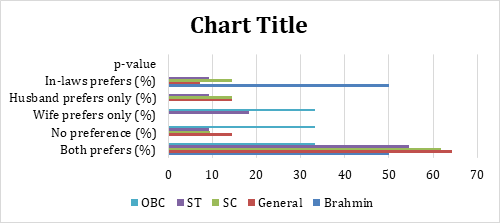
Preference for sons over daughters has led to 7% of total births in India, influencing the fertility behavior of the country. Despite several campaigns and slogans for the strong family planning programs and an increased number of nuclear families, due to a plethora of social, cultural and economic factors, the deep-rooted preference for sons over daughters will prevail and women in India will continue to have more children than they would like. For instance, women with absolutely no son or low proportion of sons tend to continue childbearing. According to the last population census in 2011 there are 943 females per 1000 males in India. Gender discrimination and son preference lead to this consequential skewed sex ratio in India, where over 2 million girls go “missing” across age groups every year because of abortion of female fetuses, disease, neglect, denying medical cares and inadequate nutrition, according to the nationwide reports [18].
| Community | Both prefers (%) | No preference (%) | Wife prefers only (%) | Husband prefers only (%) | In-laws prefers (%) | p-value |
|---|---|---|---|---|---|---|
| Brahmin | 50 | 0 | 0 | 0 | 50 | P<0.327 |
| General | 64.3 | 14.3 | 0 | 14.3 | 7.1 | |
| SC | 61.9 | 9.5 | 0 | 14.3 | 14.3 | |
| ST | 54.5 | 9.1 | 18.2 | 9.1 | 9.1 | |
| OBC | 33.3 | 33.3 | 33.3 | 0 | 0 |
Table 6: Son Preference.
Above Table 6 shows there are 50% of cases in Brahmins where both the spouses prefer male child. Whereas in 50% of cases the in-laws have a preference for male child. In general, a very small percentage (14.3%) of the populations don’t have any preference for sons. On the other hand, in case of 54.5% are cases in ST population where both the spouses long for sons, 18.2% are cases where only the wives prefer son and only 9.1% are of those cases where only the husbands want son and in 9.1% cases the in-laws have a preference for male child. The highest percentage (61.9%) of both the spouses wanting son is found in the SC population, where 0% of cases for wife to have a preference of male child and 14.3% are of those cases where only the husband has a preference and 14.3% cases are where only the in-laws want male child. In OBC category, the percentage of cases where both the spouse prefer son, spouses who do not have any preference and the cases where only the wives want male child are equal (33.3%). There were no cases in OBC population where only the husbands or only the in-laws prefer for male child (Figure 6) [19].
Antenatal Care
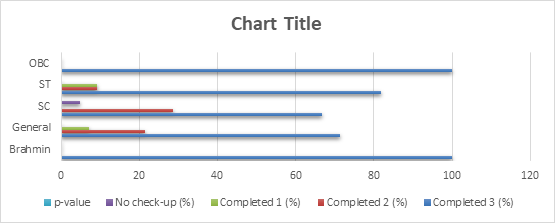
Maternal and child health hugely depend on the care that has been given to the mother from the time of conception through birth as this is the time when the child’s health is entirely depended on its mother’s health. Although India is responsible for one-fifth of global birth, no monitoring systems for basic maternal and child health has been installed uniformly in rural India. On top of it, the access to antenatal care is determined by the geographical locale and socio-economic status of the expectant mothers. Even though the antenatal care inequalities found in India, with the recommended ANC visit during pregnancy by the World Health Organization, government has deployed several programs to increase the access to antenatal care services to uplift the number of ANC visits at least to be three with additional consumption of 90 or more iron-folic (IFA) tablets and receive two tetanus toxoid (TT) injections for long term effects on the height, weight, cognition and productivity of a child. In current study we examined the status of utilizing ANC services in the studied populations (Table 7) [20].
| Completed 3 (%) | Completed 2 (%) | Completed 1 (%) | No check-up (%) | p-value | |
|---|---|---|---|---|---|
| Brahmin | 100 | 0 | 0 | 0 | P<0.811 |
| General | 71.4 | 21.4 | 7.1 | 0 | P<0.811 |
| SC | 66.7 | 28.6 | 0 | 4.8 | P<0.811 |
| ST | 81.8 | 9.1 | 9.1 | 0 | P<0.811 |
| OBC | 100 | 0 | 0 | 0 | P<0.811 |
Table 7: Antenatal Care.
In current study we found that expectant mothers from almost all the caste groups tend to have completed all the three ANC visits as recommended by Indian guidelines. Whereas, 4.8% of all expectant mothers from SC group have failed to attend any ANC visits. Amongst Brahmin and OBC group it is found that all the expectant mothers (100%) have completed all the three ANC visits. Cases of ANC visiting for at least one time and two times in ST expectant mothers are found to be in same percentage, precisely 9.1%. SC women who have completed at least two ANC visits during pregnancy are found to be 28.6 in percentage (Figure 7) [21].
Medicines Taken
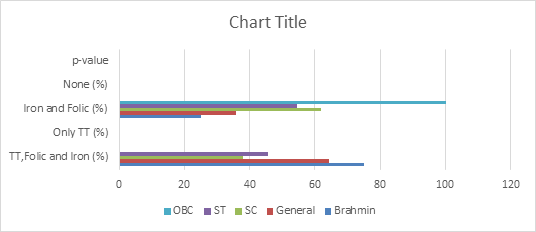
Deficiency of iron and folic acid and other essential micronutrients is the main reason behind anaemia in mothers during pregnancy. Anaemia is the major contributor to the plethora of diseases both in mothers and newborns, globally. Maternal and peri-natal mortality rate and low birth weight are associated with maternal anaemia due to iron and folic acid deficiency during pregnancy is determined by variety of biological and socio-economic reasons [22]. In the mid-1970s maternal TT vaccination during pregnancy was incorporated to prevent child mortality from tetanus into the World Health Organization’s Expanded Program on Immunization (EPI) and has become a standard approach to ANC. This study aimed to investigate the use of iron–folic acid (IFA) supplementation and tetanus toxoid (TT) vaccination during pregnancy in the studied area.
The Table 8 represents the status of consumption of medicine among the pregnant women of the studied population. It is reported that the incident of receiving all the three medications i.e. Iron and folic medicines and receiving TT injections are prevalent in all the caste groups. 75% of Brahmin expectant women, 64.3% expectant women from general caste group, 38.1% of SC expectant women and 45.5% of ST expectant women have received all three medications [23]. Whereas we found no OBC expectant women have ever received all the three medication during their pregnancy, but all of the OBC expectant women have consumed iron and folic medications (Figure 8).
| Community | TT, Folic and Iron (%) | Only TT (%) | Iron and Folic (%) | None (%) | p-value |
|---|---|---|---|---|---|
| Brahmin | 75 | 0 | 25 | 0 | P<0.180 |
| General | 64.3 | 0 | 35.7 | 0 | |
| SC | 38.1 | 0 | 61.9 | 0 | |
| ST | 45.5 | 0 | 54.5 | 0 | |
| OBC | 0 | 0 | 100 | 0 |
Table 8: Medicines Taken.
Place of Delivery
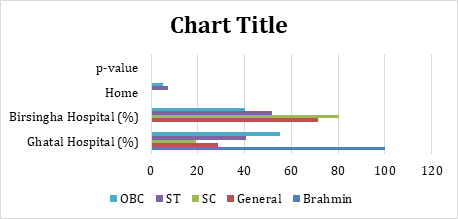
The rates of maternal and child mortality are highest in India. A large number of studies showed that improvement in the coverage of institutional delivery is imperative to decrease the burden of maternal and child death. The first and foremost concern of different national programs related to maternal and child death is to escalate the odds of institutional delivery as the fact that giving birth in a medical institution under the care and supervision of trained healthcare providers promotes child survival and reduces the risk of maternal mortality is empiricised by huge number of data [24]. However, with so many ongoing governmental schemes, promoting institutional delivery, the odds of institutional delivery are very low. Thus, the dynamics of choice of place of delivery is still not understood, whatsoever. In current study, we tried to explore the preferential dynamics of choice of place of delivery in the studied area (Table 9).
| Ghatal Hospital (%) | Birsingha Hospital (%) | Home (%) | p-value | |
|---|---|---|---|---|
| Brahmin | 100 | 0 | 0 | P<0.005 |
| General | 28.6 | 71.4 | 0 | P<0.005 |
| SC | 19.4 | 80.6 | 0 | P<0.005 |
| ST | 40.7 | 51.9 | 7.4 | P<0.005 |
| OBC | 55 | 40 | 5 | P<0.005 |
Table 9: Place of Delivery.
Findings reveal that all the women from Brahmin population opted for institutional delivery in Ghatal hospital. Whereas percentage of preference for delivery in home (7.4%) is found to be highest among ST women. Institutional delivery at Birsingha hospital is found to be higher in percentage (80.6%) among SC women. On the other hand, the percentage of institutional deliver in Birsingha hospital (51.9%) is higher than the percentage of the ST women opted for institutional delivery in Ghatal hospital (40.7%). The scenario is opposite in case of OBC women, where 55% women preferred institutional delivery at Ghatal hospital, 40% women opted for institutional delivery at Birsingha
hospital and only 5% women preferred home as a place for delivery [25]. Therefore, it is clear from the data that although the institutional delivery is predominant but preference for home as a place for delivery does also exist in the studied population (Figure 9).
Type of Delivery
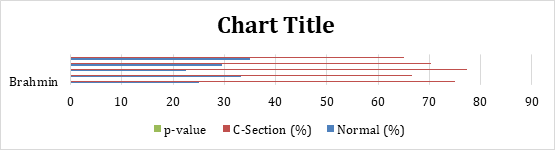
There are so many methods for child delivery. Amongst them spontaneous vaginal delivery (SDV) is the most common. However, in practice the need for caesarean delivery is determined after the labour starts. The World Health Organization has recommended that the caesarean delivery should be under 10-15%, ideally. But in third world countries like India urban women, often if not less opt for the caesarean delivery method to save time and the pain of vaginal delivery [26]. On the other hand, in rural India it is seen that women usually, perforce, prefer to go in labour and have a vaginal delivery, driven by the preconceived notion that a woman con not become a mother until and unless she gives birth to a child by vaginal delivery method, tolerating the excruciating pain of labour probably due to resource constrains, cultural values, fear of suffering and wrong perceptions of womanhood. The number of caesarean deliveries in India is as high as 17.2%, increased from 8.5% in 2005–06. Although, the rate is comparatively low (12.9%) in rural areas. The fact that the frequencies of caesarean deliveries in rural and urban areas differ must have underlying socio-economic, cultural, and psychological influences attached to it when it comes to in the decision- making process, for example, influence of family members, her own expectations, her previous birth experience, her knowledge of potential complications. The difference in frequencies may also have been the reason behind the varying rates of maternal and obstetric morbidity in rural and urban India. Therefore, we tried to estimate the frequency of normal vaginal and caesarean cases of childbirth in the studied area [27].
| Community | Normal (%) | C-Section (%) | p-value |
|---|---|---|---|
| Brahmin | 25 | 75 | P<0.8 |
| General | 33.3 | 66.7 | |
| SC | 22.6 | 77.4 | |
| ST | 29.6 | 70.4 | |
| OBC | 35 | 65 |
Table 10: Type of Delivery.
The above Table 10 depicts the status of the child delivery by spontaneous vaginal delivery method and caesarean delivery method amongst the population of four caste groups in the studied area. It is crystal that most of the populations prefer C-section delivery over normal vaginal delivery method. However, the highest percentage of normal delivery cases which is 35%, can be found in OBC caste group. On the other hand, the lowest cases (22.6%) of normal vaginal delivery are found to be in SC caste group. The highest number (77.4%) of C-section delivery is recorded in SC caste group (Figure 10) [28].
Breast Feeding
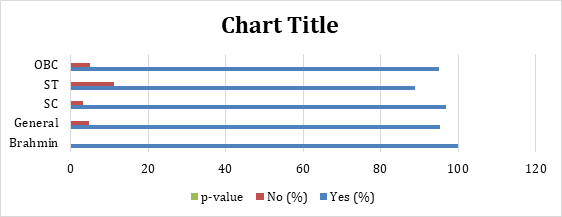
The odds of survival of neonates, health of a child, birth spacing and the protection from any childhood infectious diseases, such as allergies and asthma, depend majorly on breastfeeding habits. Initiation of breastfeeding, duration and the age at which the breastfed child is weaned are the factors that influence the benefit of breastfeeding. Although, the phenomenon of breastfeeding is universal in India, the practices vary among different regions and communities. Breastfeeding is unparallel when it comes to providing ideal food for the healthy growth and developments of infants. In a way, the health of the mother gets implicated by the process of breastfeeding as it is a crucial part of reproductive process. In this study we tried to understand the habit of breastfeeding among the studied populations [29].
The Table 11 represents that the practice of breastfeeding is prevalent in Brahmins (100%). The percentage of denying breastmilk to newborns is highest in ST population (11.1%). Whereas the trend of breastfeeding is similar in SC (96.8%) and OBC (95%) populations. It is therefore vivid from the data that breastfeeding practice is prevalent in the studied populations and the practice of not providing breastmilk to their newborns also exist in some caste groups (Figure 11) [30].
| Yes (%) | No (%) | p-value | |
|---|---|---|---|
| Brahmin | 100 | 0 | P<0.7 |
| General | 95.2 | 4.8 | P<0.7 |
| SC | 96.8 | 3.2 | P<0.7 |
| ST | 88.9 | 11.1 | P<0.7 |
| OBC | 95 | 5 | P<0.7 |
Table 11: Breast Feeding.
Breast Feeding Duration
According to WHO and UNICEF, 270days in the uterus and the first 2years after birth, these 1000days are the critical time window when the stages of growth and development of the child are in optimal threshold. In order to achieve the physical, mental, and cognitive growth and development of the child breastfeeding is crucial. In low and middle income countries, only 37% of children are breastfed for initial 6months of their lives [31]. According to the National Family and Health Survey-4, the percentage of mothers who practice breastfeeding for recommended 6months, is seen that 56%.
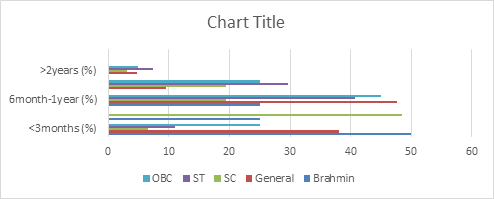
India ranks first in the world when it comes to preterm births, malnutrition under the age of five and neonatal mortality. Thus, it is important to know the duration of breastfeeding in the studies populations (Table 12).
| Community | <3months (%) | 3-6months (%) | 6month-1year (%) | 1-2years (%) | >2years (%) | p-value |
|---|---|---|---|---|---|---|
| Brahmin | 50 | 25 | 25 | 0 | 0 | P<0.015 |
| General | 38.1 | 0 | 47.6 | 9.5 | 4.8 | |
| SC | 6.5 | 48.4 | 19.4 | 19.4 | 3.2 | |
| ST | 11.1 | 0 | 40.7 | 29.6 | 7.4 | |
| OBC | 25 | 0 | 45 | 25 | 5 |
Table 12: Breast Feeding Duration.
From the current study we found that the practice of breastfeeding is prevalent in the area and the women from all the caste groups have a tendency towards providing breast milk to their children until at least three months of age. With children aging between three to six months the rate of breastfeeding gets somewhat reduced. 25% in Brahmin mothers and 48.4% of SC mothers provide breast milk to their children until three to six months of age. Breastfeeding practice is missing in Brahmin mothers once the child reaches two years of age. Whereas, 7.4% of ST mothers, 5% of OBC mothers and 3.2% of SC mothers breastfeed their children even after the children reach the age of two. Only 25% of Brahmin mothers, 19.4% of SC mothers, 40.7% of ST mothers and 45% of OBC mothers followed the WHO recommended breastfeeding duration of six months to one year after the birth of the child. On the other hand, 19.4% of SC mothers, 29.6% of ST mothers and 25% of mothers continue to breastfeed their children even after they reach the age of one to two years old (Figure 12) [32].
Colostrum
The sticky, yellowish substance produced by mother’s body just immediate after the birth of the baby is ideal for the newborn both in composition and in quantity, and is rich in antibodies and is known as colostrum or the “very first food”, which is universally recommended as the perfect food for every newborn by WHO. Despite the fact that colostrum nourishes as well as provides protection to the newborn, statistics from around the world shows that colostrum is frequently discarded due to lack of awareness of its qualities and its key role in contributing to the health and growth of the newborn. Although, in India breastfeeding is somewhat universal, by taking data from latest 2015-16 NFHS survey, a report prepared by “Child Rights and You “showed that out of every five children in India three are denied colostrum [33]. However, the rate of denying colostrum to newborns varies in different communities across the country. Taking that fact into consideration, the present study has been attempted to evaluate the colostrum avoidance and breast- feeding practices among the mothers of all caste groups in the studied area.
| Yes (%) | No (%) | p-value | |
|---|---|---|---|
| Brahmin | 100 | 0 | P<0.214 |
| General | 85.7 | 14.3 | P<0.214 |
| SC | 96.8 | 3.2 | P<0.214 |
| ST | 100 | 0 | P<0.214 |
| OBC | 95 | 5 | P<0.214 |
Table 13: Colostrum.
It can be seen from the above Table 13 that it is customary among the mothers of Brahmin and ST populations to provide their newborns with colostrum. On the other hand, the highest rate (5%) of denying colostrum is found in OBC population. However, 95% of the population feeds colostrum to their newborns. The percentage of denying colostrum to newborns is comparatively less (3.2%) in SC population and 96.8% mothers gave colostrum to their newborns (Figure 13).
Knowledge of Contraceptives
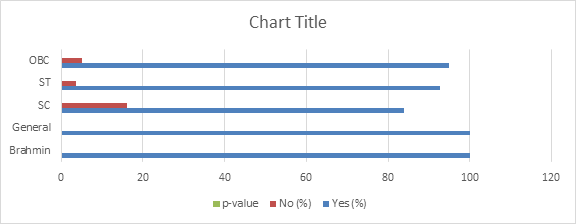
The fertility rate of a nation is hugely determined by the use of contraception amongst the people of the population. Myriad of modern as well as traditional ways of contraception is available in the market of India in today’s date. However, the choice of the contraceptive method is influenced by a host of interdependent demographic, cultural, economic, and social factors. There are studies that show that though awareness of contraception is very high, but utilization is very low in India [34, 35]. A little knowledge or incorrect family planning methods information is in widespread among most of the women of reproductive age. A good family planning program can not only be deployed to improve economic condition of a nation, but it also can improve women and child health in family level. Thus, it behooved us to address this key problem by obtaining the percentage of the awareness of the women regarding contraception.
| Community | Yes (%) | No (%) | p-value |
|---|---|---|---|
| Brahmin | 100 | 0 | P<0.311 |
| General | 100 | 0 | |
| SC | 83.9 | 16.1 | |
| ST | 92.6 | 3.7 | |
| OBC | 95 | 5 |
Table 14: Knowledge and Contraceptives.
The above Table 14 represents that most of the populations have somewhat knowledge of contraception. The awareness is found to be highest in the Brahmin population;
i.e. 100%. Whereas the highest percentage (16.1%) of people not aware of any contraceptives are found to be in SC population (Figure 14) [36].
Sources of Family Planning Methods
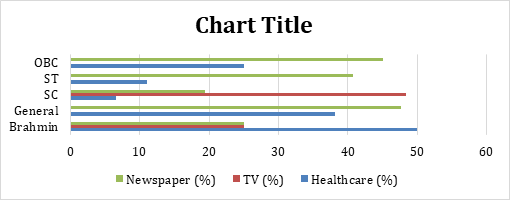
Family planning (FP) as public health interventions impacts the health and wellbeing of women and children by providing universal access to sexual and reproductive healthcare services and Counselling information with huge potential. According to WHO, family planning is a way of thinking and living by voluntarily adopting the basis of knowledge, attitudes and responsible decisions in order to promote the health and welfare of the family and thus contribute effectively to the social development of a country. Studies have shown that FP can be the most cost- efficient solutions to obtain gender equality and equity by empowering women with knowledge and agency to control their bodies and reproductive choices by accessing contraceptive methods. In India, practice of contraception is found to be much skewed towards terminal methods as it is used mainly to limit birth than planning for births [37, 38]. Understanding the source of the knowledge of contraception is thus important to upgrade women’s overall access to modern contraception.
| Community | Healthcare (%) | TV (%) | Newspaper (%) |
|---|---|---|---|
| Brahmin | 50 | 25 | 25 |
| General | 38.1 | 0 | 47.6 |
| SC | 6.5 | 48.4 | 19.4 |
| ST | 11.1 | 0 | 40.7 |
| OBC | 25 | 0 | 45 |
Table 15: Sources of Family Planning Methods.
From above Table 15 it can be seen that the different sources that serve awareness of family planning methods across the caste groups are healthcare services, television media and newspapers. Most of the Brahmins (50%) have been recorded to obtain their primary awareness through healthcare services and equal number people (25%) from Brahmin caste group get their knowledge of family planning via TV and newspapers [39]. On the contrary, newspaper serves as the primary source as the awareness about family planning methods for 47.6% of the general caste group population, 19.4% of SC and 40.7% of ST and 45% of OBC caste group people. General, ST and SC caste group people do not use TV as an alternative source for the family planning awareness. Only 38.1% of General, 6.5% SC, 11.1% ST and 25% OBC category people obtain their knowledge through healthcare services (Figure 15).
Conclusion
In order to enhance reproductive health status of the people in India there are umpteen number of reproductive health related issues need to be addressed. These concerns cut across many socio-economic aspects, such as socio- economic status of the populations can be a determinant for the desired number of children and gender preference of the child. As far as the reproductive health of the studied population is concerned overall awareness and access to several healthcare services are prevalent in the studied population. Although there is a huge scope of improving the status of reproductive health of the studied population by emphasizing on access to quality reproductive health services by gender sensitive providers and by prioritizing women’s’ access to skilled birth attendants at the time of giving birth and that women who develop life-threatening complications during pregnancy, childbirth or postpartum can immediately access treatment at adequately-equipped facilities. The proportion of unwanted and closely spaced births can be hugely avoided by providing access to quality contraceptive services and awareness of the importance of different types of Family Planning methods at their disposal. Ensuring timely transportation to proper facilities and enabling prompt treatment on arrival at facilities and aiming at eliminating delays in decision- making to seek services are required simultaneously [40, 41]. Certainly, it is not feasible for the health sector alone to resolve all these concerns. Our findings should be viewed within the context of the study’s limitations. Memory and report bias may be the case due to self-reporting by the respondents. Also, like other surveys and census under-reporting and over- reporting of certain incidental data such as child marriage and age at 1st conception and birth and certain bias from informant’s side regarding sensitive issues like reporting about use of contraceptive methods are possible. However, most of the findings on the reproductive behavior amongst all the caste groups, knowledge, attitudes, traits, and practice and reproductive performances amongst the women are in line with other published research in India.
References
-
Preference for sons over daughters has led to 7% of total births in India, influencing the fertility behavior of the country. Despite several campaigns and slogans for the strong family planning programs and an increased number of nuclear families, due to a plethora of social, cultural and economic factors, the deep-rooted preference for sons over daughters will prevail and women in India will continue to have more children than they would like. For instance, women with absolutely no son or low proportion of sons tend to continue childbearing. According to the last population census in 2011 there are 943 females per 1000 males in India. Gender discrimination and son preference lead to this consequential skewed sex ratio in India, where over 2 million girls go “missing” across age groups every year because of abortion of female fetuses, disease, neglect, denying medical cares and inadequate nutrition, according to the nationwide reports [18]. [INLINE_TABLE:5:0] Table 6: Son Preference. Above Table 6 shows there are 50% of cases in Brahmins where both the spouses prefer male child. Whereas in 50% of cases the in-laws have a preference for male child. In general, a very small percentage (14.3%) of the populations don’t have any preference for sons. On the other hand, in case of 54.5% are cases in ST population where both the spouses long for sons, 18.2% are cases where only the wives prefer son and only 9.1% are of those cases where only the husbands want son and in 9.1% cases the in-laws have a preference for male child. The highest percentage (61.9%) of both the spouses wanting son is found in the SC population, where 0% of cases for wife to have a preference of male child and 14.3% are of those cases where only the husband has a preference and 14.3% cases are where only the in-laws want male child. In OBC category, the percentage of cases where both the spouse prefer son, spouses who do not have any preference and the cases where only the wives want male child are equal (33.3%). There were no cases in OBC population where only the husbands or only the in-laws prefer for male child (Figure 6) [19]. [INLINE_FIGURE:5:0] Figure 6: Son Preference.
- The Muculent Bleb-Mucinous Cystic Neoplasm-Hepatobiliary Region
- Insulin Sensitizers as Anti-Aging Agents: Unveiling Synergies with Albumin, GLP-1RA, Klotho Protein, and Metformin in the Quest to Combat Aging
- Reprogramming of GLP-1 Response at Prediabetes for the Prevention of Type 2 Diabetes: The Role of Albumin and GLP-1 Receptor Agonists
- The Mingled Allies-Combined Hepatocellular Carcinoma and Cholangiocarcinoma
- Compilation and Embodiment-Leydig Cell Tumour Testis
- Glucolipotoxicity: A Novel Different Perspective on the Causes of Cancer