Prevalence of Obesity is Rising Among Primary School Children in Dhaka City of Bangladesh
Background: The rising prevalence of childhood obesity poses a major public health challenge and needs to be addressed accordingly. Aims and Objectives: To see the frequency of overweight and obesity in primary school children of Dhaka city and to analyze the impact of socioeconomic status and associated hypertension on the anthropometric indices. Materials and Methods: Multistage random cluster sample of 504 children of 9-14 years (age: 11.31±1.39, M±SD; M/F: 256/248) was done. The obesity and overweight were considered using an updated body mass index (BMI) reference, waist circumference (WC), waist height ratio (WHtR) and waist hip ratio (WHR). Socioeconomic status, life style factors as well as blood pressure were considered as influencing factors. Results: About 13.0% (64/504) were underweight, 63.5% (320/504) normal weight, and 12.9% (65/504) overweight and 10.9% (55/504) obese. Most of normal and overweight BMI status was from middle class (51.6% and 55.4% respectively). By WHtR about 55-70% children belonged to normal BMI status while 22.6% was obese. Systolic and diastolic hypertensions were found in 19.9% and 29.8% respectively. BMI correlated with age WHtR, WC, WHR, systolic and diastolic blood pressure as well as socioeconomic condition (p
BK-Rauniyar, Sharmin-Jahan, Nusrat-Sultana, Mashfiqul-Hasan, M
Atiqur-Rahman, Yasmin-Aktar, M Fariduddin and M A Hasanat*
Bangladesh
*Corresponing author: MA Hasanat, Professor of Endocrinology, Department of Bangladesh, Tel: +880 1711 670735; Email: hasanatdr@yahoo.com addressed accordingly.
as well as blood pressure were considered as influencing factors.
independent predictors for BMI.
stakeholders to initiate appropriate measures to combat this rising prevalence.
Keywords: Childhood obesity; Anthropometric Indices; Waist-height Ratio
Introduction
Childhood obesity poses a major public health challenge in both developed and developing countries by increasing the burden of chronic non-communicable diseases. It has reached epidemic proportions and is the most prevalent chronic condition affecting health of children and adolescents worldwide [1]. Though adult body mass index (BMI) thresholds of 25 and 30 kg/m2 is considered for overweight and obesity respectively, there is little consensus as to the best way to operationalize this definition in children [2]. Children with BMI equal to or exceeding the age-gender-specific 95th percentile are defined obese. Those with BMI equal to or exceeding the 85th but below 95 percentiles are defined overweight and are at risk for obesity related co-morbidities [3].
The World Health Organization (WHO) estimated that the prevalence of children <5 years of age with a BMI more than 2 standard deviation (SD; equivalent to the 98th percentile) increased from 4.2% in 1990 to 6.7% in 2010 and is expected to reach 9.1% in 2020 [4]. These worldwide trends in very young children are dramatic and have raised debate as to whether we can and should diagnose obesity even during infancy [2]. According to the BMI cut-off values specific for Asia-pacific region, almost one fourth of the population of Pakistan is overweight and obese [5]. According to recent Indian data, prevalence of overweight among 14 – 17 year old urban children in 2006-2007 was 29% in private schools and 11.3% in government-funded schools [1].
Obesity has been studied extensively in many developed countries, but in Bangladesh studies and data related to obesity in children and adolescents are relatively scarce. A positive association between obesity with higher socio-economic status, lack of physical activity and urban residence has been reported. These findings are in accordance with studies from other developing countries which identified the similar risk factors [6]. The present study was carried out to explore childhood overweight and obesity in primary school children in Dhaka, the capital city of Bangladesh.
Methodology
Study Design
This cross sectional study encompassing 504 primary school children between 9 -14 years of age was carried out during June 2014 to Jan 2016, in 5 schools of Dhaka City Corporation (DCC) selected by multistage random sampling. Five zones of DCC were selected (Lalbagh, Tipu Sultan Road, Shyamoli, Mirpur and Baridhara) and from each zone one ward was selected. Thereafter, from each ward one school was selected randomly. All students of class IV and class V of selected schools were recruited. The study team visited each school in a prefixed day when height, weight, waist circumference (WC), hip circumference along with blood pressure was measured and sociodemographic parameters were recorded in a semi-structured questionnaire. Age and sex specific normograms were used to categorize the BMI.
Statistical Analysis
Data from the study were analyzed using computer based SPSS Program (version 22.0). Results were presented as means (±SD) and frequencies and where necessary by using reference cut-off values. All categorical data were expressed as frequency or percentages unless mentioned otherwise. For non- parametric variables, Chi- square test was preferred. Pearson’s or Spearman’s correlations were used to see correlation among related variables.
Ethical Aspects
Study was done after prior approval by Institutional Review Board (IRB). All parents/legal guardians of the students included in this study were informed about the nature of the study and agreed to participate voluntarily in this study. Informed written assent from parents/legal guardians was obtained through the school authority.
Results
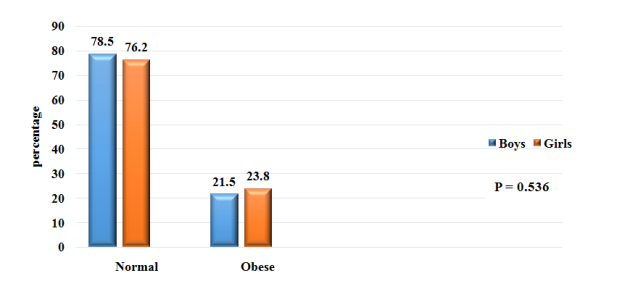
Mean age of the children was 11.3±1.39 (year, M±SD), 256 (50.8%) were boys and 248 (49.2%) were girls. Following categorization on socioeconomic strata, 161 (31.9%) were from low socioeconomic status, 262 (52.0%) were from middle and 81 (16.1%) were from high socioeconomic status (Table 1). Among the children, 12.9% (65/504) were overweight and 10.9% (55/504) were obese (Figure 1). It was observed that, 11.7% and 12.5% of the boys were overweight and obese respectively, frequencies of which were 14.1% and 9.3% in the girls (p<0.001; Figure 2). Abdominal obesity measured as waist circumference in both the boys and girls is shown in Figure 3. (Boys: 73.0% vs. 11.3% vs. 15.6%; Girls: 73.8% vs. 17.3% vs. 8.9%; normal vs. overweight vs. obese; p=0.02). Waist-height ratio (WHtR) was high in 22.6% children (21.5% boys vs. 23.8% girls; p=0.536; Figure 4). About 94% of the children had normal waist hip ratio (WHR) and only 6.2% were obese in this regard (9.4% boys vs. 2.8% girls; p=0.002; Figure 5).
Frequency of obesity was higher in children from high socioeconomic class, whereas frequency of underweight children was more in lower socioeconomic class (high vs. middle vs. low socioeconomic status: obese 22.2% vs. 11.8% vs. 3.7%; overweight 17.3% vs. 13.7% vs. 9.3%; normal BMI 55.5% vs. 63.0% vs. 68.3%; underweight 4.9% vs. 11.5% vs. 18.6%; p<0.001; Table 2). Systolic blood pressure (SBP) was observed to be in hypertensive range in 19.6% children while diastolic blood pressure (DBP) in 29.8%. In obese and overweight children, there was significantly higher frequency of both systolic and diastolic hypertension (Table 3).
BMI positively correlated with age (r=0.241), WHtR (r=0.800), WC (r=0.859), WHR (r=0.233), SBP (r=0.388), DBP (r=0.282) and socioeconomic condition (r=0.286) with level of significance of p<0.001 for all (Table 4).
Sex Boys 256 50.8 Girls 248 49.2
Class IV 207 41.1 V 297 58.9 Socioeconomic Status Low socioeconomic 161 31.9 Middle socioeconomic 262 52 High socioeconomic 81 16.1 Socio-economic status was classified according to the gross monthly income of the family High: > 40000 taka Middle: 15000-39000 taka Low: < 15000 taka
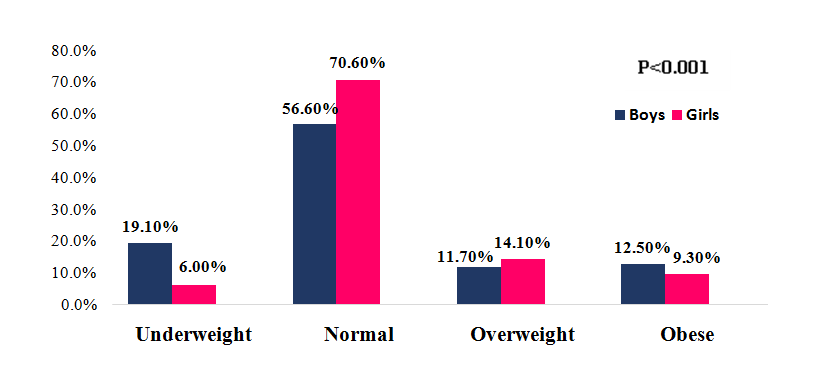
Figure 1: Body mass index (BMI) categories of children (n=504). BMI calculated under reference cut-off value by Center for Disease Control (CDC) Under weight : BMI <5th percentile Normal : BMI ≥5th to < 85th percentile Overweight : BMI ≥85th to < 95th percentile Obese : BMI ≥ 95th percentile Variables Frequency Percentage Age (years; mean ± SD) 11.31±1.39
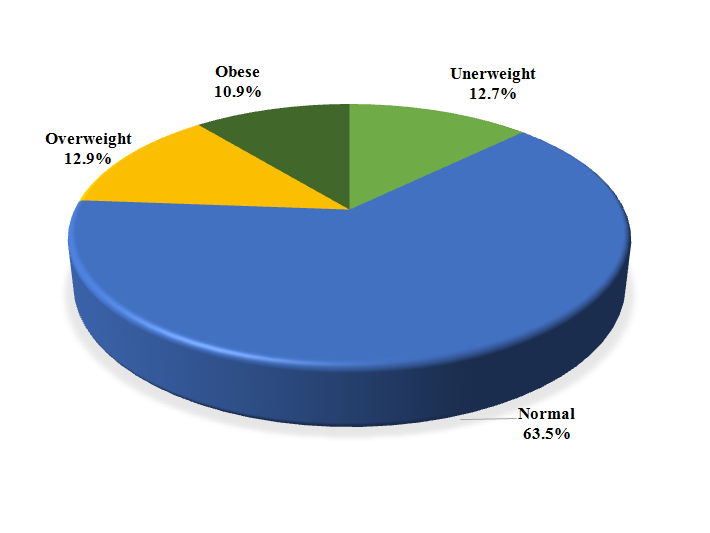
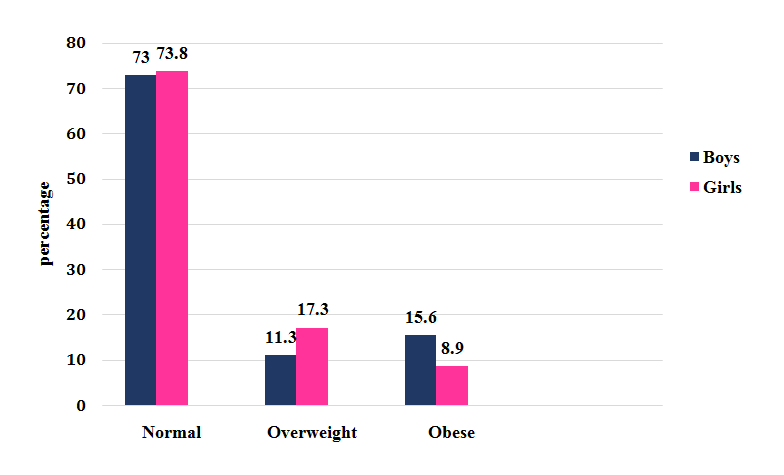
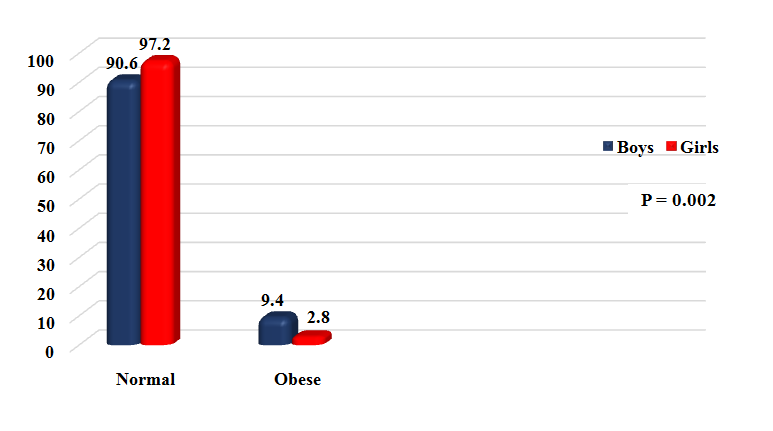
Figure 4: Waist height ratio status of the boys and girls. Waist height ratio: calculated by dividing the waist circumference in cm by height in cm Normal <0.50 Obese ≥0.50 BP status Underweight Normal Overweight Obese total χ2, P Systolic BP Normal 55 (85.9) 226 (70.6) 33 (50.8) 21 (38.2) 335 (66.5) Prehypertension 3 (4.7) 46 (14.4) 16 (24.6) 5 (9.1) 70 (13.4) Hypertension 6 (9.4) 48 (15.0) 10 (24.6) 29 (52.7) 99 (19.6) Total 64 320 65 55 Diastolic BP 36.731 <0.001 Normal 50 (78.1) 196 (61.3) 32 (49.2) 16 (29.1) 294 (58.3) Prehypertension 3 (4.7) 41 (12.8) 6 (9.2) 10 (18.2) 60 (11.9) Hypertension 11 (17.2) 83 (25.9) 27 (41.5) 29 (52.7) 150 (29.8) Total 64 320 65 55 (Within parenthesis are percentages over column total) BP : Blood pressure Normal BP : SBP and DBP < 90th percentile Prehypertension : SBP or DBP ≥ 90th percentile to <95th percentile Hypertension : SBP or DBP ≥95th percentile
| BMI Status | High | Middle | Low | Total | ||||||||||
|---|---|---|---|---|---|---|---|---|---|---|---|---|---|---|
| Underweight | 4 (4.9) | 30 (11.5) | 30 (18.6) | 64 | ||||||||||
| Normal | 45 (55.5) | 165 (63.0) | 110 (68.3) | 320 | ||||||||||
| Overweight | 14 (17.3) | 36 (13.7) | 15 (9.3) | 65 | ||||||||||
| Obese | 18 (22.2) | 31 (11.8) | 6 (3.7) | 55 | ||||||||||
| Total | 81 | 262 | 161 |
Table 1: Correlations between different variables with BMI.
| Variables | r | p | ||||||
|---|---|---|---|---|---|---|---|---|
| BMI vs. age | 0.241 | <0.001 | ||||||
| BMI vs. WHtR | 0.800 | <0.001 | ||||||
| BMI vs. WC | 0.859 | <0.001 | ||||||
| BMI vs. WHR | 0.233 | <0.001 | ||||||
| BMI vs. SBP | 0.388 | <0.001 | ||||||
| BMI vs. DBP | 0.282 | <0.001 | ||||||
| BMI vs. socio-economic condition | 0.286 | <0.001 |
Table 2: Correlations between different variables with BMI.
Discussion
Childhood overweight and obesity has become a serious public health problem because of its strong association with adulthood obesity and the related adverse health consequences. Most likely it results from an interaction of nutritional, psychological, familial and physiological factors. The present study was undertaken to explore childhood overweight and obesity in primary school children in Dhaka city of Bangladesh.
The prevalence of overweight and obese children has been found to be 12.9% and 10.9% respectively by using CDC growth chart of BMI. International literature has portrayed developing countries as having a relatively low prevalence of obesity coexisting with a high prevalence of underweight. Similar observations were reflected by several other studies undertaken in ours and neighboring countries as well [5, 7]. A study conducted by Sultana et al, in 2010 in Dhaka city reported a frequency of overweight and obesity 13.2% and 17.8% respectively among 6 -13 years school going children, while another study by Ferdousi, et al. in 2011 showed frequency of overweight 18.32% among 6-10 years children in urban community of Bangladesh [8, 9].
BMI status was categorized in the context of different socioeconomic groups. As expected the frequency of obese and overweight were higher in high and middle socioeconomic class while the frequency of underweight was more in low and middle socioeconomic class, it was in keeping with other observations as well [10, 11]. This finding is contrary to that in developed countries such as the UK where an association between social deprivation and childhood obesity was strong, especially in the girls. One possible explanation for this difference might be the influence of lifestyle factors such as diet, food consumption patterns, and public services such as health care and transportation and physical activity. Richer people have better access to meat and other energy-dense foods than the poor. On the other hand, middle socioeconomic groups usually consume more vegetables and fruits, which are less energy dense.
While conducting the study we compared the relationship between SBP and DBP with the BMI of studied subjects. The frequency of both systolic and diastolic hypertensions was highest in the obese group whereas the groups with normal or underweight BMI mostly were normotensive. The frequency of systolic prehypertension was highest in the overweight group on the contrary frequency of diastolic prehypertension was found to be higher in the obese group. The observed difference in the BP values between obese and non-obese group may be due to the differences in the BMI values, since high BMI correlates strongly with blood pressures levels of the child [11].
We analyzed the nutritional status of the studied subjects with other well recognized anthropometric markers like WC, WHR and WHtR. 15.6% of the boys and 8.9% of the girls were found to be centrally obese according to waist circumference. WC remains the simplest clinical measure of childhood central obesity. It has been proved a strong predictor of cardiovascular and metabolic disease risk in children [12]. It provides a better estimate of visceral adipose tissue than body mass index (BMI) and is significantly more efficient than BMI in predicting insulin resistance, blood pressure, and serum cholesterol and triglyceride levels [13].
The, WHtR in principle, is a good measure to represent WC in relation to another easily measurable body proportion so that distortions based on the body frame size in different populations are removed. It is being used increasingly to assess the risk of diseases related to central adiposity in adults and WHtR greater than 0.5 has been suggested as a value for indicating whether the upper body fat accumulation is excessive and poses a risk to health in adults [14, 15]. Studies in children using WHtR have also shown that the ratio is superior in its ability to predict cardiovascular disease compared with BMI or percentage body fat [16]. Around 23% of the studied subjects were found to be obese with an almost equal frequency in both gender, these frequency rate was almost similar to the frequency of overweight and obese together on BMI category.
While applying WHR in categorization of nutritional status, 9.4% of the boys and 2.8% of the girls were found to be obese, the rest being normal. WHR has been used to describe body fat distribution in adults; however, it is influenced by several other body factors and is a poor measure of body fat distribution and risk of related diseases in children [17]. When children were classified into different categories in the context of BMI and WC they correlated well with each other but poorly with that as categorized by WHR making it a less suitable tool for diagnosis of obesity in children.
In conclusion, we noticed a fairly high prevalence of obesity among school going children aged 9–14 years in Dhaka. Prevalence of obesity is on rise in Bangladeshi children, highlighting the possible role of change in the dietary pattern and physical activities with increase in income levels. Collective effort of parents and schools and stakeholders are required to institute early preventive measures to reduce March towards obesity and its future cardiometabolic complications.
References
-
Raychaudhuri M, Sanya D (2012) Childhood Obesity: Determinants, evaluation, and prevention. Indian J Endocr Metab 16(S2): S192-S194.
-
Rajalakshmi L, Elks CE, Ong KK (2012) Childhood Obesity. Circulation 126(14): 1770-1779.
-
Raj M (2012) Obesity and Cardiovascular risk in children and adolescents. Indian J Endocr Metab 16(1): 13-19.
-
Mohsin F, Begum T, Azad K, Nahar N (2012) An overview of Childhood obesity. Birdem Med J 2(2): 93-98.
-
Anwar A, Anwar F, Joiya HB, Ijaz A, Rashid H, et al. (2010) Prevalence of Obesity among the School-going Children of Lahore and associated factors. J Ayub med coll Abbottabad 22(4): 27-32.
-
Rahman S, Islam T, Alam DS (2014) Obesity and overweight in Bangladeshi children and adolescents: a scoping review. BMC Public Health 14: 70.
-
Parekh Alok, Parek (2012) Prevalence of overweight and obesity in adolescents of urban and rural areas of Surat, Gujrat. National Journal of Medical Research 2(3): 325-329.
-
Sultana S (2010) Prevalence and risk factor of childhood overweight and obesity in primary school children of Dhaka city.
-
Ferousi J, Alamgir AKM (2008) Prevalence and Determinants of Overweight in School Student: A Developing Country Perspective.
-
Ramesh K, Vitthaldas N, Banshi D, Phatak SR, Shah NN, et al. (2010) Prevalence of Overweight and Obesity in Indian Adolescent School Going Children. It’s Relationship with Socioeconomic Status and Associated Lifestyle Factors. JAPI 58: 151-158.
-
Nazeem Siddiqui I, Bose S (2012) Prevalence and trends of obesity in Indian school children of different socioeconomic class. Indian Journal of Basic & Applied Medical Research 2(5): 393-398.
-
Salanave B, Peneau S, Rolland-cachera MF, Hercberg S, Castetbon K (2009) Stabilization of overweight prevalence in French children between 2000 and 2007. ECOG 4(2): 66-72.
-
Janssen I, Craig WM, Boyce WF, Pickett W (2004) Association between overweight and obesity with bullying behavior in school-aged children. Pediatrics 113(5): 1187-1194.
-
Ashwell M (2005) Waist to height ratio and the Ashwell® shape chart could predict the health risks of obesity in adults and children in all ethnic groups. Nutr Food Science 35(5): 359-364.
-
Ashwell MA, Lejeune SRF, McPherson K (1996) Ratio of waist circumference to height may be better indicator of need for weight management. BMJ 312(7027): 377.
-
Haas GM, Liepold E, Schwandt P (2011) Percentile curves for fat patterning in German adolescents. World J Pediatr 7(1): 16-23.
-
Zannolli R, Morgese G (1996) Waist percentiles: a simple test for atherogenic disease? Acta Paediatrica 85(11): 1368-1369.
- Investigation of Polymorphisms in PPAR-Ɣ and TRHR Genes and their Impact on Turkish Diabetic and Obese Individuals
- The Impact of Aircraft Noise Exposure on the Efficacy of Empagliflozin Therapy in an Animal Model of Obesity
- Rooibos Mitigates Metabolic and Inflammatory Dysfunctions in Mice Fed a High-Carbohydrate Diet
- Synergistic Effect of Combined Leaf Extract of Vernonia amygdalina, Ocimum gratissimum, and Zingiber officinale Tuber on Phytochemical Profile, Antioxidant Activity, Serum Insulin, and Biochemical Parameters in Streptozotocin-Induced Diabetic Rats
- Investigation of Cardiovascular Responses to Aerobic Exercise in Obese University Students
- A Look at the Phase Angle Obtained by Electrical Bioimpedance