Changes in Carotid Intimal Medial Thickness (CIMT) with Glycaemic Control in Patients of T2DM
Introduction: A real world long term (10 years) retrospective non-randomized observational study to monitor changes in CIMT of T2DM patients who achieved the target glycaemic goal of HbA1c ≤ 7%, with those who did not achieve it. CIMT is a marker of subclinical atherosclerosis associated with CVD risk factors. Hence any progression or regression of CIMT could be considered as increased or decreased risk of CVD as the case might be. This study was to ascertain if (keeping all other risk factors under control and at par in each group) a good glycaemic control could lead to a lower CIMT – leading to a lowering of CVD risk. Material & Methods: The inclusion criteria was  Non – pregnant Adults (Age >18 years)  T2DM with HbA1c ≥ 8% at recruitment  Those who remained normotensive (B.P. ≤130/80 mm of Hg)  Those who maintained a normal Lipid profile  Those who had eGFR ≥ 60mL /min/1.73m2(CKD-EPI)  CIMT measurements done at recruitment and then once every year  No requirement for hospitalization for any reason throughout the entire 10 year duration  The total number of patients who completed the follow up for the full ten years was 62. CIMT of the CCAs were scanned with 7-10 MHz linear probe transducer under real time B mode imaging. The patients included in the study were divided into (Group A n = 32 and Group B n = 30). Group A were those who could achieve the glycaemic target of HbA1c ≤ 7% by the end of the first year and were able to maintain the target for the major duration of the study. Group B were those who did not achieve the glycaemic target of HbA1c ≤ 7% by the end of the first year of the study and had an average HbA1c of ≥ 7.5% for the major duration of the study Results: The data at the end of ten year follow up showed that patients from Group A had a mean CIMT of 0.79 mm at baseline and at the end of the study it was 0.75 mm Group B had a mean CIMT of 0.81 mm at baseline at baseline and at the end of study period was 1.17 mm. A good glycaemic control can reduce the burden of CVD as an independent entity.
**Introduction**
A real world long term (10 years) retrospective non-randomized observational study to monitor changes in CIMT of T2DM patients who achieved the target glycaemic goal of HbA1c ≤ 7%, with those who did not achieve the target. The targets of B.P. ≤130/80 mm of Hg, a normal Lipid profile and eGFR ≥ 60 mL/min/1.73m², with a comprehensive management for T2DM achieved by standard up-titration of anti-hyperglycaemic, anti-hypertensive medications and statins was common for both the groups of patients.
CIMT is a marker of subclinical atherosclerosis associated with conventional cardiovascular disease (CVD) risk factors. Using CIMT to predict CVD, a number of longitudinal studies examined the relationship between CIMT and future events, most frequently the incidence of cardiac events (myocardial infarction, and angina pectoris) and cerebrovascular events (stroke or transient ischemic attacks). Hence any progression or regression of CIMT could be considered as increased or decreased risk of CVD as the case might be. This study was to ascertain if (keeping all other risk factors under control and at par in each group) a good glycaemic control could lead to a lower CIMT – leading to a lowering of CVD risk.
**Materials and methods**
- The inclusion criteria for the study was
- Non – pregnant Adults (Age >18 years)
- T2DM with HbA1c ≥ 8% at recruitment
- Those who remained normotensive (B.P. ≤130/80 mm of Hg) throughout the study
- Those who maintained a normal Lipid profile (as per ADA criteria) throughout the study
- Those who had eGFR ≥ 60mL/min/1.73m²(CKD-EPI) throughout the study
- CIMT measurements done at recruitment and then once every year
- No requirement for hospitalization for any reason throughout the entire 10 year duration
All the above parameters were monitored at regular intervals-(HbA1c every 3 months, B.P. every 3 months, Lipids, CIMT and eGFR annually) throughout the entire duration of the study which was for 10 years (Feb 2010-Jan 2019).
The number of patients who came back for regular follow-ups for complete 10 years was 62.
Informed consent as mandated was obtained and all the records were maintained in the digital database of the clinic.
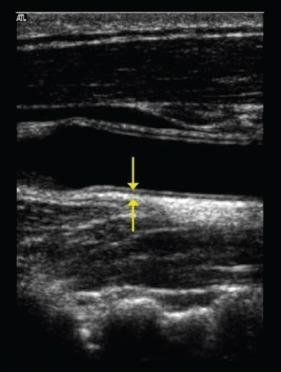
CIMT of the Common Carotid Arteries (CCAs) were scanned using *Sonosite Titan* Ultrasound machine with 7-10 MHz linear probe transducer under real time B-mode imaging. After explanation of the procedure, the subjects were positioned supine with the desired neck extension achieved by pillow support under the neck. The neck was rotated 45° away from the side being examined to give appropriate neck exposure to visualize the common carotid artery and the internal carotid artery. The air interface between the probe and the skin was minimized by the application of acoustic gel. The scan of the common carotid artery began just above the clavicle and the transducer was rotated cephalad through the bifurcation and parallel to the internal carotid artery. The presence of atherosclerotic plaque was scanned for in the near and far walls of the common carotid artery, the carotid bulb and the internal carotid artery to avoid measurement of the thickness at the site of plaque (if present) giving erroneously increased values. The intima-media thickness of the far wall of the carotid vessels was measured as the distance between the leading edge of the lumen-intima interface and the leading edge of the media-adventitia interface. The mean of both sides (left and right) was recorded as the CIMT for that patient [1, 2, 3, 4, 5, 6, 7, 8].
The patients included in the study were divided into two groups-A and B.
(Group A n = 32 and Group B n = 30). Total number n = 62.
Patients in group A were those who could achieve the glycaemic target of HbA1c ≤ 7% by the end of the first year and were able to maintain the target for the major duration of the study.
Patients in group B were those who did not achieve the glycaemic target of HbA1c ≤ 7% by the end of the first year of the study and had an average HbA1c of ≥ 7.5% for the major duration of the study.
In both the above groups the other risk factors for co- morbidity like, hypertension, dyslipidemia and microalbuminuria were kept under strict control as per the recommendations in the guidelines with titration of medications for their management. Hence ruling out any advantage/disadvantage modifying the progression/regre ssion of CVD marker (CIMT).
| Pt. S.No | CIMT in mm | ||||||||||||||
|---|---|---|---|---|---|---|---|---|---|---|---|---|---|---|---|
| Year 2010 | Year 2011 | Year 2012 | Year 2012 | Year 2013 | Year 2014 | Year 2015 | Year 2016 | Year 2017 | Year 2018 | Year 2019 | |||||
| 1 | 0.7 | 0.8 | 0.7 | 0.7 | 0.8 | 0.7 | 0.7 | 0.7 | 0.7 | 0.8 | 0.7 | ||||
| 2 | 0.8 | 0.8 | 0.8 | 0.7 | 0.7 | 0.7 | 0.7 | 0.7 | 0.7 | 0.7 | 0.7 | ||||
| 3 | 0.6 | 0.7 | 0.7 | 0.7 | 0.6 | 0.7 | 0.7 | 0.7 | 0.6 | 0.6 | 0.6 | ||||
| 4 | 0.7 | 0.7 | 0.8 | 0.8 | 0.8 | 0.8 | 0.7 | 0.8 | 0.8 | 0.8 | 0.8 | ||||
| 5 | 0.8 | 0.7 | 0.7 | 0.7 | 0.7 | 0.6 | 0.6 | 0.6 | 0.6 | 0.6 | 0.6 | ||||
| 6 | 0.9 | 0.8 | 0.8 | 0.8 | 0.8 | 0.8 | 0.7 | 0.7 | 0.7 | 0.7 | 0.7 | ||||
| 7 | 0.8 | 0.8 | 0.7 | 0.7 | 0.7 | 0.7 | 0.7 | 0.7 | 0.7 | 0.7 | 0.7 | ||||
| 8 | 0.8 | 0.8 | 0.7 | 0.7 | 0.7 | 0.7 | 0.7 | 0.8 | 0.7 | 0.7 | 0.7 | ||||
| 9 | 0.9 | 0.8 | 0.8 | 0.8 | 0.8 | 0.7 | 0.7 | 0.7 | 0.7 | 0.7 | 0.7 | ||||
| 10 | 0.8 | 0.9 | 0.9 | 0.9 | 0.9 | 0.9 | 0.9 | 0.9 | 0.9 | 1.0 | 1.0 | ||||
| 11 | 0.8 | 0.9 | 0.9 | 0.8 | 0.8 | 0.8 | 0.7 | 0.7 | 0.7 | 0.7 | 0.7 | ||||
| 12 | 0.7 | 0.7 | 0.7 | 0.7 | 0.6 | 0.6 | 0.6 | 0.6 | 0.6 | 0.7 | 0.6 | ||||
| 13 | 0.7 | 0.7 | 0.7 | 0.8 | 0.8 | 0.7 | 0.7 | 0.7 | 0.7 | 0.7 | 0.7 | ||||
| 14 | 0.9 | 0.9 | 0.8 | 0.8 | 0.8 | 0.8 | 0.7 | 0.7 | 0.7 | 0.7 | 0.7 | ||||
| 15 | 0.8 | 0.8 | 0.7 | 0.7 | 0.7 | 0.7 | 0.7 | 0.7 | 0.7 | 0.7 | 0.7 | ||||
| 16 | 0.7 | 0.7 | 0.7 | 0.8 | 0.8 | 0.8 | 0.8 | 0.8 | 0.8 | 0.8 | 0.8 | ||||
| 17 | 0.9 | 0.9 | 0.8 | 0.8 | 0.8 | 0.8 | 0.8 | 0.8 | 0.8 | 0.9 | 0.9 | ||||
| 18 | 0.8 | 0.7 | 0.7 | 0.7 | 0.7 | 0.7 | 0.7 | 0.7 | 0.6 | 0.6 | 0.6 | ||||
| 19 | 0.8 | 0.8 | 0.8 | 0.7 | 0.7 | 0.7 | 0.7 | 0.7 | 0.7 | 0.7 | 0.7 | ||||
| 20 | 0.7 | 0.7 | 0.7 | 0.8 | 0.8 | 0.8 | 0.8 | 0.8 | 0.8 | 0.8 | 0.8 | ||||
| 21 | 0.9 | 0.8 | 0.8 | 0.8 | 0.8 | 0.8 | 0.7 | 0.7 | 0.7 | 0.7 | 0.7 | ||||
| 22 | 0.8 | 0.8 | 0.8 | 0.8 | 0.7 | 0.7 | 0.7 | 0.7 | 0.7 | 0.7 | 0.7 | ||||
| 23 | 0.8 | 0.8 | 0.9 | 0.9 | 0.9 | 0.8 | 0.8 | 0.8 | 0.8 | 0.8 | 0.8 | ||||
| 24 | 0.7 | 0.7 | 0.8 | 0.8 | 0.8 | 0.7 | 0.7 | 0.7 | 0.7 | 0.7 | 0.7 | ||||
| 25 | 0.8 | 0.7 | 0.7 | 0.7 | 0.7 | 0.7 | 0.7 | 0.7 | 0.7 | 0.7 | 0.7 | ||||
| 26 | 0.8 | 0.9 | 0.9 | 0.9 | 0.9 | 0.9 | 0.9 | 0.9 | 0.9 | 0.9 | 1.0 | ||||
| 27 | 0.9 | 0.9 | 0.9 | 1.0 | 1.0 | 1.0 | 0.9 | 0.9 | 0.9 | 0.9 | 1.0 | ||||
| 28 | 0.7 | 0.8 | 0.7 | 0.7 | 0.7 | 0.7 | 0.7 | 0.7 | 0.8 | 0.8 | 0.8 | ||||
| 29 | 1.0 | 1.0 | 1.0 | 1.0 | 1.0 | 1.0 | 1.2 | 1.2 | 1.2 | 1.2 | 1.2 | ||||
| 30 | 0.7 | 0.7 | 0.6 | 0.6 | 0.7 | 0.6 | 0.6 | 0.7 | 0.6 | 0.6 | 0.6 | ||||
| 31 | 0.8 | 0.8 | 0.8 | 0.9 | 0.9 | 0.8 | 0.8 | 0.8 | 0.8 | 0.8 | 0.8 | ||||
| 32 | 0.9 | 0.8 | 0.8 | 0.8 | 0.7 | 0.7 | 0.7 | 0.7 | 0.7 | 0.7 | 0.7 | ||||
| Year 2010 | Year 2011 | Year 2012 | Year 2012 | Year 2013 | Year 2014 | Year 2015 | Year 2016 | Year 2017 | Year 2018 | Year 2019 | |||||
| 1 | 0.8 | 0.8 | 0.8 | 0.8 | 0.8 | 0.9 | 0.9 | 1.0 | 1.0 | 1.2 | 1.2 | ||||
| 2 | 0.8 | 0.8 | 0.9 | 0.9 | 0.9 | 0.9 | 1.0 | 1.0 | 1.0 | 1.1 | 1.1 | ||||
| 3 | 0.9 | 0.9 | 1.0 | 1.0 | 1.0 | 1.0 | 1.1 | 1.1 | 1.2 | 1.2 | 1.2 | ||||
| 4 | 0.7 | 0.7 | 0.8 | 0.8 | 0.8 | 0.8 | 0.9 | 0.9 | 0.9 | 0.9 | 0.9 | ||||
| 5 | 0.8 | 0.8 | 0.8 | 0.9 | 0.9 | 0.9 | 0.9 | 1.0 | 1.0 | 1.0 | 1.0 | ||||
| 6 | 0.9 | 0.9 | 0.8 | 0.8 | 0.8 | 0.9 | 0.8 | 0.8 | 0.9 | 0.9 | 0.9 | ||||
| 7 | 0.8 | 0.8 | 0.9 | 0.9 | 0.8 | 0.8 | 0.7 | 0.7 | 0.8 | 0.8 | 0.8 | ||||
| 8 | 0.7 | 0.7 | 0.6 | 0.7 | 0.7 | 0.8 | 0.8 | 0.9 | 0.9 | 1.0 | 1.0 | ||||
| 9 | 0.9 | 0.8 | 0.8 | 0.8 | 0.9 | 0.9 | 0.9 | 1.0 | 1.0 | 1.1 | 1.2 | ||||
| 10 | 0.8 | 0.8 | 0.7 | 0.7 | 0.8 | 0.9 | 0.9 | 0.9 | 1.0 | 1.0 | 1.2 | ||||
| 11 | 0.9 | 0.9 | 0.9 | 1.0 | 1.0 | 1.1 | 1.2 | 1.1 | 1.2 | 1.2 | 1.3 | ||||
| 12 | 0.8 | 0.8 | 0.9 | 0.9 | 0.9 | 0.9 | 0.9 | 1.0 | 1.0 | 1.0 | 1.1 | ||||
| 13 | 0.7 | 0.7 | 0.8 | 0.8 | 0.8 | 0.9 | 0.9 | 0.9 | 1.0 | 1.0 | 1.0 | ||||
| 14 | 0.7 | 0.7 | 0.7 | 0.8 | 0.8 | 0.9 | 0.9 | 0.9 | 1.0 | 1.0 | 1.0 | ||||
| 15 | 0.8 | 0.8 | 0.7 | 0.8 | 0.8 | 0.9 | 0.9 | 1.0 | 1.0 | 1.1 | 1.1 | ||||
| 16 | 0.9 | 0.9 | 0.9 | 1.0 | 1.0 | 1.1 | 1.2 | 1.2 | 1.2 | 1.3 | 1.3 | ||||
| 17 | 0.9 | 0.8 | 0.9 | 0.9 | 0.9 | 1.0 | 1.0 | 1.1 | 1.2 | 1.2 | 1.3 | ||||
| 18 | 0.8 | 0.8 | 0.9 | 0.9 | 1.0 | 1.0 | 1.2 | 1.2 | 1.2 | 1.2 | 1.2 | ||||
| 19 | 0.8 | 0.8 | 0.8 | 0.9 | 0.9 | 1.0 | 1.0 | 1.0 | 1.2 | 1.2 | 1.2 | ||||
| 20 | 0.9 | 0.9 | 0.8 | 1.0 | 1.0 | 1.0 | 1.1 | 1.2 | 1.2 | 1.3 | 1.3 | ||||
| 21 | 0.9 | 0.9 | 0.8 | 0.9 | 0.9 | 1.0 | 1.0 | 1.1 | 1.1 | 1.2 | 1.2 | ||||
| 22 | 0.7 | 0.7 | 0.8 | 0.9 | 1.0 | 1.0 | 1.1 | 1.2 | 1.3 | 1.3 | 1.4 | ||||
| 23 | 0.8 | 0.7 | 0.8 | 0.9 | 0.9 | 0.9 | 1.0 | 1.0 | 1.1 | 1.2 | 1.2 | ||||
| 24 | 0.8 | 0.8 | 0.9 | 0.9 | 1.0 | 1.0 | 1.2 | 1.2 | 1.3 | 1.3 | 1.3 | ||||
| 25 | 0.9 | 0.8 | 0.9 | 0.9 | 1.0 | 1.0 | 1.1 | 1.1 | 1.2 | 1.2 | 1.3 | ||||
| 26 | 0.6 | 0.7 | 0.6 | 0.7 | 0.8 | 0.8 | 0.9 | 0.9 | 1.0 | 1.0 | 1.0 | ||||
| 27 | 0.7 | 0.7 | 0.8 | 0.8 | 0.9 | 0.9 | 1.0 | 1.0 | 1.1 | 1.1 | 1.2 | ||||
| 28 | 0.8 | 0.8 | 0.9 | 0.9 | 1.0 | 1.0 | 1.0 | 1.1 | 1.2 | 1.2 | 1.3 | ||||
| 29 | 0.8 | 0.9 | 0.9 | 1.0 | 1.0 | 1.1 | 1.2 | 1.2 | 1.3 | 1.3 | 1.4 | ||||
| 30 | 0.9 | 0.8 | 0.9 | 0.9 | 1.0 | 1.0 | 1.1 | 1.2 | 1.2 | 1.3 | 1.4 |
Table 1: Group A.
Sud S. Changes in Carotid Intimal Medial Thickness (CIMT) with Glycaemic Control in Patients of T2DM. Diabetes Obes Int J 2019, 4(2): 000199.
Copyright© Sud S.
Sud S. Changes in Carotid Intimal Medial Thickness (CIMT) with Glycaemic Control in Patients of T2DM. Diabetes Obes Int J 2019, 4(2): 000199.
Copyright© Sud S.
Conclusion
The data from both the groups was analyzed at the end of ten year follow up.
The patients in Group A had a mean CIMT of 0.79 mm at baseline and at the end of the study it was 0.75 mm.
The patients in Group B had a mean CIMT of 0.81 mm at baseline and at the end of the study period was 1.17 mm.
So it can be concluded from the ten year retrospective observational follow up that a good glycaemia control helps to reduce the CIMT in patients of T2DM over and above a good control of other risk factors like lipid and hypertension as an independent entity and hence can help to reduce the burden of CVD / macrovasular disease progression in these patients.
References
-
Einarson T, Hunchuck J, Hemels M (2010) Relationship between blood glucose and carotid intima media thickness: A meta-analysis. Cardiovasc Diabetol 9: 37.
-
ÓLeary DH, Polak JF (2002) Intima-Media Thickness: A Tool for Atherosclerosis Imaging and Event Prediction. Am J Cardiol 90(10C): 18L-21L.
-
Lorenz MW, Markus HS, Bots ML, Rosvall M, Sitzer M (2007) Prediction of Clinical Cardiovascular Events Sud S. Changes in Carotid Intimal Medial Thickness (CIMT) with Glycaemic Control in Patients of T2DM. Diabetes Obes Int J 2019, 4(2): 000199. with Carotid Intima-Media Thickness. A Systematic Review and Meta-Analysis. Circulation 115(4): 459- 467.
-
Polak JF, Pencina MJ, Pencina KM, ÓDonnell CJ, Wolf PA, et al. (2011) Carotid-Wall Intima-Media Thickness and Cardiovascular Events. N Engl J Med 365: 213- 221.
-
Faeh D, William J, Yerly P, Paccaud F, Bovet P (2007) Diabetes and pre-diabetes are associated with cardiovascular risk factors and carotid/femoral intima-media thickness independently of markers of insulin resistance and adiposity. Cardiovasc Diabetol 6: 32.
-
Choi SW, Shin MH, Yun WJ, Kim HY, Lee YH, et al. (2011) Association between hemoglobin A1c, carotid atherosclerosis, arterial stiffness, and peripheral arterial disease in Korean type 2 diabetic patients. J Diab Complications 25(1): 7-13.
-
Fitch KV, Stavrou E, Looby SE, Hemphill L, Jaff MR, et al. (2011) Association of cardiovascular risk factors with two surrogate markers of subclinical atherosclerosis: Endothelial function and carotid intima media thickness. Atherosclerosis 217(2): 437- 440.
-
Bots ML, Mulder PG, Hofman A, van Es GA, Grobbee DE (1994) Reproducibility of carotid vessel wall thickness measurements. The Rotterdam Study. J ClinEpidemiol 47(8): 921-930. Copyright© Sud S.
- Investigation of Polymorphisms in PPAR-Ɣ and TRHR Genes and their Impact on Turkish Diabetic and Obese Individuals
- The Impact of Aircraft Noise Exposure on the Efficacy of Empagliflozin Therapy in an Animal Model of Obesity
- Rooibos Mitigates Metabolic and Inflammatory Dysfunctions in Mice Fed a High-Carbohydrate Diet
- Synergistic Effect of Combined Leaf Extract of Vernonia amygdalina, Ocimum gratissimum, and Zingiber officinale Tuber on Phytochemical Profile, Antioxidant Activity, Serum Insulin, and Biochemical Parameters in Streptozotocin-Induced Diabetic Rats
- Investigation of Cardiovascular Responses to Aerobic Exercise in Obese University Students
- A Look at the Phase Angle Obtained by Electrical Bioimpedance