Quality of Life and Nutritional Parameters of Celiac Patients in Mar Del Plata, Argentina
Background: Celiac disease (CD) is one of the most common causes of chronic malabsorption. The changes that occur in the diet due to the influence of gluten free diet (GFD) lead to a lower content in the intake of fiber and vitamins. Some authors point out that the higher cost of GF foods, the lower availability of those in social events, the impaired patient’s quality of life, could influence the degree of adherence to the GFD. Our aims were to evaluate the nutritional status, identifying the factors that are associated with adherence to the gluten-free diet (DLG) and the quality of life of a group of CD patients in Mar del Plata. Methods: CD patients were recruited from outpatient of clinic and gastroenterology unit of Oscar Alende Hospital, Mar del Plata and Argentina Celiac Association and had blood drawn for micronutrients concentration. Quality of life was evaluated by SF12 questionnaire, factors and adherence to GFD were determined by factors questionnaire and the Celiac Dietary Adherence Test (CDAT). Results: 47% of the participants had high adherence to GFD. The large supply of gluten-free foods without options during social events was significantly associated with the worst adherence to GFD. The average concentrations of folic acid, magnesium, iron and vitamin B12 were within the normal ranges; however, 6.7, 7.0 and 33.3% of the low adherent group showed low serum concentrations of iron, vitamin B12 and folate, respectively, while 7.7 and 53.8% of the high adherent exhibited low serum concentrations of iron and folate, respectively. Approximately 14.2% had anemia, only 7.1% had iron deficiency anemia. 54% of patients reported eating corn-based foods 3 or more times per week. The general perception of health was low in the age range between 18 and 40 years (34.3 ± 22.0) and the energy and vitality values were low in the same group (37.5 ± 25.2). Conclusions: Evaluation of quality of life and micronutrients indicate the need to support the patients in their treatment and to increase the supply of GF foods and the supplementation with vitamins and micronutrients of the GFD.
Introduction
The gluten-free diet (GFD) is the only treatment indicated in celiac disease (CD) [1, 2]. The GFD includes foods that naturally do not contain gluten and those foods that by their preparation are indicated as GF. Some studies report that GFD is associated with some nutritional deficiencies due to the exclusion of cereals that contain gluten and provide vitamins and minerals. The changes that occur due to the influence of a GFD lead to a lower content in the intake of fibers, vitamins and minerals with the consequent decrease in serum concentration of folate, iron, calcium, magnesium, vitamin B12 and ferritin [3]. In our country, some studies reported nutritional deficiencies in celiac children under treatment but studies in adults are scarce [4].
Strict compliance to GFD may be affected by several factors. Some authors point out that the cost, the low availability of GF foods in social events and the low mood could influence the adherence to DLG [5]. Consequently, celiac patients may show different degrees of adherence to treatment. Food is an important part of a person's life, not only because it contributes to the well-being in their health but also because it collaborates in the style and quality of life. Previous studies on the impact of celiac disease and GFD on health-related quality of life (HRQOL) have yielded conflicting results, some research showed a decrease in HRQOL in celiac disease and other results estimated that it was comparable to that of the general population Our aims were to evaluate the nutritional status of celiac people in Mar del Plata by determining the serum concentration of micronutrients, identify the factors that are associated with adherence to the gluten- free diet (DLG) and evaluate the quality of life in that group of patients [6].
Materials and Methods
Type of study: Descriptive, qualitative-quantitative, cross- sectional. Sample: not probabilistic for convenience.
Patients
Participants (age> 18 years) all had histologically confirmed CD, recruited from the Argentina Celiac Association (ACA) and the Gastroenterology Unit of Oscar Alende Hospital, Mar del Plata, Argentina, between October 2016 and September 2017. The diagnosis of celiac disease was made in all patients according to the criteria of the European Society of Pediatric Gastroenterology and Nutrition [7] and the Clinical Practice Guide on the Diagnosis and Treatment of celiac condition in the first level of care [1].
The patients were interviewed by a nutritionist or a qualified person, who used three questionnaires: Factors questionnaire (FQ), Celiac Dietary Adherence Test (CDAT) [8] and SF12 Questionnaire to evaluate Quality of Life [6].
The FQ was previously prepared by the working group and was applied in a former project (unpublished results) and was administered to assess the level of adherence and the aspects that influence the compliance to GFD.
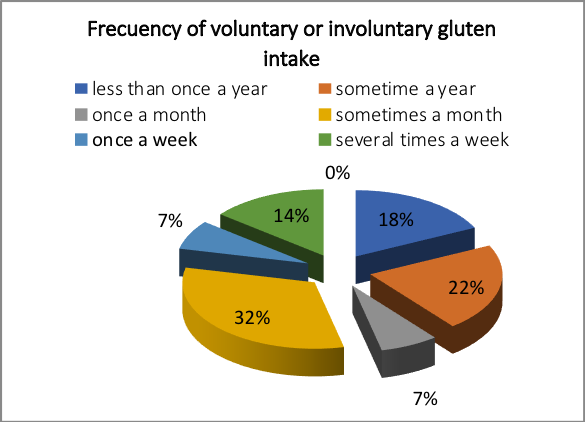
The FQ included some items as symptoms, social and health team support, perception of adherence, general health status and difficulties in the compliance to diet, due to cost or accessibility to gluten-free foods in restaurants or social events. Adherence to GFD was assessed by the question that was included in the FQ: How often do you think you eat gluten (either voluntarily or involuntarily)? Adherence to the GFD was recorded on a scale ranging from high adherence: "Consume gluten less than three times per year or once per year or once a month" to poor adherence "A GFD does not currently follow, consume gluten two or more times per month, once a week or several times per week" (Appendix 1. Factors ‘questionnaire).
The high level of adherence was defined by the CDAT with a score of < 17. Additive CDAT score was calculated from 7 to 35 based on 7 questions each on a 5-point scale, with higher scores denoting worse GFD adherence.
Quality of Life
SF-12 instrument consists of a subset of 12 selected elements of the SF-36 form that included the summary of the physical and mental domains which measure the presence and the severity of symptoms (abdominal pain, discomfort, diarrhea), others and their limitation on daily activities. The response options form Likert-type scales that assess intensity and frequency. The number of response options varies from three to six, depending on the element and each question receives a value that is subsequently transformed into a scale of 0 to 100. The scores have an average of 50 with a standard deviation of 10, so values greater than or less than 50, would indicate a good or worse status of health-related quality of life, respectively than the reference population. The physical component summary (PCS) included physical functioning (PF), physical role (PR), bodily pain (P) and general health (GH), while the mental component summary (MCS) included social functioning (SF), energy / vitality (E / V), emotional role (ER) and mental health (SM).
Biochemical Analysis
Fasting venous blood samples were analyzed in the Central Laboratory of the Oscar Alende Hospital, Mar del Plata. Serum folate and serum vitamin B12 were analyzed by micro particles with enzyme immunoassay technology (MEIA) (AxSYM, Abbott, IL, USA); serum immunoglobulin A and ceruloplasmin were analyzed by an immunoturbidimetric method (ABBOTT 7000). Ferritin concentration was analyzed by chemiluminescent microparticle immunoassay (CMIA) (Architect Systems, Abbott). For the iron, magnesium, calcium and albumin concentration, a colorimetric method was used with a clinical chemistry analyzer (CB 400, Wiener Lab Argentina, manufactured in Italy).
Twenty-eight patients participated; the mean age was 41 +/- 13 years (range 18 -72 years) and 24 (86 %) were female. The average age at diagnosis was 35 years (range 8–72 years) with the median time since diagnosis of 36 months (1–120 months) (Table 1).
Blood samples collected in K3 EDTA were analyzed in CELL-DYN Ruby counter (Abbott). The parameters reported were the concentration of red blood cells (RBC), mean corpuscular volume (MCV), hematocrit (Hct), hemoglobin concentration (Hb), mean corpuscular hemoglobin (MCH), mean corpuscular hemoglobin concentration (MCHC) and white blood cells counts (WC), neutrophils, monocytes, lymphocytes, eosinophils and platelets.
The serum tranglutaminase IgA (tTG IgA) was performed by an enzyme immunoassay (ELISA) with a recombinant human antigen (INOVA Quanta Lite human- tTG IgA, San Diego, USA; 97% sensitivity, 99% specificity).
Statistical Analysis
A Student's t-test was used to assess the significant differences between the low and high adherence groups in serum micronutrient and macronutrients concentrations: calcium, albumin, iron, magnesium, vitamin B12 and folate, ceruloplasmin and ferritin.
For the analysis of the SF12 questionnaire, the results were analyzed with the Microsoft Excel program (97- 2004), calculating measures of central tendency, dispersion. Internal consistency was analyzed using Cronbach's alpha coefficient, considering an alpha coefficient of 0.7 or more, as recommended in previous studies, acceptable for this study.
Differences between age groups and between sexes were calculated with the Student t-test with the IBM SPSS 22 software.
Ethical Aspects
The protocol was approved by the Bioethics Committee of the Oscar Alende Hospital. Patients received complete information about the study and signed informed consent forms.
Results
| Total | High adherence | Low Adherence | |||||||
|---|---|---|---|---|---|---|---|---|---|
| Number of patients | 28 | 13 (47 %) | 15 (53%) | ||||||
| Age (years) | 41 | 45 | 33 | ||||||
| range | 18-72 | 23-72 | 18-54 | ||||||
| Gender | |||||||||
| Male | 4 | 2 | 2 | ||||||
| Female | 24 | 11 | 13 | ||||||
| Level of education * | |||||||||
| Low | 7 | 4 | 3 | ||||||
| Intermediate | 19 | 8 | 11 | ||||||
| High | 2 | 1 | 1 | ||||||
| Time since the diagnosis | |||||||||
| 1-5 years | 19 | 8 | 10 | ||||||
| 6-10 years | 7 | 3 | 5 | ||||||
| 11-20 years | 2 | 2 | - | ||||||
| 21-30 years | - | - | - | ||||||
| >30 years | - | - | - | ||||||
| Age at diagnosis | |||||||||
| <18 years | 1 | 0 | 1 | ||||||
| 18-30 | 7 | 3 | 4 | ||||||
| 30-40 | 10 | 5 | 3 | ||||||
| 40-50 | 6 | 1 | 6 | ||||||
| >50 years | 4 | 4 | 1 |
Table 1: Characteristics of CD patients according with level of adherence to GFD. Data are presented as n (%) when appropriate.
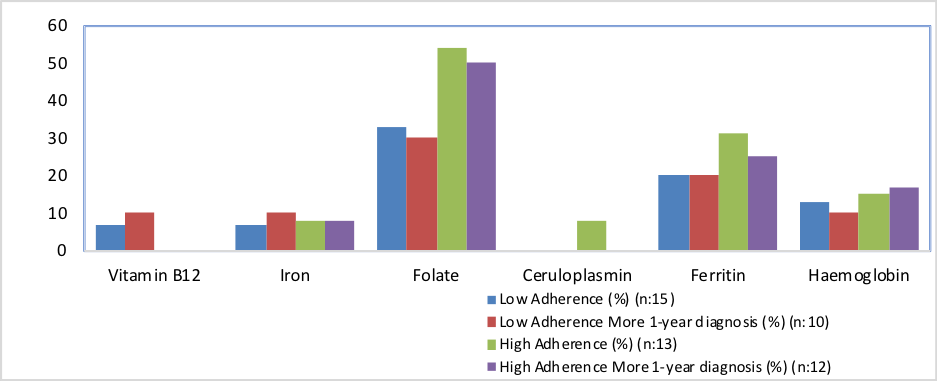
Serum nutritional markers showed some deficiencies. Thus, 6.7% and 7.7% of patients with high and low adherence respectively had low serum iron concentration and only 7.0% of patients with low adherence had low serum vitamin B12 concentration.
46.4% of people with celiac disease showed a low serum folate concentration, with the most widespread deficiency in those patients who reported high adherence (53.8%) compared to those with low adherence (33.3%). These results indicated that patients who follow a strict GFD have a higher prevalence of folate deficiency compared to those with low level of adherence to diet (Figure 2).
| High Adherence | Low Adherence | Significance differences # | |||||||
|---|---|---|---|---|---|---|---|---|---|
| Folate * | |||||||||
| Media and standard deviation | 3.8 ± 2.8 | 4.6±4.17 | Ns (p=0.3, p >0.05) | ||||||
| Range | 1.0-10.4 | 1.6-18 | |||||||
| Magnesium * | |||||||||
| Media and standard deviation | 2.0±0.21 | 2.0±0.16 | Ns (p=0.5, p >0.05) | ||||||
| Range | 1.74-2.42 | 1.76-2.33 | |||||||
| Iron * | |||||||||
| Media and standard deviation | 110.5 ±32.41 | 117.6 ±38.35 | Ns (p=0.3, p >0.05) | ||||||
| Range | 44-139 | 54-194 | |||||||
| Vitamin B12 * | |||||||||
| Media and standard deviation | 569.5 ±442.48 | 373 ±117.5 | Ns (p=0.07, p >0.05) | ||||||
| Range | 294 –greater 2000 | 173-549 |
No significant differences were found in the mean serum concentration of folate, magnesium, iron and vitamin B12 between both groups, high and low adhesion (p> 0.05) (Table 2). The mean concentrations of folate, magnesium, iron and vitamin B12 were within the normal ranges for patients with high and low adherence.
No patient had low albumin levels and only 3.6% of CD patients had low serum ceruloplasmin levels.
The factor questionnaire did not show a significant association between the presence of symptoms and the level of adherence to the GFD (p=1,000), 84% of patients responded that they had positive symptoms (abdominal pain, discomfort, diarrhea, others), but only 32% of the total said that these symptoms influenced the will to comply with the diet. Half of the population felt depressed and 64% of them said that this feeling negatively influenced their adherence behavior, however, this factor was not significantly associated with adherence to the GFD (p = 0.445).
Costs of gluten free foods

No 29%
YES 71%
Only 11% of the patients responded that they do not have family support to be able to comply with the treatment and 46% of CD patients who have family support considered that family and social events, represent an obstacle in the fulfillment of the diet due to the great offer of gluten-free foods. This situation was significantly associated with the worst adherence to the gluten-free diet (p=0.026, p <0.05).
Another barrier in treatment is represented by the lack of availability of gluten-free foods in the market (for 64% of respondents), and two-thirds of the population (71%), considered that the cost of these foods also has a negative impact (Figure 3). However, these factors were not significantly associated with adherence to the GFD (p = 0.705 and p = 0.670 respectively). No person assumed physical impossibilities that prevented him from preparing his own meals, but 39% said he had difficulty doing them for several reasons: not having adequate physical space, kitchen items, lack of time, variety of recipes, lack of will.
Influence of lack of product offer in the market yes
36% no
64% Figure 3: Percentage of answers reported of some items of factor questionnaire.
domain of body pain shows values below 50 in all age ranges and in both genders, being lower in the age range between 18 and 40 years (21.9 to 28.7) and in women (24.0 to 27.1). For the Mental Component Summary (SCM), the values were above 50 and in energy and vitality, they were lower than 50 in the range of 18 to 40- year-old group (37.5± 25.2) and in women (41.7 ±28.8).
| Domain* | Total (n:28) | Age | Age + 41 (n:12) | Female (n:24) | Male (n:4) | |||
|---|---|---|---|---|---|---|---|---|
| 18-40 y | ||||||||
| (n:16) | ||||||||
| Physical functioning | 82.128.8 (71.6-93.0) | 89.120.3 (81.6-96.6) | 68.935.9 (54.9-85.1) | 76.034.2 (63.4-88.6) | 62.541.5 (47.2-77.8) | |||
| Physical role | 73.241.9 | 78.140.7 | 67.144.1 | 76.034.2 | 62.547.9 |
Table 3: Mean values, standard deviation and 95 % confidence interval of the domains of the SF12 questionnaire by age and gender.
| (57.7-88.7) | (63.0-93.2) | (46.7-85.1) | (63.4-88.6) | (44.8-80.8) | |
|---|---|---|---|---|---|
| Pain | 25.029.7 (43.7-65.7) | 21.928.7 (11.3-32.5) | 30.033.6 (15.7-50.2) | 24.027.1 (14.0-34.0) | 31.347.9 (13.6-49.0) |
| General health perception | 45.524.5 (36.4-54.6) | 34.322.0 (26.2-42.4) | 60.822.8 (47.2-75.7) | 46.823.6 (38.1-55.5) | 37.532.3 (25.5-49.4) |
| Social functioning | 71.436.4 (57.9-84.9) | 84.422.1 (76.2-92.6) | 55.746.3 (27.6-80.5) | 72.936.1 (59.6-86.2) | 62.547.9 (44.8-80.2) |
| Energy/ vitality | 42.130.0 (31.0-53.2) | 37.525.2 (28.2-46.8) | 53.133.8 (38.9-65.1) | 41.728.8 (31.1-52.3) | 45.041.2 (21.8-60.2) |
| Emotional Role | 64.344.8 (47.7-80.9) | 78.140.7 (63.0-93.2) | 43.544.8 (13.5-73.1) | 64.645.4 (47.9-81.3) | 62.547.9 (44.8-80.2) |
| Mental Health | 45.520.9 (37.8-53.2) | 49.517.2 (43.1-55.9) | 41.025.5 (30.1-52.6) | 48.320.6 (40.7-55.9) | 47.518.9 (40.5-54.5) |
| PCS | 63.517.0 (57.2-69.8) | 65.115.5 (59.0-71.2) | 61.919.0 (52.4-72.6) | 65.315.7 (59.5-71.1) | 53.123.2 (59.5-73.8) |
| MCS | 55.519.0 (36.3-62.3) | 62.914.9 (57.4-68.4) | 46.418.1 (37.4-58.1) | 56.718.6 (49.8-63.6) | 54.620.2 (47.1-62.1) |
Table 4: Mean values, standard deviation and 95 % confidence interval of the domains of the SF12 questionnaire by age and gender.
Table 3: Mean values, standard deviation and 95 % confidence interval of the domains of the SF12 questionnaire by age and gender. *Data are presented as mean ±SD and confidence interval (95 %). Physical component summary (PCS) included physical functioning (PF), physical role (PR), pain (P), and general health (GH). Mental component summary (MCS) included social functioning (SF), energy/vitality (E/V), emotional role (ER) and mental health (MH) years old (Table 4).
| Physical Component Summary (PCS) | Mental Component Summary | ||||
|---|---|---|---|---|---|
| (MCS) | |||||
| Age 18-40 years (n:16) | 65.115.5 (59.0-71.2) | 62.914.9 (57.4-68.4) | |||
| Age >41 years (n:12) | 61.919.0 (52.4-72.6) | 46.418.1 (37.4-58.1) | |||
| p Value * | Ns (p >0.05) | Ns (p >0.05) | |||
| Female (n:24) | 65.315.7 (59.5-71.1) | 56.718.6 (59.5-73.8) | |||
| Male (n:4) | 53.123.2 (59.5-73.8) | 54.620.2 (47.1-62.1) | |||
| p Value* | Ns (p >0.05) | Ns (p >0.05) |
Table 5: Quality of life: comparison of Physical Component Summary (PCS) and Mental Component Summary (MCS) by age and gender. *p
Discussion
This study aimed to assess the effect of GFD on the micronutrient status, on the quality of life and to evaluate the factors that influence the GFD adherence of adults with CD.
Although no significance differences (p>0.05) were found in the mean serum concentrations of folate, magnesium, iron and vitamin B12 between high and low adherence group, almost 46.4 % of CD patients showed low serum folate concentration (<3.1 ng/ml). The deficiency of serum folate was more widespread in those patients who reported high adherence (53.8%) than in those with low adherence (33.3 %). The current observation showed that those patients who follow a strict GFD, have more frequently low serum folate concentration. These results show that the intake of GFD can accentuate nutritional deficiencies that may already be present in patients with CD. Previous reports have shown folate deficiencies in subjects with newly diagnosed disease and even in adults detected by screening [10, 11].
CD patients should be advised on the nutritional quality of gluten free food, taking into account that some inadequacies of dietary intake, such as deficient intake of folate, may be originated in the food choice, in addition to inherent deficiencies in GFD. The prevalence of folate deficiency among the celiac patients was quite different from that reported of women of the same range of age in Argentina (53.8 % vs 4 %, celiac patients and adult women, respectively) [12]. Though the sample size is small, these results were in agreement with previous studies that show low folic acid intake in celiac patients when compared with the general population [2, 13].
The prevalence of serum vitamin B12 is quite similar to the general population. In Argentina, 49% of pregnant women and 12% of adult women presented low serum vitamin B12 [12]. We observed that 6.6 % of celiac patients have low serum concentration of vitamin B12 (<187 pg/ml).
The prevalence of anemia (14.2%) was in the range of different studies that reported anemia between 12% to 69 % of newly diagnosed patients with CD (hemoglobin concentration < 12 g%) [14]. No differences were observed in the percentage of CD patients with serum iron deficiency (Fe concentration: 65-180 ng/ml) between the group of low and high adherence (6.7 % vs 7.7 %).
Many factors have been assessed through the factors’s questionnaire, only difficulty to follow GFD during social events, when dining out, presented significant association (p=0.026, p <0.05). The lack of information in the composition of food in restaurant or social meetings could be a negatively influence [15]. The percentage of patients (47 %) that reported high adherence to the diet was quite lower than those observed by us in a previous work (72.3%; unpublished results); this situation showed some kind of deterioration in the compliance to GFD.
The patients tend to overestimate the level of adherence to GFD, 64 % of patients answered that they follow strictly the treatment in contrast to only 47 % of the same group that expert nutritionists ranked as high adherent. No association was found between the level of adherence to GFD and the serum micronutrients concentration.
54% of patients report eating corn-based foods 3 or more times a week, while in a previous survey only 2.6 to 7.4% of general student population consumes cornmeal [9].
The evaluation of quality of life was acceptable for the PCS (63.5±17.0) but the perception of physical (21.9±28.7) pain and general health perception (34.3±22.0) indicated deterioration especially in the age range of 18 to 40 years. Previous surveys have reported low score of the emotional dimension in the group of CD patients under GFD treatment [16]. The MCS (55.5±19.0) was acceptable. We observed the lowest scores of the emotional role (43.5±44.8) in the group older than 41 years, and the vitality and energy component (37.5±25.2) indicated worsening especially in the age range of 18 to 40 years.
In previous studies, the evidence suggests that the level of compliance to diet is not related to the status of quality of life, although some studies have reported some kind of associations in some domains (perception of health) [17]. In our study, no association was observed between MCS domain and the level adherence to GFD (p:0.594 >0.05).
Conclusions
The low serum level of folate in both groups of patients, those who adhere to the diet and those who don’t, shows the need to increase the consumption of this micronutrient, it is important to consume the appropriate amounts of foods rich in folic acid, such as green leafy vegetables, such as arugula, spinach, endive, lettuce, chard.
Recommendations for dietary supplementation should be reviewed to take these deficiencies into account and to improve the nutritional quality of GF food products and hence the health of CD patients adhering to the GFD.
The health and quality of life of people with celiac disease could be get better with the increment of offer of gluten-free foods in restaurants, markets and food supply locations.
Strategies to disseminate information about this disease in the population are necessary and education programs should be included both for patients and for the medical team and the people who process food.
Conflicts of Interest
The authors declare no conflict of interest
Acknowledgments
The authors thank the National University of Mar del Plata (Proyecto CEN-005-2016). They thank the Argentine Celiac Association, Mar del Plata branch, for their collaboration in the call for patients who participated in this project.
References
-
Rubio Tapia A, Hill ID, Kelly CP, Calderwood AH, Murray JA (2013) ACG Clinical Guidelines: Diagnosis and Management of Celiac Disease. Am J Gastroenterol 108(5): 656-676.
-
Husby S, Murray JA, Katzka DA (2019) AGA Clinical Practice Update on Diagnosis and Monitoring of Celiac Disease-Changing Utility of Serology and Histologic Measures: Expert Review. Gastroeneterology 156(4): 885-889.
-
Thimmaiah G, Theethira T, Dennis M, Leffler D (2014) Nutritional consequences of celiac disease and the gluten-free diet. Expert Rev Gastroenterol Hepatol 8(2): 123-129.
-
Pirán Arce M, Aballay L, Leporati J, Navarro A, Forneris (2018) Blood iron levels in accordance with adherence to a gluten-free diet in celiac school aged children. Nutr Hosp 35: 25-32.
-
Leffler D, Edwards George J, Dennis M, Schuppan D, Cook F, et al. (2008) Factors that Influence Adherence to a Gluten-Free Diet in Adults with Celiac Disease. Dig Dis Sci 53(6): 1573-1581.
-
Altobelli E, Paduano R, Gentile T, Caloisi C, Marziliano C, et al. (2013) Health-related quality of life in children and adolescents with celiac disease: survey of a population from central Italy. Health and Quality of Life Outcomes 11: 204.
-
Walker Smith J, Guandalini S, Schmitz J (1990) Revised criteria for diagnosis of coeliac disease. Report of Working Group of European Society of Paediatric Gastroenterology and Nutrition. Archives of Disease in Childhood 65(8): 909-911.
-
Leffler D, Dennis M, Edwards George J, Jamma S, Magge S, et al. (2009) Simple Validated Gluten-Free Diet Adherence Survey for Adults with Celiac Disease. Clinical Gastroenterology and hepatology 7: 530-536.
-
Pacin A, E Martínez, ML, Portel ML, Neira MS (1999) Consumo de alimentos e ingesta de algunos nutrientes en la población de la Universidad Nacional de Luján, Argentina. Archivos Latinoamericanos de Nutrición 49: 31-39.
-
Kemppainen TA, Kosma VM, Janatuinen EK, Julkunen RJ, Pikkarainen PH, et al. (1998) Nutritional status of newly diagnosed celiac disease patients before and after the institution of a celiac disease diet: association with the grade of mucosalvillous atrophy. Am J Clin Nutr 67(3): 482-487.
-
Haapalahti M, Kulmala P, Karttunen TJ, Paajanen L, Laurila K (2005) Nutritional status in adolescents and young adults with screen-detected celiac disease. J Pediatr.Gastroenterol Nutr 40: 566-570.
-
Brito A, Mujica Coopman M, Olivares M, Lopez de Roman D, Cori H, et al. (2015) Folate and Vitamin B12 Status in Latin America and the Caribbean: An Update Food and Nutrition Bulletin 36 (Supplement 2): S109- S118.
-
Shepherd J, Gibson P (2012) Nutritional inadequacies of the gluten-free diet in both recently diagnosed and long-term patients with coeliac disease. J Hum Nutr Diet 26(4): 349-358.
-
Bodé S, Gudmand Høyer E (1996) Symptoms and haematologic features in consecutive adult coeliac patients. Scand J Gastroenterol 31(1): 54-60.
-
Vici G, Belli L, Biondi M, Polzonetti V (2016) Gluten Free Diet and Nutrient Deficiencies: A Review. Clin. Nutr 35: 1236-1241.
-
Casellas, L Rodrigo, J López Vivancos (2008) Factors that impact health-related quality of life in adults with celiac disease. A multicenter study F World J Gastroenterol 14(1): 46-52.
-
Hall NJ, Rubin G, Charnock A (2009) Systematic review: adherence to a gluten-free diet in adult patients with coeliac disease. Aliment Pharmacol Ther 30(4): 315-330.
- The Role of Podocyte Apoptosis and the Involvement of SIRT1 in Diabetic Nephropathy
- Dealcoholization of Beer by Osmotic Distillation for the Beverage Industry
- Biopolymer-Based Edible Packaging- Biomaterials, Methods, and Applications in Food Industry: An Updated Review
- Influence of Bioprocessing Methods on 'China Rice' (Gawal R1), and Soyabean Supplementation on the Quality of Complementary Food
- Cassava (Manihot esculenta) Varietal Growth, Yield and Cyanide Content Performance in Three Sites in the South- Eastern Semi Arid Regions of Kenya
- Food Waste Treatment, Recycling, Management and Production of Value-Products-An Update on Methodologies and Current Trends