Heavy Metal Analysis in Some Common Foods and Drugs Available in Nigeria
Table Sugar, Milo, Antibiotic–Metronidazole, Antimalaria–Artemether & Lumefanthrine are among the most commonly used Foods and Drugs in Nigeria. In this study, analysis of four heavy metals: Cr, Cu, Cd, and Pb were done by FAAS technique in the Food and Drug samples. Cr was detected in the Sugar sample only with mean concentration of 0.295 ppm. Similarly, only the antibiotic–Metronidazole sample had about 0.022 ppm concentration of Cd with none in the other three samples. These concentrations of Cr and Cd in Sugar and Antibiotic were found to be below the maximum permissible limits set by WHO/FAO and NAFDAC. Both Cu and Pb were not detected in any of the samples. This is good information because Pb is potentially toxic. The overall outcome of the study has indicated that the analyzed food and drug brands are safe for utilization.
Introduction
Heavy metals are generally referred to as those metals which possess a specific density of more than 5 g/cm3 and adversely affect the environment and living organisms [1]. These metals are quintessential to maintain various biochemical and physiological functions in living organisms even at very low concentrations. However, they become noxious when they exceed certain threshold concentrations. Although heavy metals have been known to cause many adverse health effects and last for a long period of time. Heavy metal exposure continues and is increasing in many parts of the world. Heavy metals are significant environmental pollutants and their toxicity is a problem of increasing significance for ecological, evolutionary, nutritional and environmental reasons. The most commonly found heavy metals in foodstuffs and drugs include arsenic, cadmium, chromium, copper, lead, nickel, and zinc, all of which pose risks for human health and the environment [2].
The problem of heavy metal contamination in the environment has been a major challenge in Africa, especially in densely populated countries such as Nigeria. This problem has arisen due to uncontrolled pollution levels as a result of factors such as industrial growth and increase in vehicular traffic, irrigation of farmlands and the addition of metal- based fertilizers and pesticides to farmlands and crops which eventually affect foodstuffs [3]. Problems associated with the land tenure system in many cities of developing and third world countries result in hazardous places, such as road verges, banks of drainage channels, and refuse dumpsites, being converted to vegetable gardens. This has led to contamination of air and soils on highways and the crops cultivated or marketed in these places [2]. Furthermore, heavy metals have been known to cause many adverse health effects and last for a long period of time. A number of them include the consumption of contaminated foodstuffs which can seriously deplete some essential nutrients in the body, leading to decreased immunological defenses, intrauterine growth retardation, impaired psychosocial behaviours, disabilities associated with malnutrition, and a high prevalence of gastrointestinal cancer [2]. Impurity profiling of pharmaceutical products is a major area of concern. Strict regulations are laid down for their effective use. The impurities in a drug could be organic or inorganic in nature. Much is known about organic impurities while the inorganic impurities [4] are gaining importance recently. The inorganic impurities which are metal contamination gets into the bulk drug substances and intermediates through raw materials, catalysts, reagents, solvents and various equipments used for synthesis. The passage of heavy metal ions during processing have the ability to decompose the materials of interest, which may sometimes lead to potential toxic effects, in addition to self-toxicity. Hence, it is obvious that the metal ion contents need to be routinely monitored. Though the toxicity of trace metal ions such as mercury (Hg), arsenic (As), lead (Pb) is known but their limits in pharmaceutical products have not been defined clearly [5]. Some of the heavy metals are also required as micronutrients, but above the necessary range, they cause toxicity.
Due to an increased exposure to heavy metals and dietary heavy metals intake has contributed to the development of various disorders. However, it is necessary to monitor the levels of these metals in food and drugs since they enter into the body. Local foodstuffs commonly available in different parts of Nigeria have also been found to contribute to the body’s burden of heavy metals, and this is of public health importance.
According to official Pharmacopoeias such as British and United States Pharmacopeia describe heavy metal test in these drugs [5, 6]. The method consists of precipitation of heavy metals as sulphides and visual comparison of the colour with that obtained from similarly prepared solution of standard lead solution. The elements respond to the test by yielding different colours namely; white, yellow, orange, black and dark brown [7]. Based on only colour as parameter, it is difficult to give the identity for the ion responsible for the colour. The procedure lacks specificity, sensitivity and is time consuming with no information about the recoveries. Several attempts have been made to improve the procedure but the advantages are not many [7], the main disadvantages being their suitability for few elements and unequal sensitivity. However, Atomic Absorption Spectroscopy is the most widely used technique for convenient determination of heavy metals in various matrices. A large number of elements can be determined with high sensitivity.
Penicillins (most frequently amoxicillin/clavulanate), and nitroimidazole (most frequently metronidazole) were the most commonly prescribed antibiotics with percentage share of 43.3% and 22.2% [8]. According to Ebohon, et al. [9] it is essential to re-evaluate the use of artemether- lumefantrine combination in Nigeria since it is one of the most commonly used ACT (Artemisinin-based combination therapy) drugs.
The main aim of this work therefore, is to determine the concentrations of four heavy metals: Cr, Cu, Cd, and Pb by AAS technique in some selected Food and Drug samples that are available in Nigerian community.
Materials and Methods
Sample Collection and Treatment
The samples used in this research work include some food stuffs and drugs which are commonly used in Nigeria. The food stuffs include Table Sugar (DANGOTE VITAMIN A FORTIFIED REFINED GRANULATED WHITE SUGAR) and Nestle Milo Powder Sachet (cocoa based product, source or brand name: NESTLE) while the drugs include anti-malarial drug; LOVATEM (Artemether 80 mg & Lumefantrine 480 mg) and antibiotic; ALBEGYL (Metronidazole 200 mg/5 ml). These are among the commonly used food stuffs and drugs in Nigeria. Tablets of the antimalarial drug and suspension of the antibiotic were used. The samples were purchased from local retail shop and pharmacy in Aliero town, Kebbi State, Nigeria. Three different samples of the same food and drug brand were collected or purchased, these were then combined and a representative sample for each food and drug was taken for analysis. The tablet samples were grounded using mortar and pestle to increase surface area of reaction during digestion while others were used directly provided that there is good surface area for reaction. Treated sample was then stored in an air-tight container and then taken to the General Chemistry Laboratory together with the other samples for sample digestion prior to AAS metal determination.
Wet digestion
The method of sample digestion by Farooq, et al. [10], was adopted with a slight modification. Triplicate samples 1.0 g was weighed into separate conical flasks. 5 mL of concentrated nitric acid was then added and the contents heated at 70-80°C for 2-3 hours, on a hot plate. Heating was continued at about 150°C to completely decompose the organic matter, until clear solution was obtained. All contents of the flasks were evaporated and the semidried mass was dissolved in a small amount (approx. 5mL) of deionized water, filtered through Whattman number 42 paper, and made up to a final volume of 50 mL in volumetric flask with 2N nitric acid.
Heavy Metal Determination
The digested samples were taken to the Central Research Laboratory at Kebbi State University of Science and Technology, Aliero, for AAS determination of heavy metals including Cadmium, Chromium, lead, and Copper. The AAS instrument was used to determine the presence and concentration in the sample containing the metal analyte. The digested sample is aspirated into air-acetylene flame causing evaporation of the solvent and vaporization of free metal atoms, this method is called atomization, a light source (hallow cathode lamp) operating in the Uv-visible spectra region is used to cause electronic excitation of the metal and the absorbance is measured with a conventional Uv-visible dispersive spectrometer with photomultiplier detector.
Results and Discussion
The results shown in Tables 1-4 reveal the outcome of the heavy metal analysis by using AAS technique in the studied samples of food and drug. The tables have values as mean concentration of metals in ppm, standard deviation, and the percentage relative standard deviation. S.D (S) describes the spread of the individual measurements about the mean. The true mean lies within the range of $$ \mu = x + S. D $$
Therefore, the values that do not fall within this range
are possible errors. Any value outside this range may be an
error which after other statistical operations, a decision of
whether to accept or reject these values is made at a given
confidence limit on the basis of the level of deviation. The
value of the S.D. is usually reported in the same unit as that
of the mean. According to Everitt, et al. [11], ‘‘the relative
standard deviation (RSD) is a special form of the standard
deviation (std dev). It is generally reported to two decimal
places (i.e. an RSD of 2.9587878 becomes 2.96). As the
denominator is the absolute value of the mean, the RSD
will always be positive. The RSD shows or indicates that the
“regular” std dev is a small or large quantity when compared
to the mean for the data set. For example, you might find in
an experiment that the std dev is 0.1 and your mean is 4.4.
0.1 :100 2.3% 4.4 Your RSD for this set of numbers is × =
This result tells you that your standard deviation is 2.3% of the mean of 4.4, which is pretty small. In other words, the data is tightly clustered around the mean. On the other hand, if your percentage was large, say, 55% – this would indicate your data is more spread out. The RSD is sometimes used for convenience but it can also give you an idea about how precise your data is in an experiment. The more precise your data is, the smaller will be the RSD. The RSD usually written with the mean and a plus/minus symbol: 4.4 ± 2.3%. In some cases, the coefficient of variation and the RSD are the same thing. However, the RSD cannot be negative while the Coefficient of Variation can be positive or negative. This is because the two formulas differ in a minor way: the Coefficient of Variation divides by the mean while the RSD divides by the absolute value of the mean’’. The relative standard deviation of a set of data can be depicted as either a percentage or as a number.
In Table 1, the mean concentrations of Chromium in the sample of Sugar, Milo, Antimalarial, and Antibiotic are given in ppm. Only the Sugar sample had Chromium in the concentration of 0.295 ppm. The other three samples did not contain Chromium as it was not detected in those samples. The concentration 0.295 ppm for Chromium is below the permissible limit set by WHO/FAO and NAFDAC as shown in Table 5. Hence, the studied sugar and other samples are safe for human consumption.
| S/N | SAMPLE | CONC.(ppm) | SD | RSD (%) | |
|---|---|---|---|---|---|
| 1 | Sugar | 0.295 | 0.004 | 1.36 | |
| 2 | Milo | ND | - | - | |
| 3 | Antimalarial | ND | - | - | |
| 4 | Antibiotic | ND | - | - |
Table 1: The Mean Concentration of Chromium (Cr) in the Samples. Keys: ND = Not detected, SD = Standard Deviation, RSD = Relative
| S/N | SAMPLE | CONC.(PPM) | SD | RSD(%) |
|---|---|---|---|---|
| 1 | Sugar | ND | - | - |
| 2 | Milo | ND | - | - |
| 3 | Antimalarial | ND | - | - |
| 4 | Antibiotic | ND | - | - |
Table 2: The Mean Concentration of Copper (Cu) in the Samples. Keys: ND = Not detected, SD = Standard Deviation, RSD = Relative S
Table 2: The Mean Concentration of Copper (Cu) in the Samples. Keys: ND = Not detected, SD = Standard Deviation, RSD = Relative Standard Deviation In Table 2, the mean concentrations of Copper in the sample of Sugar, Milo, Antimalarial, and Antibiotic are given in ppm. The results in the table indicated that none of the samples contain any significant concentration of Copper as it was not detected in any of the samples. Though the maximum permissible limit set by WHO/FAO and NAFDAC as shown in Table 5 for Copper metal is about 73.00 and 40.00 ppm or µg/g by the two regulatory bodies respectively, the metal was still not detected in the samples. Hence, there is no any concern for any possible toxicity from Copper metal in these samples.
In Table 3, the mean concentrations of Cadmium in the sample of Sugar, Milo, Antimalarial, and Antibiotic are given in ppm. Only the Antibiotic sample had Cadmium in the concentration of 0.022 ppm. The other three samples did not contain Cadmium as it was not detected in those samples. The concentration 0.022 ppm for Cadmium is below the permissible limit set by WHO/FAO and NAFDAC as shown in Table 5. Hence, the studied Antibiotic and other samples are safe for human consumption.
| SAMPLE | CONC.(PPM) | SD | RSD(%) | |
|---|---|---|---|---|
| 1 | Sugar | ND | - | - |
| 2 | Milo | ND | - | - |
| 3 | Antimalarial | ND | - | - |
| 4 | Antibiotic | 0.022 | 0.002 | 9.09 |
Table 4: The Mean Concentration of Cadmium (Cd) in the Samples. Keys: ND = Not detected, SD = Standard Deviation, RSD = Relative
Table 3: The Mean Concentration of Cadmium (Cd) in the Samples. Keys: ND = Not detected, SD = Standard Deviation, RSD = Relative Standard Deviation In Table 4, the mean concentrations of Lead in the sample of Sugar, Milo, Antimalarial, and Antibiotic are given in ppm. The results in the table indicated that none of the samples contain any significant concentration of Lead as it was not detected in any of the samples. Though the maximum permissible limit set by WHO/FAO and NAFDAC as shown in Table 5 for Lead metal is about 0.30 and 2.00 ppm or µg/g by the two regulatory bodies respectively, the metal was still not detected in the samples. Hence, there is no any concern for any possible toxicity from Lead metal in these samples. This is good information because the metal is a potentially toxic metal with serious health implications.
| S/N | SAMPLE | CONC.(PPM) | SD | RSD(%) | |
|---|---|---|---|---|---|
| 1 | Sugar | ND | - | - | - |
| 2 | Milo | ND | - | - | - |
| 3 | Antimalarial | ND | - | - | - |
| 4 | Antibiotic | ND | - | - | - |
Table 3: The Mean Concentration of Lead (Pb) in the Samples. Keys: ND = Not detected, SD = Standard Deviation, RSD = Relative Sta
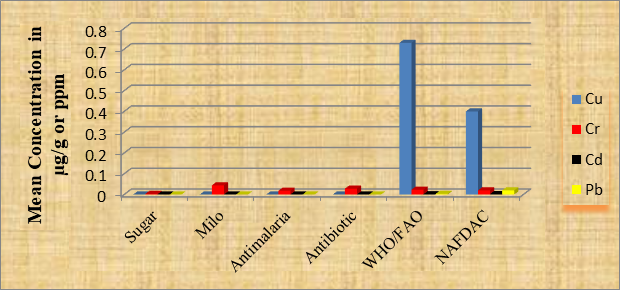
Table 4: The Mean Concentration of Lead (Pb) in the Samples. Keys: ND = Not detected, SD = Standard Deviation, RSD = Relative Standard Deviation In Table 5, the maximum or acceptable limits for the four heavy metals analyzed in the chosen food and drug samples as set by NAFDAC and WHO/FAO is shown. These values are used as standard values for comparison with the concentrations detected in some of the studied samples. Direct comparison can be seen in Figure 1 where all the limits of these four metals as set by the regulatory bodies can be easily compared with the amount detected in some of the samples.
| WHO/FAO*(µg/g) | NAFDAC*(µg/g) | |
|---|---|---|
| Cu | 73 | 40 |
| Cr | 2.3 | 2 |
| Cd | 0.1 | 0.2 |
| Pb | 0.3 | 2 |
Table 5: The Acceptable Metal Levels in Foods by NAFDAC and WHO/FAO. *Adefarati, et al. [12]
According to RSD Horwitch function the highest relative standard deviation values acceptable for the concentration of less than or equal to 1000 ppm is 10% [13]. Hence, since the values of relative standard deviations (% RSD) in Tables 1-4 are less than 10% for all of the mean concentrations of metals, the analysis showed reasonable repeatability accuracy because the relative standard deviation values evaluated were within the acceptable range.
Conclusion
The analyzed samples which include Sugar, Milo, Antibiotic (Metronidazole), and Antimalarial (Artemether & Lumefantrine) are among the most commonly used foods and drugs in Nigeria. The results of AAS analysis of these samples indicated that, both Pb and Cu were not detected in any of the samples, though, Cu is not as toxic as Pb. Cu can be toxic or harmful above 73.00 µg/g or 40.00 µg/g as seen from the limits set by the regulatory bodies (WHO/FAO and NAFDAC). Pb on the other hand, is very toxic with WHO/FAO and NAFDAC limits of 0.30 µg/g and 2.00 µg/g respectively, but was not detected in any of the samples, which is good to know. Cr and Cd, however, were detected in the Sugar and Antibiotic samples respectively, but were found to be below the maximum permissible limits of WHO/FAO and NAFDAC. In comparison with the study by Onyeloni, et al. [14], Pb was not detected in the Artemether/Lumefantrine syrup, but a value of 11.2µg/g Cu was detected. Also, around 4.9 µg/g concentration for Pb was detected in the Metronidazole sample and a 1 µg/g value for Cu in the study. The overall outcome of this study has indicated that the selected food and drug brands are safe for utilization [15].
Conflicts of Interest
The authors declare no conflict of interest
References
-
Jarup L (2003) Hazards of Heavy Metal Contamination. British Medical Bulletin 68: 167-182.
-
Onakpa MM, Njan AA, Kalu OC (2018) A Review of Heavy Metal Contamination of Food Crops in Nigeria. Annals of Global Health 84(3): 488-494.
-
Iweala E, Olugbuyiro JAO, Durodola BM, Fubara-Manuel DR, Okoli AO (2014) Metal Contamination of Foods and Drinks Consumed in Ota, Nigeria. Research Journal of Environmental Heavyology 8(2): 92-97.
-
Lewen N, Mathew S, Schenkenberger M, Raglione T (2004) A rapid ICP-MS screen for heavy metals in pharmaceutical compounds. J Pharm Biomed Anal 35(4): 739-752.
-
British Pharmacopoeia (2017) Her Majesty’s Stationery Office, London 2.
-
The United States Pharmacopoeia (2017) The National Formulary, XXII, United States Pharmacopoeial Convention, 12601 Twin Brook Parkway, Rockville.
-
Krishna-Murty ASR, Kulshresta UC, Rao NT, Kumar- Talluri MVN (2005) Determination of heavy metals in selected drug substances by inductively coupled plasma – mass spectrometry. Indian Journal of Chemical Technology 12: 229-231.
-
Okoro RN, Nmeka C, Erah PO (2019) Antibiotics prescription pattern and determinants of utilization in the national health insurance scheme at a Tertiary Hospital in Nigeria. Afri Health Sci 19(3): 2356-2364.
-
Ebohon O, Irabor F, Ebohon LO, Omoregie ES (2019) Therapeutic failure after regimen with artemether- lumefantrine combination therapy: a report of three cases in Benin City, Nigeria. Journal of the Brazilian Society of Tropical Medicine 52: 1-3.
-
Farooq A, Kazi TG, Rubina S, Bhanger MI (2004) Rapid determination of some trace metals in several oils and fats. Grasas y Aceites 55(2): 160-168.
-
Everitt BS, Skrondal A (2010) The Cambridge Dictionary of Statistics. 4th(Edn.), Cambridge University Press, pp: 480.
-
Oloruntoba A, Oloruntoba AP, Oluwaseun AR (2017) Determination of Heavy Metal Levels In Green Pea (Pisum Sativum) A Case Study of Selected Markets In Abuja, FCT. American Journal of Innovative Research and Applied Sciences 5(5): 343-349.
-
Aquisman AE, Assim ZB, Wahi RB, Kwabena DE, Festus W (2019) Validation of the Atomic Absorption Spectroscopy (AAS) for Heavy Metal Analysis and Geochemical Exploration of Sediment Samples from the Sebangan River. Advances in Analytical Chemistry 9(2): 23-33.
-
Onyeloni SO (2022) Heavy Metal Contamination of Pharmaceutical Products commonly sold in Nigeria. Madonna University Journal of Medicine and Health Sciences 2(2): 10-21.
-
Gonick L (1993) The Cartoon Guide to Statistics. HarperPerennial.
- The Role of Podocyte Apoptosis and the Involvement of SIRT1 in Diabetic Nephropathy
- Dealcoholization of Beer by Osmotic Distillation for the Beverage Industry
- Biopolymer-Based Edible Packaging- Biomaterials, Methods, and Applications in Food Industry: An Updated Review
- Influence of Bioprocessing Methods on 'China Rice' (Gawal R1), and Soyabean Supplementation on the Quality of Complementary Food
- Cassava (Manihot esculenta) Varietal Growth, Yield and Cyanide Content Performance in Three Sites in the South- Eastern Semi Arid Regions of Kenya
- Food Waste Treatment, Recycling, Management and Production of Value-Products-An Update on Methodologies and Current Trends