A Pilot Study Investigating Tooth Wear as a Possible Aging Indicator in a Modern Population
This study explores the correlation between tooth wear and age at death of modern people to appreciate the appropriateness of using tooth wear as an independent aging indicator in a forensic context. As a pilot study, dentition of 73 White males was examined from the William M. Bass Donated Collection. For the sake of consistency in methodology with previous studies, traditional regression models were used, though Bayesian methods are becoming increasingly popular. The results showed a low level of correlation between tooth wear and age, particularly when compared to previous age estimation studies in general. Therefore, it was concluded that tooth wear alone is not an appropriate age indicator for a modern population. This study is expected to provide a quantitative basis for future research to develop new age estimation methods using teeth.
Introduction
Age at death consists of a crucial part of biological profile of skeletal remains in forensic anthropology [1, 2]. One of the age indicators frequently studied is teeth [3]. Age estimation techniques using teeth are generally categorized into morphological, radiological or biochemical methods [2]. Tooth wear, one of the morphological traits, not only reflects chronological changes of individuals but also is easily observed even by the naked eye, which led to an extensive effort to quantify it [4, 5, 6, 7, 8, 9, 10, 11, 12, 13]. These features also suggest a possibility that tooth wear can be used as a quick identification method in a forensic context [5]. However, using tooth wear as an independent age indicator tended to be limited to archaeological [4, 9, 14] or non-Western samples [15, 16]. In many cases, tooth wear has been considered as part of multiple age estimation techniques [17, 18, 19, 20, 21, 22]. Particularly, forensic anthropologists are skeptical of utilizing tooth wear for age estimation. Rathbun and Buikstra [23] admitted that teeth are less commonly a primary source of information about age in adults. Moreover, based on my preliminary literature review, no forensic anthropology textbooks have introduced tooth wear as an independent age indicator for the past two decades [24, 25, 26, 27, 28]. Regarding this issue, Hillson [29] states that the attrition rate of modern people is too slow, which makes tooth wear difficult to be used for forensic age estimation? Lovejoy [8] is also not in favor of using tooth wear in a forensic context, even though tooth wear can be the best single indicator at a population level. However, to my knowledge, no research has been performed to test appropriateness (or inappropriateness) of using tooth wear of the modern population as an independent age indicator in a quantitative manner. The aim of this study is to quantify accuracy of the age estimation method using tooth wear of modern people, which will eventually provide an objective and reasonable basis to appreciate appropriateness or inappropriateness of tooth wear as a forensic age indicator.
Materials and Methods
Dentition of 73 modern White males was examined in the William M. Bass Donated Collection of the University of Tennessee. Teeth with severe dental pathology or trauma to hinder dental wear assessments were excluded. On average, the numbers of incisors, canines, premolars, and molars pertaining to an individual were 5.4 (SD=2.9), 3.2 (SD=1.2), 5.1 (SD=2.6), and 4.7 (SD=3.9), respectively. Due to a difference in the number of remaining teeth per tooth group, analysis was conducted for each tooth group and the entire dentition, separately. Mean age of the individuals is 52.7 years (SD=13.03) with an age range of 25 through 78 years. The age was normally distributed in the sample (Kolmogorove-Smirnov test, D(73)=.066, p>.05). All existing teeth were examined by the naked eye, and then tooth wear of each tooth was scored following Smith’s eight criteria [30]. No score was assigned to a tooth when the crown was broken or restored. After individual teeth were scored, average scores for tooth group (i.e. Incisor, Canine, Premolar, and Molar) were calculated. The paired samples t-test did not show significant differences between upper and lower teeth scores across all the tooth groups at the level of α=.05 (for incisors, t =1.359; for canines, t=1.479; for premolars, t =.942; for molars, t =-1.906). Therefore, scores from the upper and the lower teeth were pooled together as far as they belong to the same tooth group. Three age groups were defined modifying Hrdlicka’s four age categories [31]. Hrdlicka’s [31] first two categories were pooled due to a small sample size in those categories (Table 1). Tooth wear scores were regressed against both actual ages and age groups using the simple/multiple and logistic regression analyses, respectively. Statistical analysis was conducted using the Statistical Package for the Social Science, version 23 (SPSS v.23).
| Age group | Age range | # of samples | ||||||
|---|---|---|---|---|---|---|---|---|
| 1 | < 50 | 30 | ||||||
| 2 | 51 - 64 | 28 | ||||||
| 3 | > 64 | 15 |
Table 1: Number of samples in age groups.
Results
Tooth groups vs. actual ages: simple regression analysis
Overall, the correlation between tooth wear and actual ages was weak. The majority of individuals exhibited lower stages of tooth wear (i.e. less than stage 3) regardless of their actual ages (Figure 1). Given the softer and more processed diet of the modern U.S., this result was not unexpected [29, 32, 33]. This tendency was particularly well demonstrated in molars. Therefore, a weak relationship between tooth wear and actual ages could be attributed to the old individuals with low tooth wear rather than young individuals with high tooth wear. Tooth wear of premolars and molars had the highest (r= .359, R2=.129) and the lowest (r= .207, R2=.043) correlation with the actual ages, respectively. The highest R2 value, which was for the premolars, indicates that the tooth wear can account for only 12.9% of the variation in the actual ages at the most. In addition, canines and molars did not make a significant contribution to prediction of actual ages (for canines, F=2.972, p=.091, for molars, F=2.506, p=.119).
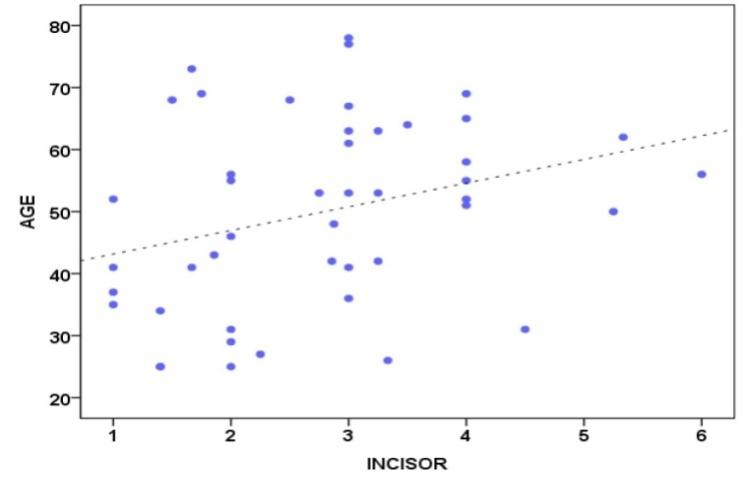
Incisor: r=.349, R2=.122, F=6.231, p=.016
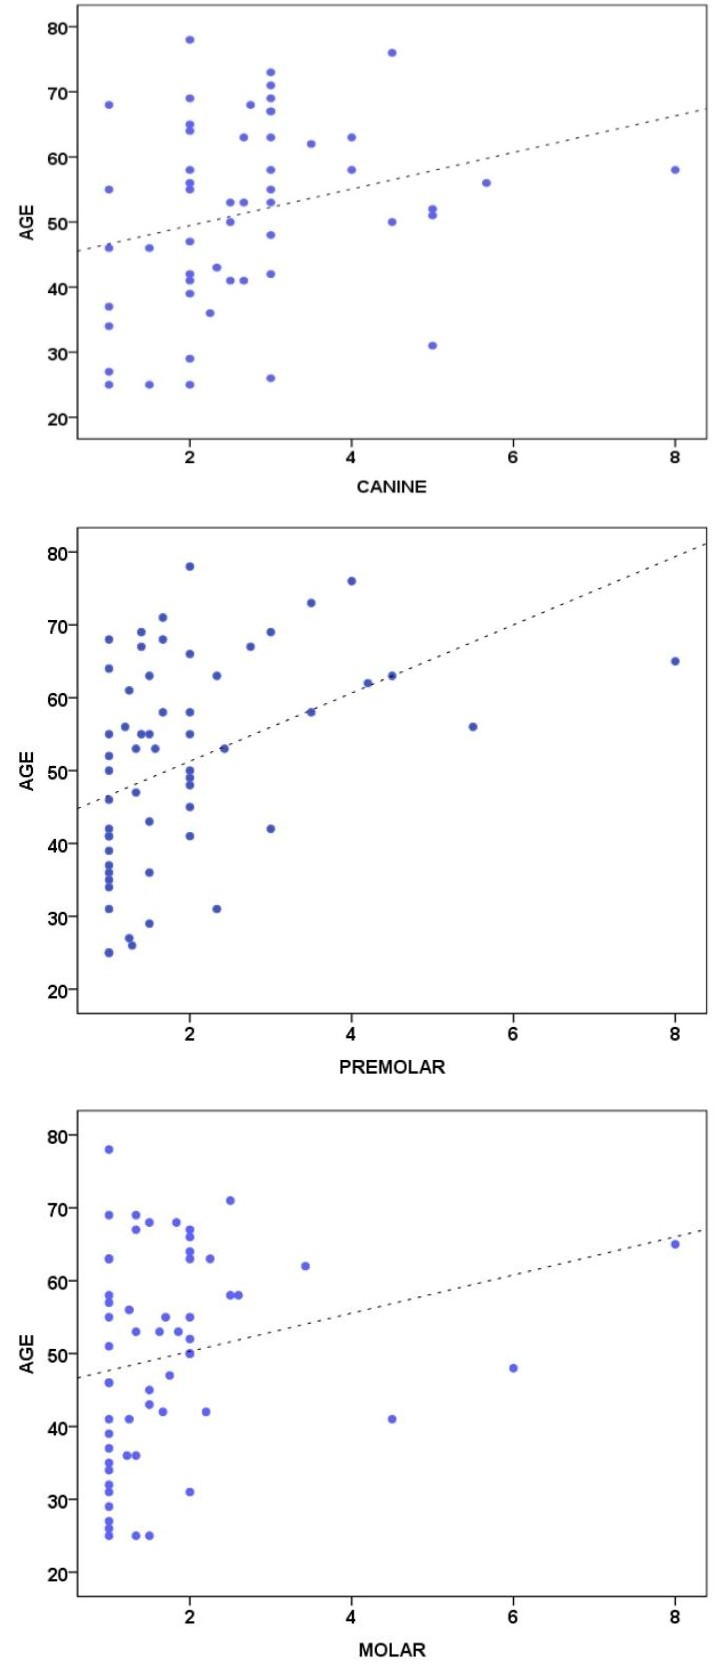
Canine: r=.235, R2=.055, F=2.972, p=.091
Premolar: r=.359, R2=.129, F=8.702, p=.005
Molar: r=.207, R2=.043, F=2.506, p=.119 Figure 1: Tooth wear stages of each tooth group regressed against actual ages.
Entire dentition vs. actual ages: multiple regression analysis with backward stepwise method In multiple regression analysis, the backward method was selected to minimize a possible Type II error [34]. When all tooth groups were considered together, the Pearson’s correlation coefficient between tooth wear and actual ages was .405 with the R2 and adjust R2 values of .164 and .06, respectively (Table 2). The adjusted R2 indicates how well the model can be generalized. Given the low value of adjusted R2, utility of this model to a general population is questionable. Other models with less variables show higher adjusted R2 values, but they are .102 or less, which is still small.
| Included | Adjusted | |||||||||||||
| Model | r | R2 | ||||||||||||
| predictors | R2 | |||||||||||||
| 1 | ||||||||||||||
| Molar, Premolar, | ||||||||||||||
| 0.41 | 0.16 | 0.06 | ||||||||||||
| Canine, Incisor | ||||||||||||||
| 2 | ||||||||||||||
| Canine, | ||||||||||||||
| 0.4 | 0.16 | 0.084 | ||||||||||||
| Premolar, Incisor | ||||||||||||||
| 3 | ||||||||||||||
| Premolar, Incisor | 0.39 | 0.15 | 0.098 | |||||||||||
| 4 | ||||||||||||||
| Incisor | 0.36 | 0.13 | 0.102 | |||||||||||
Table 2: Four models derived from the multiple regression analysis.
Tooth groups vs. age groups: logistic regression analysis Table 3 shows summarized statistics of the logistic regression analysis. The models 1 through 4 include tooth wear of incisors, canines, premolars, and molars, respectively. The chi-square test results show whether the variables make a statistically significant contribution in terms of accounting for unexplained variance. The results show each tooth group except molars contributes to predict age groups to a degree. The Goodness-of-Fit tests test whether there is a significant discrepancy between predicted and observed values. Thus, significant results indicate a significant discrepancy between the two values, which means that the model does not fit the data. Given the insignificant results of the Goodness-of-Fit tests in this study, it could be concluded that the models are good fit. Cox & Snell’s measure and Nagelkerke’s adjusted values can be interpreted in a similar way as the R2 values in the simple regression analysis. It is noticed that the molar-related model had the lowest values (.033 for Cox & Snell’s R2CS and .038 for R2N).
| Model Fitting Criteria | Likelihood Ratio Tests | Goodness-of-Fit | Pseudo R2 | ||||||||||||||||||||
|---|---|---|---|---|---|---|---|---|---|---|---|---|---|---|---|---|---|---|---|---|---|---|---|
| Model | |||||||||||||||||||||||
| -2 Log Likelihood | Chi-square | Sig. | Chi-square | Sig. | Cox & Snell | Nagelkerke | |||||||||||||||||
| 1 Intercept | 72.667 | ||||||||||||||||||||||
| Incisor | 61.016 | 11.651 | 0.003 | 50 | 0.394 | 0.22 | 0.25 | ||||||||||||||||
| 2 Intercept | 57.274 | ||||||||||||||||||||||
| Canine | 44.983 | 12.292 | 0.002 | 25.16 | 0.8 | 0.207 | 0.235 | ||||||||||||||||
| 3 Intercept | 79.442 | ||||||||||||||||||||||
| Premolar | 67.832 | 11.61 | 0.003 | 48.91 | 0.158 | 0.173 | 0.197 | ||||||||||||||||
| 4 Intercept | 64.617 | ||||||||||||||||||||||
| Molar | 62.656 | 1.961 | 0.375 | 41.45 | 0.407 | 0.033 | 0.038 |
Table 3: Result of the logistic regression analysis with backward stepwise method for the entire dentition.
Entire dentition vs. age groups: logistic regression analysis with backward stepwise method When all the four tooth groups were analyzed with the backward stepwise method, only the premolar-related model remained as a significant model (Table 4). However, the Chi-square test results show the accounted- for variance by premolars is not significant (χ2=5.832, p=.054), although the model is a good fit (χ2=71.935, p>.05). In addition, both of the Cox & Snell’s R2CS and R2N values were .146 for Cox & Snell’s R2CS and .166 for R2N, which indicate a poor performance of this model.
| Model Fitting Criteria | Likelihood Ratio Tests | Goodness-of-Fit | Pseudo R2 | ||||||||||||||||||||
|---|---|---|---|---|---|---|---|---|---|---|---|---|---|---|---|---|---|---|---|---|---|---|---|
| Model | |||||||||||||||||||||||
| -2 Log Likelihood | Chi-square | Sig. | Chi-square | Sig. | Cox & Snell | Nagelkerke | |||||||||||||||||
| Intercept | 77.97 | ||||||||||||||||||||||
| Premolar | 72.138 | 5.832 | 0.054 | 71.935 | 0.41 | 0.146 | 0.166 |
Table 4: Result of the logistic regression analysis with backward stepwise method for the entire dentition.
Discussion and Conclusion
The Bayesian methods have often been preferred in generating age estimation techniques using teeth in a forensic context [35, 36]. However, aside from discussing theoretical and/or statistical drawbacks of traditional regression-based methods, experimental research has not yet been performed to demonstrate how appropriate/inappropriate the traditional methods would be for age estimation of modern people. This study was designed to provide a quantitative basis in this regard, and therefore regression analyses were conducted on the tooth wear of modern white American males. Previous research has often utilized the correlation coefficient as an indicator of appropriateness of a regression model. (Table 5) lists the correlation coefficients between age at death and several age indicators incorporated into previous studies.
As to a validity of age estimation method, the threshold of a reasonable correlation coefficient is still under debate. While Bocquet-Appel and Masset [47] claims that a correlation coefficient of less than .90 is unable to yield accurate assessments, Lovejoy et al. [8] assert that a factor of .70 is indeed sufficient [3]. In addition to the suggestions, Table 5 can also be considered because it shows how previous researchers have actually done. In Table 10, most of the values are higher than .50 (18 out of 26), and the lowest one is .34. In this study, the highest r and R2 value was .405 and .164 respectively (Table 2). These values were obtained from the 1st multiple regression model, where all the tooth groups were included. However, as mentioned above, the adjusted R2 value of the model was only .060, which indicates that the model is unlikely to be generalized to at a population level. In fact, decreasing the number of variables increased the adjusted R2 value, which implied that some unnecessary predictor variables exaggerated the R2 values in this multiple regression model. As far as the adjusted R2 values are concerned, the highest value was .114 (r=.359), which was obtained from the simple regression model using premolars (Figure 1). In the logistic regression analysis, Cox and Snell’s R2CS and Nagelkerke’s R2N were used as an analogue to the R2 value. The highest value (R2N =.250) was obtained from the incisor-related model (Table 3).
| Indicator* | Female | Male | Both sexes | ||||||||
|---|---|---|---|---|---|---|---|---|---|---|---|
| Multifactorial summary age (Lovejoy et al. [37]) | 0.79 | 0.9 | 0.85 | ||||||||
| Pubic symphysis (Todd [38])1 | 0.85 | ||||||||||
| Auricular surface (Meindl et al. [39]) | 0.72 | ||||||||||
| Pubic symphysis (McKern and Stewart [40])1 | 0.72 | ||||||||||
| Dental wear (Lovejoy [8]) | 0.7 | ||||||||||
| Pubic symphysis (McKern and Stewart [41])2 | 0.68 | 0.37 | 0.36 | ||||||||
| Pubic symphysis (Todd [42])2 | 0.64 | 0.57 | 0.57 | ||||||||
| Ectocranial sutures (Meindl and Lovejoy [43])3 | 0.34 | 0.59 | 0.56 | ||||||||
| Femur (Acsádi and Nemeskéri [44]) | 0.58 | 0.56 | |||||||||
| Ectocranial sutures (Meindl and Lovejoy [43]) | .57 (L), .50 (V)** | ||||||||||
| Endocranial sutures (Acsádi and Nemeskéri [44]) | 0.35 | 0.51 | |||||||||
| Pubic symphysis (Acsádi and Nemeskéri [44]) | 0.49 | 0.47 | |||||||||
| Humerus (Acsádi and Nemeskéri [44]) | 0.34 | 0.44 | |||||||||
| Present study | 0.41 | ||||||||||
| 1 cited from Katz and Suchey [45]. | |||||||||||
| 2 cited from Meindl et al. [39]. | |||||||||||
| 3 cited from Kemkes-Grottenthaler [46] | |||||||||||
| * re-cited from Kemkes-Grottenthaler [3]; | |||||||||||
| ** L: lateral-anterior sutures, V: vault sutures |
Acknowledgement
At first, I express my gratitude to Forensic Anthropology Center, University of Tennessee, Knoxville for allowing my access to the William M. Bass Donated Collection. Also, I am sincerely grateful to anonymous reviewers. Lastly, I thank D Doksoon Lee for all the support for me to keep going forward.
References
-
Willems G, Moulin-Romsee C, Solheim T (2002) Non- destructive dental age calculation methods in adults: Intra-and inter- observer effects. Forensic Sci Int 126(3): 221-226.
-
Stavrianos CH, Mastagas D, Stavrianou L, Karaiskou O (2008) Dental age estimation of adults: a review of methods and principles. Research Journal of Medical Sciences 2(5): 258-268.
-
Kemkes-Grottenthaler A (2002) Aging though the ages: historical perspective on age indicator methods. In: Hoppa RD, Vaupel JW (Eds.), Paleodemography: age distributions from skeletal samples. Cambridge university press.
-
Brothwell DR (1981) Digging up bones (3rd edn). Cornell university press.
-
Miles AEW (1963) Dentition and the estimation of age. Journal of dental research 42: 255-263.
-
Molnar S (1971) Human tooth wear, tooth function, and cultural variability. Am J Phys Anthropol 34(2): 175-190.
-
Scott EC (1979) Dental wear scoring technique. American journal of physical anthropology 51(2): 213-218.
-
Lovejoy CO (1985) Dental wear in the Libben population: its functional pattern and role in the determination of adult skeletal age at death. American journal of physical anthropology 68(1): 47- 56.
-
Brothwell DR (1989) The relationship of tooth wear to aging. In: Iscan MY (ed.) Age markers in the human skeleton. Springfield, Illinois: CC Thomas.
-
Walker PL, Dean G, Shapiro P (1991) Estimating age from tooth wear in archaeological populations, ln: Kelley MA, Larsen CS (Eds.), Advances in dental anthropology. New York: Wiley-Liss, pp: 169-178.
-
Dreier FG (1994) Age at death estimates for the protohistoric Arikara using molar attrition rates: A new quantification method. International journal of osteoarchaeology 4(2): 137-147.
-
Mayhall JT, Kageyamu I (1997) A new, three- dimensional method for determining tooth wear. American journal of physical anthropology 103(4): 463-469.
-
Vass AA (2011) The elusive universal post-mortem interval formula. Forensic Sci Int 204(1-3): 34-40.
-
Mays S (2002) The relationship between molar wear and age in an early 19th century AD archaeological human skeletal series of documented age at death. Journal of archaeological science 29(8): 861-871.
-
Yun JI, Lee JY, Chung JW, Kho HS, Kim YK (2007) Age estimation of Korean adults by occlusal tooth wear. Journal of forensic sciences 52(3): 678-683.
-
Jeong KH, Kim HK, Yoon CL, Lee SJ, Ha SY (2008) Age estimation of mummies by dental attrition: application of three-dimensional CT images. The Korean journal of pathology 42(5): 299-305.
-
Gustafson G (1950) Age determination on teeth. Journal of American dental association 41(1): 45-54.
-
Dalitz GD (1962) Age determination of adult human remains by teeth examination. Journal of Forensic Science Society 3(1): 11-21.
-
Johanson G (1971) Age determination from human teeth. Odontologisk Revy 22(21): 1-126.
-
Solheim T (1993) A new method for dental age estimation in adults. Forensic Sci Int 59(2): 137-147.
-
Vystrcilova M, Novotny V (2000) Estimation of age at death using teeth. Variability and evolution 8: 39-49.
-
Rai B, Dhattarwal SK, Anand SC (2005) Five markers of changes in teeth: an estimating of age. The Internet Journal of Forensic Science 1(2).
-
Rathbun TA, Buikstra JE (1984) Human identification: case study in forensic anthropology. Charles C Thomas.
-
Rhine S (1998) Bone voyage: a journey in forensic anthropology. University of New Mexico Press.
-
Byers SM (2005) Introduction to forensic anthropology (2nd edn), Pearson Education.
-
Adams BJ (2007) Forensic anthropology. Chelsea house publishers.
-
Pickering R, Bachman D (2009) The use of forensic anthropology. CRC press.
-
Hunter J, Roberts C, Martin A (1996) Studies in crime: an introduction to forensic anthropololgy. BT Batsford Ltd.
-
Hillson S (2005) Teeth (2nd edition), Cambridge.
-
Smith BH (1984) Patterns of molar wear in hunter- gatherers and agriculturalists. American journal of physical anthropology 63(1): 39-56.
-
Hrdlicka A (1939) Practical anthropometry (2nd edition) The Wistar institute of anatomy and biology, Philadelphia.
-
Bartlett DW, Fares J, Shirodaria S, Chiu K, Ahmad N, et al. (2011) The association of tooth wear, diet and dietary habits in adults aged 18-30 years old. J Dent 39(12): 811-816.
-
Kaidonis JA, Ranjitkar S, Lekkas D, Townsend GC (2012) An anthropological perspective: another dimension to modern dental wear concepts. International Journal of Dentistry.
-
Field A (2009) Discovering statistics using SPSS (3rd edition) Sage.
-
Lucy D, Aykroyd RG, Pollard AM, Solheim T (1996) A Bayesian approach to adult human age estimation from dental observations by Johanson’s age changes. J Forensic Sci 41(2): 189-194.
-
Prince DA, Kimmerle EH, Konigsberg LW (2008) A Bayesian approach to estimate skeletal age-at-death utilizing dental wear. J Forensic Sci 53(3): 588-593.
-
Lovejoy CO, Meindl RS, Mensforth RP, Barton TJ (1985) Multifactorial age determination of skeletal age at death: a method and blind tests of its accuracy. Am J Phys Anthropol 68(1): 1-14.
-
Todd TW (1920) Age changes in the pubic bones. I. The male white pubis. American Journal of Physical Anthropology 3(3): 285-334.
-
Meindl RS, Lovejoy CO, Mensforth RP, Walker RA (1985) A revised method of age determination using the os pubis, with a review and tests of accuracy of other current methods of pubic symphyseal aging. Am J Phys Anthropol 68(1): 29-45.
-
McKern TW, Stewart TD (1958) Skeletal age changes in young American males. Analyzed from the skeletal standpoint of age identification. Technical report EP- 45; Natick, MA: US Army Quartemaster Research and Development Center.
-
McKern TW, Stewart TD (1956) The symphyseal formula: a new method for determining age from pubic symphyses. American Journal of Physical Anthropology 14(2): 388.
-
Todd TW (1921) Age changes in the pubic bones. II. The pubis of the male Negro-white hybrid. III. The pubis of the white female. IV. The pubis of the female Negro-white hybrid. American Journal of Physical Anthropology 4: 4-70.
-
Meindl RS, Lovejoy CO (1985) Ectocranial suture closure: A revised method for the determination of skeletal age at death based on the lateral-anterior sutures. Am J Phys Anthropol 68(1): 57-66.
-
Acsádi G, Nemeskéri J (1970) History of human life and mortality. Budapest: Akadémiai Kiadó.
-
Katz D, Suchey JM (1985) Age determination of the male os pubis. American Journal of Physical Anthropology 69(4): 427-435.
-
Kemkes-Grottenthaler A (1996) Sterbealterbestimmung Anhand des ektokranialen Nahtverschlusses: Eine Evaluierung der Meindl- Lovejoy-Methode. Rechtsmedizin 6: 177-184.
-
Bocquet-Appel JP, Masset C (1982) Farewell to paleodemography. Journal of human evolution 11: 321-333.
- Narcotics and Digital Forensics: Bridging Crimes in the Digital Age
- Ethics in Forensic Psychiatry: Principles, Dilemmas, and Human Rights
- Impact of Acute Stress on Attentional Orienting to Social Cues
- Head Injury and Intracranial Hemorrhage in Western Region of Libya
- A Forensic Study on Handedness: Examination of Handwriting Features in Right and Left Handed Writers
- Techniques for Latent Fingerprint Development Using Natural and Synthetic Powders: A Review