Determination of Δ9-Tetrahydrocannabinol and Cannabidiol by Voltammetry using Low-Cost Screen-Printed Electrodic Platforms: A Significant Potential for Application in Clinical and Forensic Fields
Cannabis sativa has been utilized for centuries due to its psychoactive and therapeutic effects resulting from the presence of cannabinoids, which are exclusively found in plants of the Cannabis genus. The methods currently used by law enforcement and pharmaceutical industries to detect and measure cannabinoids include colorimetric testing, as well as instrumental methods such as HPLC and GC-MS. The aim of this work is to create a new method that can overcome the limitations of existing methods. To achieve this goal, a voltammetric method was developed using CV and LSV techniques. The method used a 3D-printed electrodic platform that was chemically modified with carbon paste and silver ink. The developed electrode was successful in detecting and measuring the amounts of Δ9-THC and CBD. The analytical parameters and average concentrations obtained were similar to those of popular commercial electrodes such as the platinum disk electrode and SPPE. The values for the limits of detection (LOD) and quantification (LOQ) were in the range of μmol L-1. The developed method and electrode show promise for detecting and quantifying Δ9-THC and CBD. The method was compared to the GC-MS technique, yielding relative error values ranging from 2.27% to 18.66%. A miniaturized, portable, versatile, and cost-effective method was developed with significant potential for clinical and forensic applications.
Introduction
The Cannabis genus is part of the Cannabinaceae family. It consists of three main species: Cannabis sativa Linnaeus, Cannabis indica Lamarck, and Cannabis ruderalis Janisch. The main differences between them are in terms of size, leaf morphology, and the amount of psychoactive molecules they contain [1, 2, 3, 4].
Cannabis sativa L is the most commonly found species of cannabis in the West [1], and it is popularly known as marijuana [5, 6]. For centuries, humanity has used this plant for various purposes, such as food, religious rituals, and medicinal practices [6]. C. sativa L. contains chemically active compounds such as cannabinoids, terpenoids, flavonoids, and alkaloids. Cannabinoids are terpenophenolic compounds that are found exclusively in the Cannabis plant. So far, over 100 cannabinoids have been identified [3], with some of the best-known being Δ9-tetrahydrocannabinol (Δ9-THC) and cannabidiol (CBD).
Δ9-THC is a powerful psychoactive compound [5, 7] that interacts with the endocannabinoid system (ECS). The ECS is a neuromodulatory system that plays important roles in the central nervous system (CNS), regulating physiological functions and peripheral organs [8]. When used recreationally, Δ9-THC can cause various subjective effects in humans, such as euphoria, dysphoria, sedation, changes in perception of time, changes in sensory functions, impaired motor control, as well as neurovegetative effects such as dry mouth, tachycardia, and postural hypotension [9, 10].
CBD is the main non-psychoactive compound found in C. sativa L [11]. Studies have shown that CBD has high levels of antioxidant and anti-inflammatory activity, as well as neuroprotective, antimicrobial, anxiolytic, and anticonvulsant properties. These biological properties make the fiber extracts of C. sativa L. a promising candidate for use in pharmaceutical and nutraceutical products [12].
According to the World Drug Report 2023 published by the United Nations Office on Drugs and Crime (UNODC), marijuana is the most widely used drug globally, with approximately 219 million users (4.3% of the global adult population) in 2021 [13]. Additionally, cannabis has been linked to various therapeutic applications, including the relief of symptoms associated with cancer, AIDS, multiple sclerosis, Tourette’s syndrome [4, 6, 14], and other conditions. Therefore, it is increasingly important to regulate the use of these substances.
Detection methods for cannabinoids are commonly done using instrumental methods, such as HPLC and GC- MS, and colorimetric techniques. However, colorimetric methods have low selectivity, while instrumental methods are expensive, have high operating costs, have long analysis times (4 to 8 analyses per hour), require several stages of prior sample treatment, and cannot be used in fieldwork [15]. Hence, electrochemical techniques are a viable alternative for detecting and measuring these substances.
Electrochemical sensors are a highly promising type of chemical sensors that offer a high level of selectivity and sensitivity. They are particularly useful for determining the concentrations of different analytes in fluids and dissolved solid materials [16]. Compared to other sensor types, electrochemical sensors are especially appealing due to their high detectability, simplicity, and low cost [17].
Voltammetry is one of the most widely used electroanalytical techniques that involve measuring electric current (i) while applying a linear variation of potential (E). This process is performed in an electrochemical cell with three electrodes: a working, a reference, and an auxiliary electrode. The equipment used for this analysis is called a potentiostat. Its main function is to apply the linear variation of electric potential to the electrochemical cell and measure the current values. Based on the difference of potential applied between the working and auxiliary electrodes, monitored by a reference electrode, the potentiostat provides the electrochemical profile of the substance through a voltammogram. By analyzing the peak potential (Ep), half- wave potential (Ep/2), and peak current (ip), it is possible to identify and quantify the analyte [18].
This study was conducted to develop a low-cost electrochemical sensor for the voltammetric analysis of Δ9- THC and CBD in cannabis samples. The objective of this work was to create a simple, versatile, miniaturized, portable, and economically viable method that could have significant potential for clinical and forensic applications.
Experimental
Reagents and solutions
Ethyl acetate and boric acid were purchased from Merck. Absolute ethanol and methanol HPLC grade were bought from Reidel-de-Haёn. Hexane, graphite powder and silver paint were acquired from Sigma-Aldrich. Acetic acid UV/ HPLC grade – Spectroscopic from Vetec, phosphoric acid 85% from EMSURE, sodium hydroxide from Êxodo científica, chloroform from Qhemis, and mineral oil 100% from União Química were also used in this study. All the reagents used were of analytical grade of purity. Deionized water was used as solvent in the preparation of all the solutions.
A Britton-Robinson (BR) buffer solution (0.1 mol L-1) in pH 7.0 was prepared by mixing 100.0 mL of acetic acid (0.1 mol L-1), 100.0 mL of phosphoric acid (0.1 mol L-1), and 100.0 mL of boric acid (0.1 mol L-1). A NaOH solution (1.0 mol L-1) was used to adjust the pH to 7.0. This solution was mixed with methanol in a 7:3 (v/v) ratio, and the resulting solution was used as the supporting electrolyte in the voltammetric analyses.
The standard solutions of Δ9-tetrahydrocannabinol and cannabidiol were prepared by diluting methanolic commercial standard solutions (3.2 10-3 mol L-1) of these analytes provided by AccuStandard®, resulting in a concentration of 6.4 10-5 mol L-1. For the analytical curves, successive volumes of standard solutions of Δ9- THC and CBD at 6.4x10⁻⁵ mol L-1 were added to a known volume of supporting electrolyte solution until the desired concentration was achieved. The volume changes were taken into account in the determination of final concentrations of both analytes.
The extracts from marijuana samples were obtained from seized samples provided by the Toxicological Examination Center of the Institute of Criminalistics - Criminalistics Forensic Center of Ribeirão Preto-SP, Brazil. Initially, a methanolic solution of sample was prepared by immersing 300.0 g of sample into 2.1 L of methanol solvent. Subsequently, an ethanolic solution of sample was prepared by immersing 300.0 g sample into 2.3 L of ethanol solvent. The addition of both solvents was done uniformly over the surface of the samples. The obtained extracts were filtered using a funnel and filter paper, being stored in glass bottles. This extraction was carried out to obtain stock solutions to serve all the other research lines in the laboratory.
Equipment
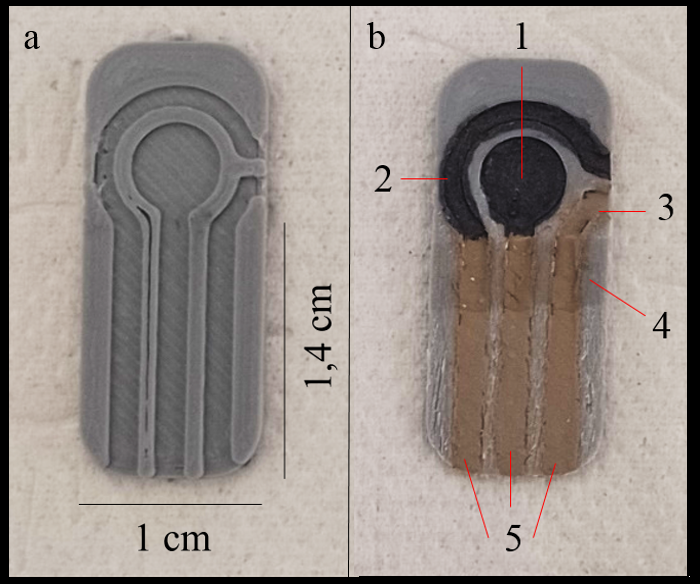
The design of the developed electrode was created using the Inventor software (Autodesk) and printed using a GTMax printer (model A1, with 0.45 mm extruder diameter) at a temperature of 190° C with acrylonitrile butadiene styrene (ABS) filament (Figure 1a). A carbon paste was prepared by mixing 22.5 g of graphite powder with 7.5 g of mineral oil. This mixture was homogenized by magnetic stirring in a beaker containing 100 mL of chloroform. The paste was obtained after evaporating the solvent until the obtainment of a desired consistency. Posteriorly, this paste was used to fill the working and auxiliary electrodes (Figure 1b). The reference electrode and the electric connectors of the three electrodes were filled with silver paint (Figure 1b). Finally, a hydrophobic barrier was applied with a layer of transparent enamel just below the electrodes (Figure 1b).
In addition to the developed electrode platform, commercial electrodes were also used to compare results. A conventional three-electrode system consisting of a working electrode, a reference electrode, and an auxiliary electrode was also tested for comparison: a platinum disk working electrode (3.00 mm diameter - Metrohm), an Ag/AgCl.KCl (sat) reference electrode (Metrohm - 6.0726.100) and a platinum wire auxiliary electrode were used. In addition, a commercial screen-printed platinum electrode (SPPE) (4.00 mm diameter - DS 550, DropSens) was also used for comparison of the voltammetric results. A PG581 portable potentiostat (Uniscan) with UiEChem software version 3.44 was employed in all voltammetric measurements.
For the characterization and quantification of Δ9-THC and CBD in marijuana samples, a gas chromatograph (Shimadzu - GC-2010 Plus) coupled to a mass spectrometer (Shimadzu - GCMS-QP2010 SE) using GCMS Solution software version 4.41 was used. The column used for the measurements was an OPTIMA 35 MS (35% phenyl and 65% methylpolysiloxane - Macherey-Nagel) with an inner diameter of 0.25 mm, a layer thickness of 0.25 µm and a length of 30.0 m. Helium was used as carrier gas with a purity of 5.0 and the injection volume was 1.00 µL.
Other equipment such as analytical balance (Mettler Toledo AB204), pH meter (Labmeter PHS-3B), and automatic micropipettes (Labmate) from 10 to 100 µL and 100 to 1000 µL were used in the preparation of carbon paste, standard solutions, and supporting electrolyte.
Experimental Procedure
The cyclic voltammetry (CV) modality was used to analyze the voltammetric profile of Δ9-THC and CBD using the 3D-printed electrodic platform modified with carbon paste (CP-SPE). The potential range was set from -0.3 to 1.0 V (vs. Ag/AgCl), the scan rate was 100 mV s-1, and a preconcentration time of 30 s was fixed at -0.3 V. The construction of the analytical curve was provided using the linear sweep voltammetry (LSV) modality with the same analytical conditions used in the CV modality.
The extracts obtained from the marijuana samples were analyzed by GC-MS and subsequently purified by thin- layer chromatography (TLC) using silica gel plates as the stationary phase and a mixture of hexane, ethyl acetate, and methanol (7:2:1, v/v/v) as the mobile phase. After conducting the experiments with thin layer chromatography, the chromatographic plates were revealed by spraying the Fast Blue B salt cannabinoid developer solution. Analytical parameters such as limit of detection (LOD) and limit of quantitation (LOQ) were analyzed and compared with values obtained for two other commercial electrode sets: the conventional three-electrode system and a screen- printed platinum electrode. Validation of the results was also performed using gas chromatography-mass spectrometry (GC-MS).
Results and Discussion
Analysis of Δ9-THC and CBD by Cyclic Voltammetry
The analysis of Δ9-THC and CBD by cyclic voltammetry (CV) allows the study of the electrochemical profile of these substances. Cyclic voltammograms for these analytes have been previously described in the literature [5, 19, 20, 21, 22]. The expected voltammetric profile for Δ9-THC includes the presence of an anodic peak current (iap) around 0.00 to 0.55 V and no recorded cathodic peak current (icp), indicating an irreversible oxidative process. The iap observed in the voltammetric analysis of Δ9-THC corresponds to the electro- oxidation process of the phenolic group present in the molecule, which involves one electron [20].
CBD has a molecular structure similar to that of Δ9- THC (Figure 2). Previous articles reported in the literature indicate that the voltammetric profile of CBD is similar to that of Δ9-THC, also exhibiting an anodic peak current (iap) in the same potential range and the absence of a cathodic peak current (icp). The most widely accepted explanation is that CBD undergoes the same electro-oxidation reaction of the phenolic group present in this molecule [13].
![Figure 2: Molecular Structures of Δ9-THC and CBD (Adapted From [19, 22]).](/fulltextimages/11942/fig_2.png)
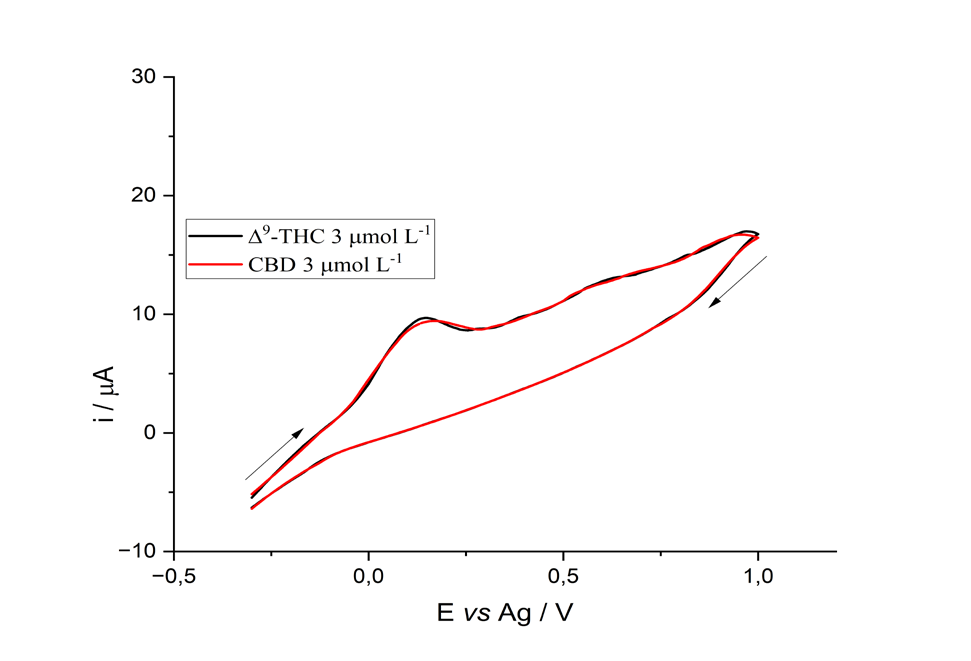
CP-SPE cyclic voltammograms for Δ9-THC and CBD showed the expected electrochemical profiles for these compounds. An anodic peak current (iap) was observed in the potential range described in the literature, with Eap for Δ9-THC at 0.15 V and for CBD at 0.17 V (Figure 3). No cathodic peak current (icp) was recorded for this analyte, which is in good accordance with the literature.
Analytical Curve by Linear Sweep Voltammetry
Figures 4a & 4b show the linear sweep voltammograms after successive additions of Δ9-THC standard (6.4 10-5 mol L-1) and CBD standard (6.4 10-5 mol L-1) to the supporting
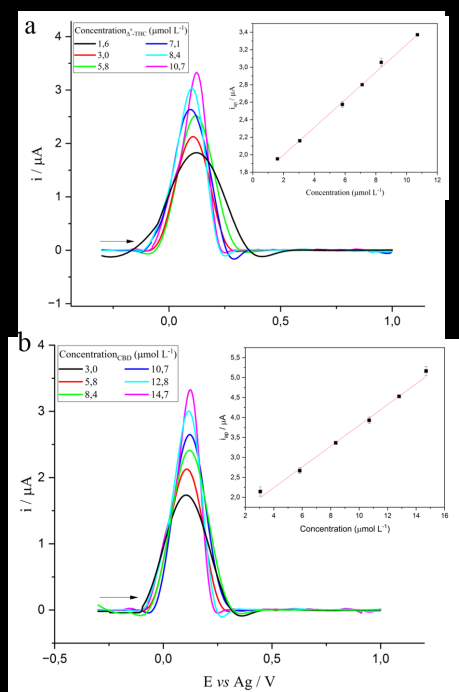
Figure 4: Linear Sweep Voltammograms, after Baseline Normalization, Related to Successive Additions of Δ9-THC Standard (6.4 × 10⁻⁵ mol L-1) (A) And CBD (6.4 × 10⁻⁵ mol L-1); (B) In the Support Electrolyte (BR Buffer) 0.1 mol L-1, pH 7.0, Containing 30% Methanol, Using CP-SPE; Scan Rate of 100 mV S-1, And Pre-Concentration for 30 s at -0.3 V, Along with their Respective Analytical Curves.
The analytical parameters obtained in this study are reported in Table 1, which includes the linear dependence equation, Pearson’s correlation coefficient (r), standard deviation (SD), limit of detection (LOD), and limit of electrolyte solution, respectively, along with their respective analytical curves obtained with CP-SPE. An increase in peak current was observed with increasing concentrations of Δ9- THC and CBD.
quantification (LOQ). The comparison between all analytical curves can be observed, including the CP-SPE, the commercial platinum disk, and the SPPE electrodes.
| Δ9-THC | CBD | |||||
|---|---|---|---|---|---|---|
| Platinum disk | SPPE | CP-SPE | Platinum disk | SPPE | CP-SPE | |
| Linear equation | i = 3.13 C + 3.26 10-6 | i = 4.14 C + 2.08 10-5 | i = 0.16 C + 1.68 10-5 | i = 2.78 C + 1.01 10-5 | i = 3.38 C + 2.78 10-5 | i = 0.13 C + 1.38 10-6 |
| r | 0.996 | 0.995 | 0.998 | 0.995 | 0.997 | 0.997 |
| SD (10-7) | 7.5 | 14.3 | 0.28 | 10.7 | 11.6 | 0.51 |
| DL (µmol L-1) | 0.72 | 1.04 | 0.53 | 1.15 | 1.03 | 1.19 |
| QL (µmol L-1) | 2.4 | 3.45 | 1.75 | 3.84 | 3.43 | 3.95 |
Table 1: Analytical Parameters were Obtained through Linear Sweep Voltammetry using CP-SPE, Platinum Disk, and SPPE Electrodes fo
A good linear correlation was obtained for all the electrodes, as the Pearson’s correlation coefficient was very close to 1 for all of them. Regarding the values of LOD and LOQ for Δ9-THC, the SPPE showed the highest values for both parameters, while the CP-SPE obtained the lowest values, demonstrating its promising and competitive performance compared to other electrodes already commercially established for the detection and quantification of Δ9-THC. As for the LOD and LOQ values for CBD, the CP-SPE presented the highest values for both parameters, while the SPPE presented the lowest values. However, the LOD and LOQ values remained very close, indicating that the CP-SPE is also a promising and competitive electrode for CBD detection and quantification, comparable to other commercially established electrodes.
Analysis of Extracts of Marijuana Samples by GC-MS
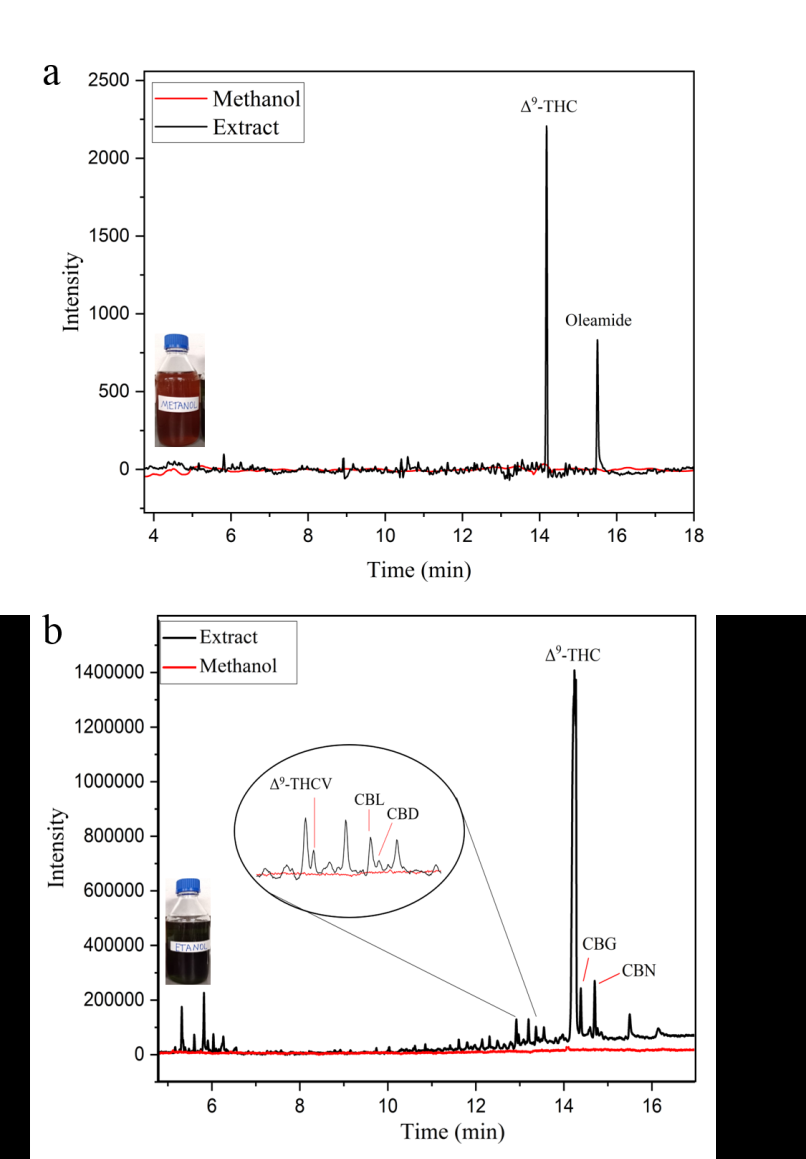
The seized marijuana samples were extracted with two different solvents as described before: methanol and ethanol. In the chromatograms corresponding to the extracts obtained in both solvents (Figure 5), it was observed that the use of methanol resulted in an extract containing mainly the cannabinoid Δ9-THC with a retention time of 14.25 minutes (Figure 5a). In the extract obtained with ethanol, the presence of five other cannabinoids besides Δ9-THC was observed: Δ9-tetrahydrocannabivarin (Δ9-THCV), cannabicyclol (CBL), cannabidiol (CBD), cannabigerol (CBG), and cannabinol (CBN). Δ9-THC was found with a retention time of 14.25 minutes and CBD with a retention time of 13.43 minutes (Figure 5b).
Determination and Quantification of Cannabis Samples
For the detection and quantification of Δ9-THC, the extract of the marijuana sample obtained in methanol was chosen (Figure 5a), which significantly eliminates the potential interference of other cannabinoids in the electro active signal. For the detection and quantification of CBD, the extract obtained in ethanol was chosen because it also allowed the extraction of this analyte. However, since this extract contains the presence of several other cannabinoids besides CBD (Figure 5b), a prior purification of the extract using thin-layer chromatography (TLC), as described above, was necessary for the separation of the cannabinoids.
After the thin layer chromatographic run followed by the revelation with Fast Blue B Salt, it was possible to calculate the Rf values for the CBD and Δ9-THC standards, with values of 0.982 and 0.991, respectively.
The Rf values found for the analyzed extract were 0.991, 0.982, and 0.885. By comparing the Rf values, it was possible to separate CBD from other cannabinoids present in the extract, as the Rf value for the CBD standard (0.982) coincided with one of the values found in the extract. Furthermore, at this Rf value, the characteristic orange color was observed, indicating the reaction coupling with cannabidiol.
The silica area where CBD was found was scraped and treated with 50.0 mL of ethanol. The TLC analysis was repeated to confirm the presence of CBD and the results showed consistent Rf values. After purification of the CBD solution, it and the extract obtained in methanol were analyzed by linear sweep voltammetry (LSV) for quantification by CP-SPE. The concentration values obtained for the samples with CP-SPE, platinum disk, and SPPE electrodes are presented in Table 2.
| CΔ9-THC (10-5 mol L-1) | CΔ9-THC (mg g-1) | CCBD (10-5 mol L-1) | CCBD (mg g-1) | |
|---|---|---|---|---|
| Platinum disk | 2.545 ± 0.056 | 0.160 ± 0.004 | 1.733 ± 0,035 | 208.92 ± 4.262 |
| SPPE | 2.874 ± 0.155 | 0.180 ± 0.009 | 1.520 ± 0,004 | 183.21 ± 0.441 |
| CP-SPE | 2.855 ± 0.025 | 0.179 ± 0.016 | 1.505 ± 0,054 | 181.45 ± 6.573 |
Table 2: Values Obtained for the Concentration of Δ9-THC and CBD in the Extracts of Seized Marijuana Samples using the CP-SPE. Pl
To compare the results obtained with both electrodes, the Tukey test (Appendix 1) was used with a 95% confidence interval, which is performed by analysis of variance and provides confidence intervals that indicate the likely ranges for all differences in means. If this range does not include zero for a given comparison, they are significantly different. When analyzing the Tukey test, it was observed that the mean concentrations found for Δ9-THC were similar for all electrodes, while the mean concentrations found for CBD were similar in the comparison between CP-SPE and SPPE. These results confirm that the developed 3D-printed electrodic platform is promising for the quantification of Δ9-THC and CBD, as it gives similar results to commercially established electrodes.
Analyses by Gas Chromatography Coupled with Mass Spectrometry (GC-MS)
The extracts analyzed by LSV with different electrodes were further investigated by GC-MS to help in the validation of the developed voltammetric technique. For this purpose, standard solutions of Δ9-THC and CBD at different concentrations were analyzed. The values of Pearson’s correlation coefficient (r), the standard deviation of linear coefficient (SD), the limit of detection (LOD), the limit of quantification (LOQ), and the concentrations for Δ9-THC and CBD are presented in Table 3.
| Δ9-THC | CBD | |
|---|---|---|
| Line equation | I = 2.78 109 C + 5824 | I = 2.65 109 C - 4509 |
| r | 0.999 | 0.999 |
| SD | 2536 | 1851 |
| LOD (µmol L-1) | 2.8 | 2.1 |
| LOQ (µmol L-1) | 9.32 | 6.98 |
| C (10-5 mol L-1) | 2.406 ± 0.018 | 1.540 ± 0.011 |
| C (mg g-1) | 0.151 ± 0.001 | 185.77 ± 1.22 |
Table 3: Analytical Parameters Obtained through Gas Chromatography Coupled with Mass Spectrometry (GC-MS).
Analyzing the analytical parameters obtained by LSV (Table 2) and those obtained by GC-MS (Table 3), it is possible to observe that the LOD and LOQ values obtained by LSV are all lower than those obtained by GC-MS, indicating that the developed method has the potential to be applied using all the analyzed electrodic systems. Concerning the concentrations of Δ9-THC and CBD found in the extracts, the values of the relative errors (Re) of measurements by LSV for all electrodes with respect to measurements by GC- MS, calculated according to Equation 1, ranged from (1.30 ± 0.01)% to (19.45 ± 0.07)%. The smallest errors were found for the quantification of CBD by SPPE and CP-SPE, while the largest errors were found for the quantification of Δ9-THC by SPPE and CP-SPE.
| (LSV value) | −(GC−MS value) |
|---|
Conclusions
An alternative voltammetric method was developed for the analysis of Δ9-tetrahydrocannabinol (Δ9-THC) and cannabidiol (CBD) in marijuana samples. Detection of Δ9- THC and CBD was achieved by cyclic voltammetry using the developed 3D-printed electrodic platform modified with carbon paste (CP-SPE).
Quantification of these substances in marijuana extracts was also achievable using the developed electrode, with concentrations found at levels of 10-5 mol L-1. The validation of the method was carried out by obtaining appropriate coefficients of merit and comparing the results obtained with CP-SPE with those obtained with the two commercial electrode systems. Similar results were obtained, demonstrating the potential of CP-SPE in the quantification of Δ9-THC and CBD. The method was also compared with the GC-MS technique, where relative errors between (1.30 ± 0.01)% and (19.45 ± 0.07)% were obtained. The lowest errors were found for the quantification of CBD using SPPE and CP-SPE, while the highest errors were found for the quantification of Δ9-THC using SPPE and CP-SPE.
In conclusion, the developed electrodic platform proved to be promising for the detection and quantification of Δ9-THC and CBD at µmol L-1 levels. The development of a simple, versatile, miniaturized, portable, and inexpensive method was feasible, demonstrating significant potential for application in clinical and forensic fieldwork.
Conflicts of Interest
The corresponding author, in the name of all authors, declares that there is no conflict of interests in the proposed article.
Financial Support
The authors are thankful to CAPES (CAPES, PROCAD- SPCF – File number process 88887.613955/2021-00), FAPESP (File number 2022/12189-0), and CNPq (File number 302742/2022-0) for financial support.
References
-
Gloss D (2015) An Overview of Products and Bias in Research. Neurotherapeutics 12(4): 731-734.
-
Farag S, Kayser O (2017) The Cannabis Plant: Botanical Aspects. In: Preedy VR, Handbook of Cannabis and Related Pathologies: Biology, Pharmacology, Diagnosis, and Treatment, Academic Press, King’s College London, London, United Kingdom, pp: 3-12.
-
Bonini SA, Premoli M, Tambaro S, Kumar A, Maccarinelli G, et al. (2018) Cannabis sativa: A comprehensive ethnopharmacological review of a medicinal plant with a long history. J Ethnopharmacol 227: 300-315.
-
Alves JN, Da Silva YA, Michelin LFG (2022) Medicinal use of cannabis as a therapeutic adjuvant in antitumor pharmacology. Ânima University Repository (RUNA).
-
Hacke ACM, Lima D, De Costa F, Deshmukh K, Li N, et al. (2019) Probing the antioxidant activity of Δ9- tetrahydrocannabinol and cannabidiol in Cannabis sativa extracts. Analyst 144(16): 4952-4961.
-
Honório KM, Arroio A, da Silva ABF (2006) Therapeutic aspects of compounds from the Cannabis sativa plant. Chemical. Nova 29(2): 318-325.
-
Cirrincione M, Zanfrognini B, Pigani L, Protti M, Mercolini L, et al. (2021) Development of an electrochemical sensor based on carbon black for the detection of cannabidiol in vegetable extracts. Analyst 146(2): 612-619.
-
Lu HC, MacKie K (2016) An introduction to the endogenous cannabinoid system. Biol Psychiatry 79(7): 516-525.
-
Crippa JA, Lacerda ALT, Amaro E, Filho GB, Zuardi AW, et al. (2005) Brain effects of marijuana: results of neuroimaging studies. Braz J Psychiatry 27(1): 70-78.
-
Ashton CH (2001) Pharmacology and effects of cannabis: A brief review. British Journal of Psychiatry 178: 101- 106.
-
Britch SC, Babalonis S, Walsh SL (2021) Cannabidiol: pharmacology and therapeutic targets. Psychopharmacology 238(1): 9-28.
-
Protti M, Brighenti V, Battaglia MR, Anceschi L, Pellati F, et al. (2019) Cannabinoids from Cannabis sativa L.: A New Tool Based on HPLC-DAD-MS/MS for a Rational Use in Medicinal Chemistry. ACS Med Chem Lett 10(4): 539- 544.
-
United Nations Office On Drugs And Crime (UNODC) (2023) World Drug Report: Executive Summary.
-
Baker D, Pryce G, Giovannoni G, Thompson AJ (2003) The therapeutic potential of cannabis. Lancet Neurol 2(5): 291-298.
-
Kostic M, Pejic B, Skundric P (2008) Quality of chemically modified hemp fibers. Bioresour Technol 99(1): 94-99.
-
Saleh Ahammad AJ, Lee JJ, Rahman MA (2009) Electrochemical sensors based on carbon nanotubes. Sensors 9(4): 2289-2319.
-
Stradiotto NR, Yamanaka H, Zanoni MVB (2003) Electrochemical Sensors: A Powerful Tool in Analytical Chemistry. J Braz Chem Soc 14(2): 159-173.
-
Stradiotto NR, Yamanaka H, Zanoni MVB, Sotomayor MDPT (2021) Electroanalytical Methods: Concepts, Experiments and Applications. Academic Culture pp: 1-272.
-
Novak I, Mlakar M, Lovric KS (2013) Voltammetry of immobilized particles of cannabinoids. Electroanalysis 25(12): 2631-2636.
-
Balbino MA, De Menezes MMT, Eleotério IC, Saczk AA, Okumura LL, et al. (2012) Voltammetric determination of Δ9-THC in glassy carbon electrode: An important contribution to forensic electroanalysis. Forensic Sci Int 221(1-3): 29-32.
-
Balbino MA, Oiye EN, Ribeiro MFM, Júnior JWC, Eleoterio IC, et al. (2016) Use of screen-printed electrodes for quantification of cocaine and Δ9-THC: adaptions to portable systems for forensic purposes. J Solid State Electrochem 20(9): 2435-2443.
-
Balbino MA, Eleoterio IC, De Oliveira LS, De Menezes MMT, De Andrade JF, et al. (2014) A comparative study between two different conventional working electrodes for detection of Δ9-tetrahydrocannabinol using square- wave voltammetry: a new sensitive method for forensic analysis. J Braz Chem Soc 25(3): 589-596.
- Narcotics and Digital Forensics: Bridging Crimes in the Digital Age
- Ethics in Forensic Psychiatry: Principles, Dilemmas, and Human Rights
- Impact of Acute Stress on Attentional Orienting to Social Cues
- Head Injury and Intracranial Hemorrhage in Western Region of Libya
- A Forensic Study on Handedness: Examination of Handwriting Features in Right and Left Handed Writers
- Techniques for Latent Fingerprint Development Using Natural and Synthetic Powders: A Review