Forensic Gait Analysis: Exploring Foot Placement Dynamics in Athletes and Non-Athletes
This study investigates the dynamics of foot placement as a forensic tool for identifying individuals in various scenarios, focusing on the differences between athletes and non-athletes. Analyzing the unique characteristics of foot placement patterns, we examine how factors such as gait, pressure distribution, and stride length vary between these two groups. Collected data from a sample of professional athletes across different sports and a control group of non-athletes. Findings reveal that athletes exhibit distinct foot placement dynamics characterized by more consistent and efficient gait patterns, marked by variations in pressure distribution and stride mechanics. These insights highlight the potential for utilizing foot placement dynamics in forensic contexts to enhance the accuracy of individual identification and scene reconstruction. This study emphasizes the importance of considering physical conditioning and activity levels in forensic analysis.
Introduction
The recognition of individuals by their physiological or behavioral characteristics is known as biometrics [1]. Biometrics has been utilized for personal identification since ancient times, starting with hunters and gatherers identifying animal and human movements. Over time, this evolved into a refined art for recognizing individuals. Among these characteristics, foot placement and walking style are unique to each person. For some, such as military personnel, training can further influence these traits. Several biometric techniques are used for identification, including iris scans, fingerprint analysis, voice recognition, and facial recognition. Similarly, the application of gait as a method for individualization has been observed and refined over time [2, 3]. Gait is a behavioural biometric that can be observed from a distance, making it advantageous as it does not require direct contact or cooperation from the subject [4, 5]. Human gait can vary due to factors such as body changes (e.g., height, weight), injuries, illnesses, base of support, and friction between the foot and the ground, as well as biological aspects [2, 6, 7, 8]. Despite these variations, studies confirm that gait remains a reliable identifier. It is influenced by complex factors, including skeletal structure, muscle activity, body weight, limb lengths, and bone structures [9, 10]. This complexity makes it extremely difficult to imitate or disguise.
Gait recognition identifies individuals based on their unique walking patterns. It works on the premise that an individual’s walking style is distinctive, and this uniqueness can be leveraged for identification [11, 12].
Gait analysis holds significant forensic potential. Its ability to identify individuals without requiring physical interaction is especially valuable in criminal investigations and instance of conviction based on gait of criminal [13, 14, 15]. Some of the important areas are: Criminal Identification: Gait recognition can identify suspects captured in surveillance footage by analysing their walking patterns, even in low-resolution videos [16]. Behavioural Analysis: The study of gait can reveal signs of injuries, ailments, or intoxication, providing contextual evidence in criminal cases [17]. Cold Cases: Forensic gait analysis can assist in reevaluating old evidence, potentially identifying individuals through gait in previously overlooked footage [18].
By combining gait analysis with other biometric methods, forensic experts can strengthen evidence in court and enhance the accuracy of criminal investigations [19, 20].
Visual Gait Analysis
It is interesting to say that the simplest form of gait examination is made by the unaided human eye. This, of course, disregards the extraordinary abilities of the human brain to process the data received by the eye. Visual gait analysis, in reality, the most complex and multipurpose form of analysis available[21, 22].
Despite this, it grieves from four serious limitations[23]: • It is temporary, it has no permanent record.
- The eye cannot perceive high-speed actions.
- It is only possible to see actions, not force.
- It depends entirely on the skill of the individual observer.
For visual gait analysis, as little as 3mtr may be enough and same has been followed in the study but, for further higher-level study the video camera with automatic trolley can be used for recording gait [24].
Materials & Methods
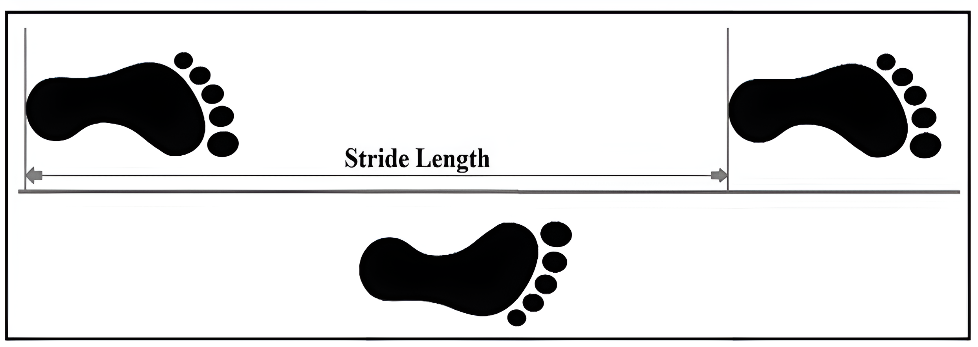
The present study is a comparative study which is conducted in the small gait laboratory, the samples for the study were chosen from Arts, Science and Physical Education studying students from University of Mysore, Mysuru. With a sample size of 25 each i.e., athlete and non-athletes. Where the samples were asked to provide their Foot prints by dipping their foot in the tray containing coloured liquid and asked the samples to walk normally on a drawing sheet laid in the small gait laboratory and later the measurements were calculated. The collected data was analysed using paired sample t Test using SPSS.
Results
| Paired Samples Statistics | |||||||||
|---|---|---|---|---|---|---|---|---|---|
| Mean | N | Std. Deviation | Std. Error Mean | ||||||
| Athlete | 111.73 | 50 | 17.98191 | 2.54303 | |||||
| Nonathlete | 100.17 | 50 | 24.34271 | 3.44258 | |||||
| Paired Samples ‘t’ Test | |||||||||
| Mean | Paired Differences | t | df | Sig. (2-tailed) | |||||
| Std. Deviation | Std. Error Mean | 95% Confidence Interval of the Difference | |||||||
| Lower | Upper | ||||||||
| Athlete - Nonathlete | 11.56 | 26.2905 | 3.71804 | 4.08832 | 19.03168 | 3.109 | 49 | 0.003 |
Table 1: Paired sample statistics for stride length.
From the above table, it is evident that the scores of athletes and nonathletes indicate a significant relationship, as the p-value (0.003) is less than the conventional threshold of 0.05. This demonstrates that the difference between the mean scores of athletes and nonathletes is statistically significant, suggesting that the performance scores of athletes are notably higher than those of nonathletes. The 95% confidence interval (4.09 to 19.03) does not include zero, further reinforcing the conclusion of a significant difference. The mean difference of 11.56 indicates that, on average, athletes outperform nonathletes by this amount in the measured variable.
| Paired Samples Statistics | ||||||||
|---|---|---|---|---|---|---|---|---|
| Mean | N | Std. Deviation | Std. Error Mean | |||||
| Athlete | 104.31 | 50 | 18.48631 | 2.61436 | ||||
| Nonathlete | 98.84 | 50 | 19.93982 | 2.81992 | ||||
| Paired Sample ‘t” Test | ||||||||
| Paired Differences | t | df | Sig. (2-tailed) | |||||
| Mean | Std. Deviation | Std. Error Mean | 95% Confidence Interval of the Difference | |||||
| Lower | Upper | |||||||
| Athlete & Nonathlete | 5.47 | 24.72407 | 3.49651 | 1.5565 | 12.4965 | 1.564 | 49 | 0.124 |
From the above table, it is evident that the scores of athletes and nonathletes suggest that the p-value (0.124) is greater than the conventional significance level of 0.05. This indicates that the observed difference in mean scores between athletes and nonathletes is not statistically significant, implying that the mean difference of 5.47 could be attributed to random variation rather than a true effect.
Additionally, the confidence interval for the mean difference (1.56 to 12.50) includes zero, further supporting the conclusion that the observed difference is not statistically significant. Although athletes have a higher mean score (104.31) compared to nonathletes (98.84), the lack of statistical significance suggests that no strong conclusions can be drawn about a meaningful difference in performance between the two groups based on this sample.
| Paired Samples Statistics | |||||
|---|---|---|---|---|---|
| Mean | N | Std. Deviation | Std. Error Mean | ||
| Athlete | 107.93 | 50 | 21.76076 | 3.07744 | |
| Nonathlete | 98.956 | 50 | 17.76919 | 2.51294 | |
| Paired Samples ‘t’ Test |
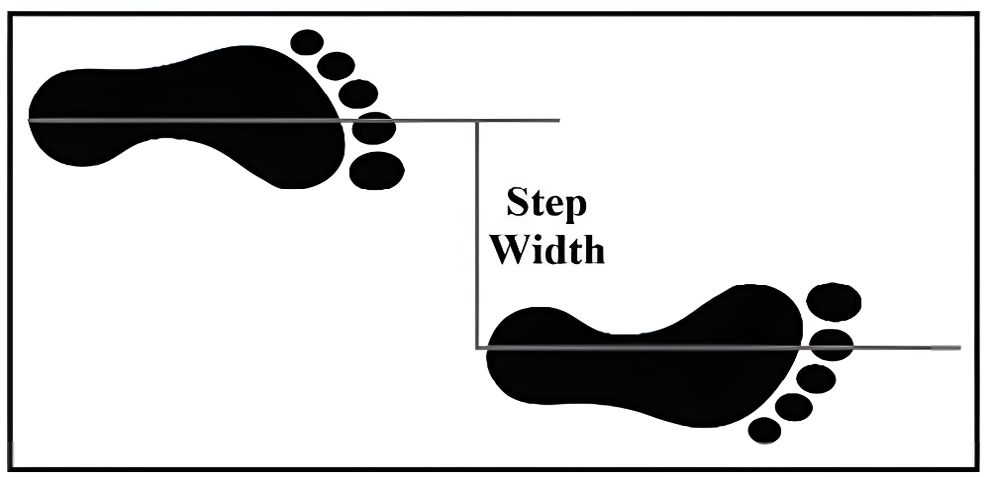
Table 3: Paired Sample Statistics for Step Width
- Paired Differences t df
- Sig.
- (2-tailed)
- Mean
- Std. Deviation
- Std. Error
- Mean
- Athlete &
- Nonathlete
- 8.974
- 20.16887
- 2.85231
- 3.24207
- 14.70593
- 3.146
- 49
- 0.003
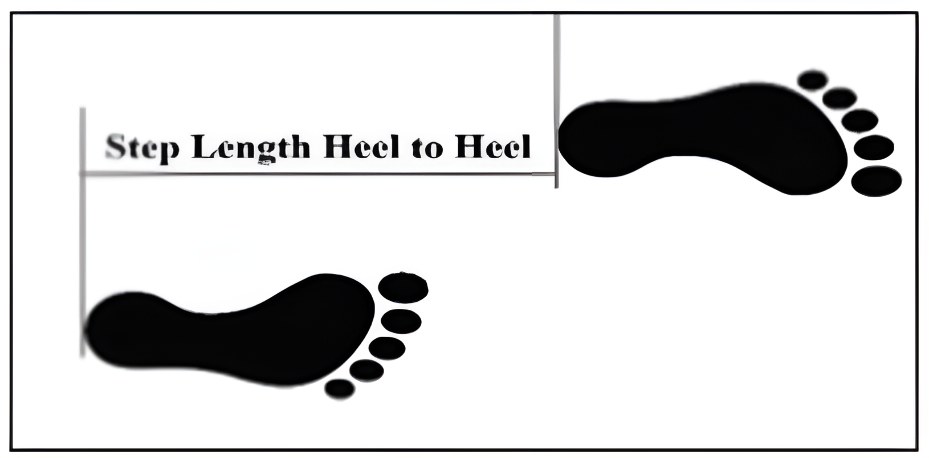
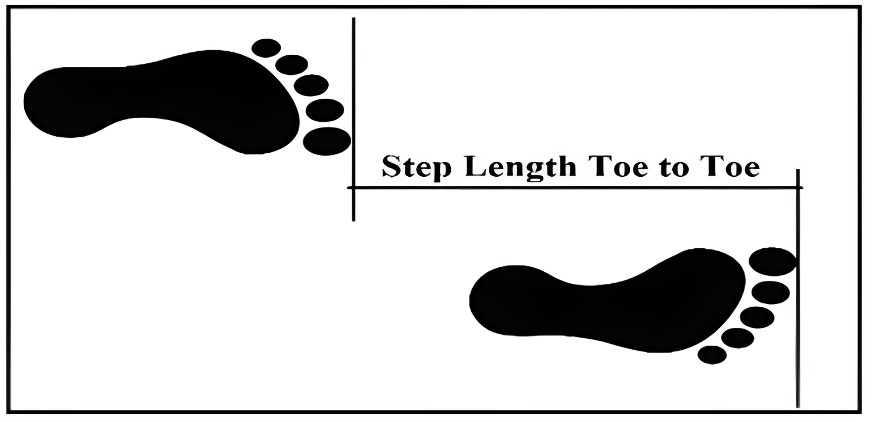
Table 4: Paired sample statistics for step length.
It is clear from the above table that the scores of athletes and nonathletes reveal a statistically significant difference, as the p-value (0.003) is less than the standard threshold of 0.05. This indicates a meaningful disparity in mean scores between the two groups, with athletes outperforming nonathletes on the measured variable with a high level of confidence.
The 95% confidence interval (3.24 to 14.71) does not include zero, reinforcing the conclusion that the difference in means is statistically significant. The t-statistic (3.146) reflects a moderate-to-strong effect, emphasizing the meaningfulness of the observed difference. On average, athletes scored 8.97 points higher than nonathletes.
This significant difference may be attributed to distinctive factors differentiating the two groups, such as the physical conditioning, discipline, or mental attributes commonly associated with athletic training. These attributes likely contribute to enhanced performance in the specific metric being analyzed.
| Paired Samples Statistics | ||||||||
|---|---|---|---|---|---|---|---|---|
| Mean | N | Std. Deviation | Std. Error Mean | |||||
| Athlete | 11.28 | 50 | 2.00296 | 0.28326 | ||||
| Nonathlete | 13.432 | 50 | 4.73896 | 0.67019 | ||||
| Paired Samples ‘t’ Test | ||||||||
| Paired Differences | t | df | Sig. (2-tailed) | |||||
| Mean | Std. Deviation | Std. Error Mean | 95% Confidence Interval of the Difference | |||||
| Lower | Upper | |||||||
| Athlete & Nonathlete | -2.152 | 4.76703 | 0.67416 | -3.50678 | -0.79722 | -3.192 | 49 | 0.002 |
Table 5: Paired Sample Statistics for Step Width
The table indicates the scores of athletes and nonathletes, with the p-value (0.002) falling below the standard significance threshold of 0.05. This demonstrates that the difference in means is statistically significant, suggesting a meaningful disparity between the two groups, where nonathletes exhibit a higher mean score.
The direction and magnitude of the difference are evident from the negative mean difference (-2.152), which indicates that athletes scored lower than nonathletes on the measured variable. This difference is supported by the confidence interval, which ranges from -3.507 to -0.797 and does not include zero, providing 95% certainty that the true difference lies within this interval.
The t-statistic (-3.192) further reinforces the result, indicating a moderately strong effect and a clear, meaningful difference. These findings suggest that, within the specific metric analyzed, nonathletes outperform athletes. This statistically significant result warrants further investigation into potential underlying causes, such as variations in training regimens, levels of focus, or other external factors that may influence performance.
Discussion
Performance Comparison
The findings suggest that, for the variable analyzed, nonathletes outperform athletes. This could be due to several factors [25, 26, 27]: Training Effects: Nonathletes might devote more focus to the specific metric analyzed, potentially due to fewer distractions or competing priorities. Physical or Mental Fatigue: Athletes could experience fatigue or overexertion, which may lower their scores in certain tasks. Task-Specific Skills: The variable might be more aligned with skills or attributes that are less relevant to athletic training.
Methodological Strengths
Limitations
Sample Size: With only 50 participants in each group, the findings might not generalize to larger populations. Context-Specific Nature: The measured variable may not encompass broader skills or attributes that define athletic versus nonathletic abilities. Uncontrolled Variables: External factors, such as diet, sleep, or recent injuries, may have influenced the results.
Conclusion
The study of gait characteristics between athletes and non-athletes highlights notable differences in their movement patterns. Interestingly, non-athletes performed better than athletes in the specific metric under review, which could be attributed to factors such as the specificity of physical training, task-oriented behaviour, or habitual movement patterns. This research underscores the potential of gait analysis as a forensic tool, particularly in individual identification, event reconstruction, and the assessment of behavioural or physical states. The ability to identify individuals through their walking patterns offers a non- invasive and dynamic method for surveillance and criminal investigations. The research also lays a foundation for further exploration into how physical activity levels, biomechanical efficiency, and task-specific performance interplay to shape gait characteristics. Insights from such studies could refine forensic methodologies, enabling investigators to better interpret gait evidence in real-world scenarios. This approach could contribute to improved forensic practices, strengthening their role in criminal justice systems.
Conflicts of Interest
The authors declare no conflict of interest.
References
-
Anil K (2006) Biometrics: personal identification in networked society. 1st softcover print. New York, USA.
-
Ivan B, Nirenberg M, Vernon W, Birch M (2020) Forensic gait analysis: principles and practice. In: 1st (Edn.), Boca Raton, CRC Press.
-
Imed B, Goffredo M, Carter J, Nixon M (2011) On Using Gait in Forensic Biometrics: ON USING GAIT IN FORENSIC BIOMETRICS. Journal of Forensic Sciences 56: 882-889.
-
Jinyan C (2014) Gait Correlation Analysis Based Human Identification. The Scientific World Journal pp: 1-8.
-
Haruyuki I, Muramatsu D, Makihara Y, Yagi T (2013) Gait Verification System for Criminal Investigation.
-
Anjali G, Bhaskar Semwal V (2020) Multiple Task Human Gait Analysis and Identification: Ensemble Learning Approach. In Emotion and Information Processing, ed. Sachi Nandan Mohanty pp: 185-197.
-
Eun-tae J, Cho HY (2020) A Novel Method for Gait Analysis on Center of Pressure Excursion Based on a Pressure- Sensitive Mat. International Journal of Environmental Research and Public Health 17: 7845.
-
Lili L, Yin Y, Qin W, Li Y (2011) Gait Recognition Based on Outermost Contour. International Journal of Computational Intelligence Systems 4: 1090-1099.
-
Shantanu J, Das N, Basu S, Nasipuri M (2021) Survey of Human Gait Analysis and Recognition for Medical and Forensic Applications: International Journal of Digital Crime and Forensics 13: 1-20.
-
Ammar M, Chong AK (2021) Study of CCTV Footage Based on Lower-Limb Gait Measure for Forensic Application. In 2021 IEEE 12th Control and System Graduate Research Colloquium (ICSGRC), Shah Alam, Malaysia: IEEE pp: 160-164.
-
Martin S, Heimbürger RV, Jensen KE, Moeslund TB, Aanæs H, et al. (2016) Reliable Gait Recognition Using 3D Reconstructions and Random Forests – An Anthropometric Approach. Journal of Forensic Sciences 61: 637-648.
-
Ran Y, Zheng Q, Chellappa R, Strat TM (2010) Applications of a Simple Characterization of Human Gait in Surveillance. IEEE Transactions on Systems, Man, and Cybernetics, Part B (Cybernetics) 40: 1009-1020.
-
Kapil Kumar N (2022) Cyber-Forensic Review of Human Footprint and Gait for Personal Identification (version 1). arXiv.
-
Dilan S, Mallett X, Maynard P, Meuwly D, Roux C (2019) Forensic gait analysis-Morphometric assessment from surveillance footage. Forensic Science International 296: 57-66.
-
Ashish B, Kathane P, Krishan K (2022) Forensic Gait Analysis. In StatPearls. Treasure Island (FL): StatPearls Publishing.
-
Nor Shahidayah R, Abdul Manaf A (2010) Gait analysis for criminal identification based on motion capture. Universiti Teknologi Malaysia.
-
Sivalingan H, Anandakrishnan N (2021) Analysing The Suspicious Behaviour in Video Survillience for Crime Detection Using Gait Speed Monitoring. ICTACT Journal on Image and Video Processing 12: 2502-2507.
-
Sai Thu Ya A, Kusakunniran W (2024) A comprehensive review of gait analysis using deep learning approaches in criminal investigation. PeerJ Computer Science 10: e2456.
-
Mastrigt V, Nina M, Celie K, Mieremet AL, Arnout C, et al. (2018) Critical review of the use and scientific basis of forensic gait analysis. Forensic Sciences Research 3: 183-193.
-
Imed B (2017) Evidence Evaluation of Gait Biometrics for Forensic Investigation. In: Hassanien AE, Fouad MM, et al. (Eds.), Multimedia Forensics and Security 115: 307-326.
-
Zhu J, Shuai F, Jie F, Yong W (2009) Gait recognition based on the feature fusion. In: Proceedings of the 21st Annual International Conference on Chinese Control and Decision Conference pp: 5485-5488.
-
Daewook L, Soon J, Choi G, Kim K, Bahn S (2022) Identification of the Visually Prominent Gait Parameters for Forensic Gait Analysis. International Journal of Environmental Research and Public Health 19: 2467.
-
Wang L, Ning H, Tan T, Hu W (2004) Fusion of Static and Dynamic Body Biometrics for Gait Recognition. IEEE Transactions on Circuits and Systems for Video Technology 14: 149-158.
-
Ravinder K, Bogia P, Singh V, Onima Reddy T (2025) The running gait analysis technology: A comprehensive systematic literature review. Journal of Orthopaedics 62: 75-83.
-
Fitsum EP, Matthew E, Sunil K (2022) Changes in Gait Parameters Due to Visual and Head Oscillations in Football Players and Non-Athletes. IEEE Robotics and Automation Letters 7: 7171-7176.
-
Hui Juan L, Zhang Q, Chen S, Zhang Y, Li J (2024) A meta-analysis of performance advantages on athletes in multiple object tracking tasks. Scientific Reports 14: 20086.
-
Parker Tonya M, Louis Osternig R, Donkelaar PV, Chou L (2008) Balance control during gait in athletes and non- athletes following concussion. Medical Engineering & Physics 30: 959-967.
-
Lara T, Badache M, Cale S, Beher L, Zhang N (2017) Balance Performance as Observed by Center-of-Pressure Parameter Characteristics in Male Soccer Athletes and Non-Athletes. Sports 5: 86.
-
Romualdas M, Dumciene A, Mamkus G, Venckunas T (2014) Personality Traits and Exercise Capacity in Male Athletes and Non-Athletes. Perceptual and Motor Skills 118: 145-161.
-
Christin L, Kalak N, Brand S, Holsboer-Trachsler E, Pühse U, et al. (2016) The relationship between physical activity and sleep from mid adolescence to early adulthood. A systematic review of methodological approaches and meta-analysis. Sleep Medicine Reviews 28: 32-45.
- Narcotics and Digital Forensics: Bridging Crimes in the Digital Age
- Ethics in Forensic Psychiatry: Principles, Dilemmas, and Human Rights
- Impact of Acute Stress on Attentional Orienting to Social Cues
- Head Injury and Intracranial Hemorrhage in Western Region of Libya
- A Forensic Study on Handedness: Examination of Handwriting Features in Right and Left Handed Writers
- Techniques for Latent Fingerprint Development Using Natural and Synthetic Powders: A Review