Fauna Associated with Artemia salina Used to Feed Larvae of Macrobrachium rosenbergii (Decapoda: Palaemonidae) in Culture
Macrobrachium rosenbergii, the main species of the shrimp genus that is traded worldwide, commonly cultivated in China, India and Thailand, was introduced to Mexico in 1973. It is susceptible to infectious diseases associated with high mortality during its eleven larval stages, resulting in severe economic losses. To infer the source of contamination by protozoans during two larval development cycles of the shrimp in the aquaculture farm “Santa Fe” in Santa Fe, Veracruz, Mexico in 2021 was one of the aims of the study. The shrimp larvae (stages I-XI) in vivo, the culture medium and the food (Artemia salina) supplied for the larvae were examined using light microscopy, based on records, albeit rare, where food was contaminated by protozoans. The Hill numbers (N0, N1 and N2), the Shannon-Wiener diversity index, the Simpson’s dominance and the Pielou’s evenness indices were determined. Mortality rate in both cycles was similar: 89% in cycle 1 and 90% in cycle 2. The results showed that the mortality of larvae was not caused by the protozoan contaminants in the culture medium in which ten protozoan (nine freeliving and an epizoic) and two rotifer taxa (Rotaria rotatoria and Keratella sp.) were identified. Taxonomic protozoan diversity was the lowest in the first shrimp larval stages and was higher in the last stages. During the two cycles, Hymenostomatida gen. sp. was the most abundant, and Litostomatea gen. sp. was the least abundant. The results suggested the food (A. salina) as a probable source of contamination of the shrimp culture by protozoans.
Introduction
Macrobrachium rosenbergii De Man 1879 is a tropical crustacean, native to southern and southeastern Asia, northern Oceania and the western Pacific islands [1]. It is one of the representatives of the genus Macrobrachium Spence Bate, which includes approximately 238 species [2]. Some of the species in this genus are highly valued because of their flavor, high protein content and visual appeal [3]. The main species of the genus that is traded worldwide is M. rosenbergii, commonly cultivated in China, India and Thailand. China holds 90% of the patents worldwide for the genus Macrobrachium [4]. This species was introduced to Mexico in 1973 [5]. However, to date the expected results have not been obtained in terms of the scarce development of its cultivation at a commercial level due to the scarce supply of postlarvae. M. rosenbergii is susceptible to infectious diseases associated with high mortality during its eleven larval stages, resulting in severe economic losses and diminishing investments for the aquaculture sector [6, 7, 8].
Diseases that affect M. rosenbergii are of two types: non-infectious and infectious. Non-infectious diseases are subdivided into those caused by nutritional deficiencies and those caused by the effect of water quality. This last factor, in addition to subjecting the cultured organisms to stressful conditions such as variations in temperature, salinity and pH, can favor the development of infectious diseases because poor water quality causes the organisms to reduce their cleaning capacity, become incapable of molting or even develop physical lesions, making them vulnerable to opportunistic pathogens. Among the infectious diseases that affect M. rosenbergii is infestation by Protozoa [9, 10, 11], and this may be a cause of the high mortality rate during the larval stages of the crustacean.
When cultured crustaceans are colonized by epibionts, their continuous reproduction takes place on the host as time passes. Thus, the crustacean acquires an increasing load of epibionts in two possible ways. One is that the loss of the exoskeleton provides relief to the host during molting [12]. The other possibility is that the crustacean dies due to the problems caused by hindrance of locomotion, obstruction of the ocular organs or interference in gas exchange [13]. However, the specific causes of excessive colonization are not completely understood; apparently, healthy individuals are not excessively colonized by epibionts [14].
The term “protozoan” is assigned to unicellular heterotrophic eukaryotic organisms, which include four types: amoeboids, ciliates, flagellates and parasitic sporozoans [15]. Currently, there are ca. 8000 described ciliate species, of which ca. 4500 species are free-living [16]. Ciliates can be found in terrestrial and aquatic environments, in fresh, brackish and seawater and in wastewater treatment systems [17, 18]. Protozoa, in general, feed heterotrophically; however, mixotrophy has been documented in some species [19, 20, 21]. They feed on bacteria, microalgae and zooplankton, depending on their size [22, 23]. Ciliates are capable of establishing a wide variety of symbioses such as phoresis, parasitism, mutualism and commensalism.
At the global level, there are few studies on the presence of epibiontic Protozoa in crustaceans. In Mexico, these studies began in the mid-1960s; however, they are relatively scarce because of lack of interest in biodiversity studies [24, 25]. In studies on epibiosis in crustaceans, it was observed that Protozoa do not feed directly on the crustacean to which they adhere, but rather use it as a means to obtain their food [26] without becoming sick. However, the severity of protozoan infestation for crustaceans depends on the number of epibionts that colonize the organs [13]. In contrast, as the cropping/culture cycle progresses, effects of epibiontic Protozoa become more severe.
Furthermore, although scarce, there are records that food (Artemia sp.) can serve as a vehicle for disseminating Protozoa due to their encystment capacity [27]. Therefore, in the present study, both the food (Artemia salina) supplied to the larvae of M. rosenbergii, as well as the culture medium and the eleven crustacean larval stages were analyzed to reveal the species composition and possible sources of infestation.
Material and Methods
Sampling. Two culture cycles (a cycle includes eleven larval stages, or 22-28 days) of the M. rosenbergii larvae were monitored using the “Clear Water Model”. This model is characterized by using closed systems with water recirculation, offering a more efficient and controlled environment for organisms. The cultures were located at the “Santa Fe” aquaculture farm located in the State of Veracruz, southeastern Mexico. The first cropping cycle (C1) was developed in April 2021 and the second cycle (C2) in June 2023. In addition to monitoring the cultures of the M. rosenbergii larvae, the food supplied to the cultures of the crustacean was also monitored.
Samples of both M. rosenbergii larvae and the food were collected in their respective culture medium (brackish water: 15-18, temperature: 29-31°C). Sampling was carried out for each stage of the shrimp larval development (from stage I to stage XI). At the time of sample collection, the main water quality parameters were also measured: water temperature, salinity, dissolved oxygen (DO) and pH. In each cycle, 20 larvae per stage of M. rosenbergii were collected in a 25 µm mesh-sized sieve. Simultaneously with sampling the larvae, water from the bottom of the pond was stirred to ensure the homogeneity of the sample. The larvae were placed in a sterile plastic clinical sample bottle with a capacity of 120 mL. At each larval sampling, a sample of the food was collected in a sterile jar.
Laboratory analyses. Samples were transferred in a thermos at room temperature to preserve the temperature conditions of the collected samples and analyzed immediately upon arrival at the laboratory.
Samples were examined in vivo. A larva in 1 mL of culture water (henceforth called the larval sample) was placed in a modified Sedgwick-Rafter chamber of 2 mL capacity and examined for confirmation of protozoan adhesion under normal conditions. Subsequently, Protozoa present in the environment were examined for shape, swimming movements and habits. A half mL of 0.5 g/L chlorphenamine syrup was added to slow down the movement of Protozoa for accurate counts. Richness and abundance of protozoan and rotifer taxa were estimated. Twenty replicates were analyzed for each larval stage of M. rosenbergii, using a Motic BA300 compound microscope, equipped with 40x/0.65 and 100x/1.25 objectives in bright field.
For the in vivo food, the volume analyzed in the Sedgwick- Rafter chamber was 1 mL, and the same procedure was followed as for each larval sample with three replicates for each shrimp stage. The taxonomic identification was based on the guides of Foissner, et al. [28] and Fontaneto, et al. [29].
Statistical analysis. To analyze the diversity of ciliates, the series of Hill numbers was used [30]. Similarly, the Shannon-Wiener index estimated from ln and log2 was also determined. In addition, Simpson’s dominance index (Dsi) and Pielou’s evenness index (J’) were determined.
Using the data on the abundances of the protozoan taxa present in the food and the larval sample, a database in MS Excel, version 97-2003, was created. The Wilcoxon signed rank test was performed with a p < 0.05 to compare the similarity between the abundances in both the food and the larval sample. Abundance data that did not meet the assumptions of normality and homoscedasticity were expressed as median and interquartile range. All calculations reported in the present study were performed using the R program, version 4.1.1.
Results
Taxonomic composition and abundance. In total, ten protozoan taxa were identified, and six of them were observed in the food (A. salina). Nine taxa were observed in the larval sample, including ciliates and amoeboids during both cycles. In addition, two species of rotifers (Rotaria rotatoria (Pallas) and Keratella sp.) were identified in both the food and in the larval sample; these were included in the estimations of richness and abundance. No protozoans attached to the larvae were observed.
The species with the greatest abundance were the ciliates (Ciliophora) Hypotricha gen. sp. with 340 individuals (36, 1935; median (interquartile range) and Hymenostomatida gen. sp. with 212 individuals (7, 1182). The maximum values of both species were recorded in the food of cycle 2. Hymenostomatida gen. sp. was the most abundant species for both shrimp larval cycles, both in the food and in the larval sample.
The taxa in which significant differences were found, using the Wilcoxon signed rank test between the abundances observed in the food and the larval sample were Hypotricha gen. sp. of cycle 2 (p < 0.001), Hymenostomatida gen. sp. from cycle 2 (p < 0.001) and Disematostoma sp. from cycle 2 (p < 0.001). For these species the abundances were higher in food by one to two orders of magnitude (Figure 1).
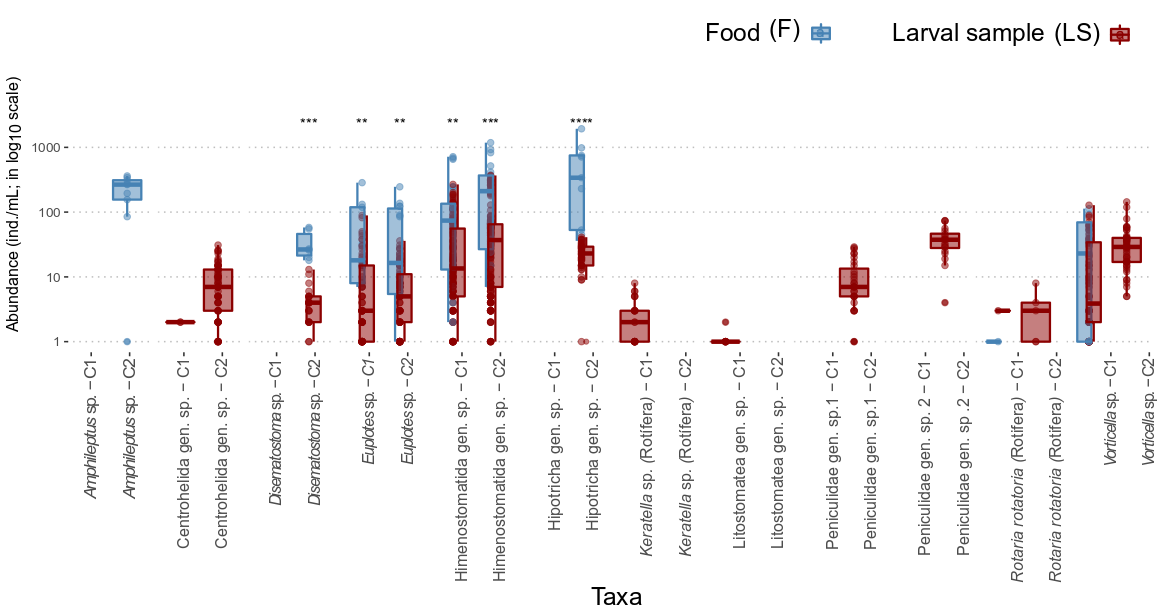
Figure 1: Comparison of the abundances of organisms associated with the cultured Macrobrachium rosenbergii per cycle (C1 and C2) and per substrate: food (F), larval sample (LS). Central vertical lines show the median, boxplots show the interquartile range, and whiskers show the minimum and maximum values, except for atypical values (shown by circles). The p value represents significant differences between substrates: ns = p > 0.05; * = p ≤ 0.05; = p ≤ 0.01; * = p ≤ 0.001; **** = p ≤ 0.0001.
Diversity indices. During cycle 1 in food, the highest Hill diversity indices, the highest Pielou’s evenness (J’) and the highest Shannon-Wiener index occurred in stage VII (N0 = 4, N1 = 3, N2 = 2; J´= 0.72; H´ln = 1.0; H´log2 = 1.45), while the Simpson’s dominance index was highest in larval stages II, III, V, VI and VIII (λ = 1.0). The lowest diversity indices for cycle 1 food, in general, occurred during stages I and XI, where protozoans were not observed (Table 1).
During cycle 2 in food, the highest Hill diversity indices occurred in stages IX and X: stage IX (N0 = 4, N1 = 2, N2 =
2); stage X (N0 = 4, N1 = 3, N2 = 2). The highest Shannon- Wiener index occurred in stage X (H´ln = 1.03; H´log2 = 1.48). The Hill and Shannon-Wiener diversity indices were lowest in stages I, II, V, VI, VII and XI, in which only one protozoan taxon was found (N0 = 1, N1 = 1, N2 = 1; H´ln = 0; H´log2 = 0). In contrast, Simpson’s dominance index was highest in stages I, II, V, VI, VII and XI (λ = 1.0). The greatest Pielou’s evenness in cycle 2 food was observed in stage X (J´ = 0.74) (Table 1).
| Stage and cycle | N0 (S) | N1 | N2 | Shannon_ln | Shannon_2 | Simpson´s_dominance | Pielou´s evenness | Amphileptus sp. | Centrohelida gen.sp. | Disematostoma sp. | Euplotes sp. | Hymenostomatida gen.sp. | Hypotricha gen.sp. | Keratella sp. (Rotifera) | Litostomatea gen.sp. | Peniculidae gen.sp.1 | Peniculidae gen.sp.2 | Rotaria rotatoria (Rotifera) | Vorticella sp. |
|---|---|---|---|---|---|---|---|---|---|---|---|---|---|---|---|---|---|---|---|
| C1 | |||||||||||||||||||
| I | 0 | 1 | — | 0 | 0 | 0 | 0 | 0 | 0 | 0 | 0 | 0 | 0 | 0 | 0 | 0 | 0 | 0 | 0 |
| II | 1 | 1 | 1 | 0 | 0 | 1 | — | 0 | 0 | 0 | 0 | 13 | 0 | 0 | 0 | 0 | 0 | 0 | 0 |
| III | 1 | 1 | 1 | 0 | 0 | 1 | — | 0 | 0 | 0 | 0 | 18 | 0 | 0 | 0 | 0 | 0 | 0 | 0 |
| IV | 2 | 1.22 | 1.1 | 0.2 | 0.29 | 0.91 | 0.3 | 0 | 0 | 0 | 0 | 19 | 0 | 0 | 0 | 0 | 0 | 0 | 1 |
| V | 1 | 1 | 1 | 0 | 0 | 1 | — | 0 | 0 | 0 | 0 | 244 | 0 | 0 | 0 | 0 | 0 | 0 | 0 |
| VI | 1 | 1 | 1 | 0 | 0 | 1 | — | 0 | 0 | 0 | 0 | 717 | 0 | 0 | 0 | 0 | 0 | 0 | 0 |
| VII | 4 | 2.73 | 2.45 | 1 | 1.45 | 0.41 | 0.7 | 0 | 0 | 0 | 285 | 111 | 0 | 0 | 0 | 0 | 0 | 1 | 113 |
| VIII | 1 | 1 | 1 | 0 | 0 | 1 | — | 0 | 0 | 0 | 0 | 7 | 0 | 0 | 0 | 0 | 0 | 0 | 0 |
| IX | 3 | 1.82 | 1.46 | 0.6 | 0.86 | 0.69 | 0.5 | 0 | 0 | 0 | 32 | 247 | 0 | 0 | 0 | 0 | 0 | 0 | 23 |
| X | 2 | 1.3 | 1.15 | 0.26 | 0.37 | 0.87 | 0.4 | 0 | 0 | 0 | 9 | 116 | 0 | 0 | 0 | 0 | 0 | 0 | 0 |
| XI | 0 | 1 | — | 0 | 0 | 0 | 0 | 0 | 0 | 0 | 0 | 0 | 0 | 0 | 0 | 0 | 0 | 0 | 0 |
| Median | 1 | 1 | 1.1 | 0 | 0 | 0.9 | — | 0 | 0 | 0 | 0 | 19 | 0 | 0 | 0 | 0 | 0 | 0 | 0 |
| Minimum | 0 | 1 | 1 | 0 | 0 | 0 | — | 0 | 0 | 0 | 0 | 0 | 0 | 0 | 0 | 0 | 0 | 0 | 0 |
| Maximum | 4 | 2.7 | 2.5 | 1 | 1.5 | 1 | — | 0 | 0 | 0 | 285 | 717 | 0 | 0 | 0 | 0 | 0 | 1 | 113 |
| C2 | |||||||||||||||||||
| I | 1 | 1 | 1 | 0 | 0 | 1 | — | 0 | 0 | 0 | 0 | 47 | 0 | 0 | 0 | 0 | 0 | 0 | 0 |
| II | 1 | 1 | 1 | 0 | 0 | 1 | — | 0 | 0 | 0 | 0 | 15 | 0 | 0 | 0 | 0 | 0 | 0 | 0 |
| III | 2 | 1.14 | 1.06 | 0.13 | 0.19 | 0.94 | 0.2 | 0 | 0 | 0 | 7 | 237 | 0 | 0 | 0 | 0 | 0 | 0 | 0 |
| IV | 2 | 1.2 | 1.1 | 0.19 | 0.27 | 0.91 | 0.3 | 0 | 0 | 0 | 18 | 374 | 0 | 0 | 0 | 0 | 0 | 0 | 0 |
| V | 1 | 1 | 1 | 0 | 0 | 1 | — | 0 | 0 | 0 | 0 | 517 | 0 | 0 | 0 | 0 | 0 | 0 | 0 |
| VI | 1 | 1 | 1 | 0 | 0 | 1 | — | 0 | 0 | 0 | 0 | 1182 | 0 | 0 | 0 | 0 | 0 | 0 | 0 |
| VII | 1 | 1 | 1 | 0 | 0 | 1 | — | 0 | 0 | 0 | 0 | 43 | 0 | 0 | 0 | 0 | 0 | 0 | 0 |
| VIII | 3 | 1.74 | 1.53 | 0.55 | 0.8 | 0.66 | 0.5 | 195 | 0 | 0 | 5 | 0 | 711 | 0 | 0 | 0 | 0 | 0 | 0 |
| IX | 4 | 2.01 | 1.54 | 0.7 | 1.01 | 0.65 | 0.5 | 311 | 0 | 58 | 137 | 0 | 1935 | 0 | 0 | 0 | 0 | 0 | 0 |
| X | 4 | 2.79 | 2.42 | 1.03 | 1.48 | 0.41 | 0.7 | 362 | 0 | 26 | 246 | 0 | 53 | 0 | 0 | 0 | 0 | 0 | 0 |
| XI | 1 | 1 | 1 | 0 | 0 | 1 | — | 0 | 0 | 0 | 0 | 38 | 0 | 0 | 0 | 0 | 0 | 0 | 0 |
| Median | 1 | 1 | 1 | 0 | 0 | 1 | — | 0 | 0 | 0 | 0 | 43 | 0 | 0 | 0 | 0 | 0 | 0 | 0 |
| Minimum | 1 | 1 | 1 | 0 | 0 | 0.4 | — | 0 | 0 | 0 | 0 | 0 | 0 | 0 | 0 | 0 | 0 | 0 | 0 |
| Maximum | 4 | 2.8 | 2.4 | 1 | 1.5 | 1 | — | 362 | 0 | 58 | 246 | 1182 | 1935 | 0 | 0 | 0 | 0 | 0 | 0 |
Table 1: Ecological indices and abundances in individuals per milliliter (ind./mL) of the taxa present in the food of eleven larv
During cycle 1 in larval samples, the highest Hill and Shannon- Wiener diversity indices occurred in stage XI (N0 = 5, N1 = 3, N2 = 2, H´ln = 1.01, H´log2 = 1.46); the Pielou evenness was highest in stage VI (J´= 0.94). Simpson’s dominance index was highest in stage II (λ = 1.0). The lowest values occurred in stage III, where protozoa were not observed (Table 2).
| Stage and cycle | N0 (S) | N1 | N2 | Shannon_ln | Shannon_2 | Simpson´s_dominance | Pielou´s evenness | Amphileptus sp. | Centrohelida gen.sp. | Disematostoma sp. | Euplotes sp. | Hymenostomatida gen.sp. | Hypotricha gen.sp. | Keratella sp. (Rotifera) | Litostomatea gen.sp. | Peniculidae gen.sp.1 | Peniculidae gen.sp.2 | Rotaria rotatoria (Rotifera) | Vorticella sp. |
|---|---|---|---|---|---|---|---|---|---|---|---|---|---|---|---|---|---|---|---|
| C1 | |||||||||||||||||||
| I | 3 | 1.9 | 1.5 | 0.64 | 0.92 | 0.66 | 0.58 | 0 | 0 | 0 | 0 | 6 | 0 | 0 | 0 | 0 | 0 | 3 | 35 |
| II | 1 | 1 | 1 | 0 | 0 | 1 | — | 0 | 0 | 0 | 0 | 1 | 0 | 0 | 0 | 0 | 0 | 0 | 0 |
| III | 0 | 1 | — | 0 | 0 | 0 | 0 | 0 | 0 | 0 | 0 | 0 | 0 | 0 | 0 | 0 | 0 | 0 | 0 |
| IV | 2 | 1.8 | 1.6 | 0.56 | 0.81 | 0.63 | 0.81 | 0 | 0 | 0 | 0 | 9 | 0 | 0 | 0 | 0 | 0 | 0 | 3 |
| V | 3 | 1.9 | 1.5 | 0.63 | 0.91 | 0.65 | 0.58 | 0 | 0 | 0 | 1 | 15 | 0 | 0 | 0 | 0 | 0 | 0 | 3 |
| VI | 2 | 1.9 | 1.9 | 0.65 | 0.94 | 0.54 | 0.94 | 0 | 0 | 0 | 0 | 18 | 0 | 0 | 0 | 0 | 0 | 0 | 10 |
| VII | 3 | 2.1 | 1.7 | 0.76 | 1.09 | 0.58 | 0.69 | 0 | 0 | 0 | 8 | 48 | 0 | 0 | 0 | 0 | 0 | 0 | 9 |
| VIII | 3 | 1.4 | 1.2 | 0.33 | 0.48 | 0.84 | 0.3 | 0 | 2 | 0 | 0 | 10 | 0 | 0 | 0 | 0 | 0 | 0 | 128 |
| IX | 5 | 1.5 | 1.2 | 0.38 | 0.54 | 0.85 | 0.23 | 0 | 2 | 0 | 5 | 268 | 0 | 6 | 0 | 0 | 0 | 0 | 10 |
| X | 4 | 2.3 | 2.1 | 0.83 | 1.19 | 0.47 | 0.6 | 0 | 0 | 0 | 89 | 93 | 0 | 5 | 1 | 0 | 0 | 0 | 0 |
| XI | 5 | 2.8 | 2.2 | 1.01 | 1.46 | 0.46 | 0.63 | 0 | 0 | 0 | 7 | 37 | 0 | 8 | 2 | 0 | 0 | 0 | 89 |
| Median | 3 | 1.9 | 1.6 | 0.63 | 0.91 | 0.62 | — | 0 | 0 | 0 | 0 | 15 | 0 | 0 | 0 | 0 | 0 | 0 | 9 |
| Minimum | 0 | 1 | 1 | 0 | 0 | 0 | — | 0 | 0 | 0 | 0 | 0 | 0 | 0 | 0 | 0 | 0 | 0 | 0 |
| Maximum | 5 | 2.8 | 2.2 | 1.01 | 1.46 | 1 | — | 0 | 2 | 0 | 89 | 268 | 0 | 8 | 2 | 0 | 0 | 3 | 128 |
| C2 | |||||||||||||||||||
| I | 3 | 2.6 | 2.4 | 0.93 | 1.35 | 0.42 | 0.85 | 0 | 2 | 0 | 10 | 10 | 0 | 0 | 0 | 0 | 0 | 0 | 0 |
| II | 5 | 2.1 | 1.5 | 0.73 | 1.06 | 0.67 | 0.46 | 0 | 11 | 0 | 3 | 12 | 0 | 0 | 0 | 0 | 0 | 8 | 144 |
| III | 4 | 3.2 | 3 | 1.17 | 1.69 | 0.34 | 0.85 | 0 | 7 | 0 | 36 | 58 | 0 | 0 | 0 | 0 | 0 | 0 | 79 |
| IV | 4 | 3.4 | 3 | 1.22 | 1.77 | 0.33 | 0.88 | 0 | 17 | 0 | 31 | 89 | 0 | 0 | 0 | 0 | 0 | 0 | 60 |
| V | 1 | 1 | 1 | 0 | 0 | 1 | — | 0 | 0 | 0 | 0 | 7 | 0 | 0 | 0 | 0 | 0 | 0 | 0 |
| VI | 2 | 1.3 | 1.2 | 0.27 | 0.39 | 0.86 | 0.39 | 0 | 0 | 0 | 6 | 73 | 0 | 0 | 0 | 0 | 0 | 0 | 0 |
| VII | 2 | 1.1 | 1.1 | 0.13 | 0.18 | 0.95 | 0.18 | 0 | 2 | 0 | 0 | 71 | 0 | 0 | 0 | 0 | 0 | 0 | 0 |
| VIII | 3 | 1.5 | 1.2 | 0.4 | 0.57 | 0.81 | 0.36 | 0 | 31 | 0 | 12 | 368 | 0 | 0 | 0 | 0 | 0 | 0 | 0 |
| IX | 4 | 2.8 | 2.4 | 1.02 | 1.47 | 0.41 | 0.74 | 0 | 4 | 0 | 0 | 129 | 0 | 0 | 0 | 29 | 74 | 0 | 0 |
| X | 5 | 4.1 | 3.3 | 1.4 | 2.03 | 0.3 | 0.87 | 0 | 0 | 13 | 9 | 10 | 41 | 0 | 0 | 12 | 0 | 0 | 0 |
| XI | 4 | 2.8 | 2.3 | 1.03 | 1.49 | 0.44 | 0.75 | 0 | 0 | 5 | 3 | 13 | 32 | 0 | 0 | 0 | 0 | 0 | 0 |
| Median | 4 | 2.6 | 2.3 | 0.93 | 1.35 | 0.44 | — | 0 | 2 | 0 | 6 | 58 | 0 | 0 | 0 | 0 | 0 | 0 | 0 |
| Minimum | 1 | 1 | 1 | 0 | 0 | 0.3 | — | 0 | 0 | 0 | 0 | 7 | 0 | 0 | 0 | 0 | 0 | 0 | 0 |
| Maximum | 5 | 4.1 | 3.3 | 1.4 | 2.03 | 1 | — | 0 | 31 | 13 | 36 | 368 | 41 | 0 | 0 | 29 | 74 | 8 | 144 |
Table 2: Ecological indices and abundances in individuals per milliliter (ind./mL) of the taxa present in the sample (culture med
During cycle 2 in larval samples, the highest values of the Hill and Shannon-Wiener diversity indices occurred in stage X (N0 = 5, N1 = 4, N2 = 3, H´ln = 1.40, H´log2 = 2.03). Pielou’s evenness index was higher in stage IV (J’ = 0.88), and Simpson’s dominance index was higher in stage V (λ= 1.0). The lowest diversity indices were observed in stage V, where only one protozoan taxon was found (N0 = 1, N1 = 1, N2 = 1, H´ln = 0.0, H´log2 = 0.0) (Table 2).
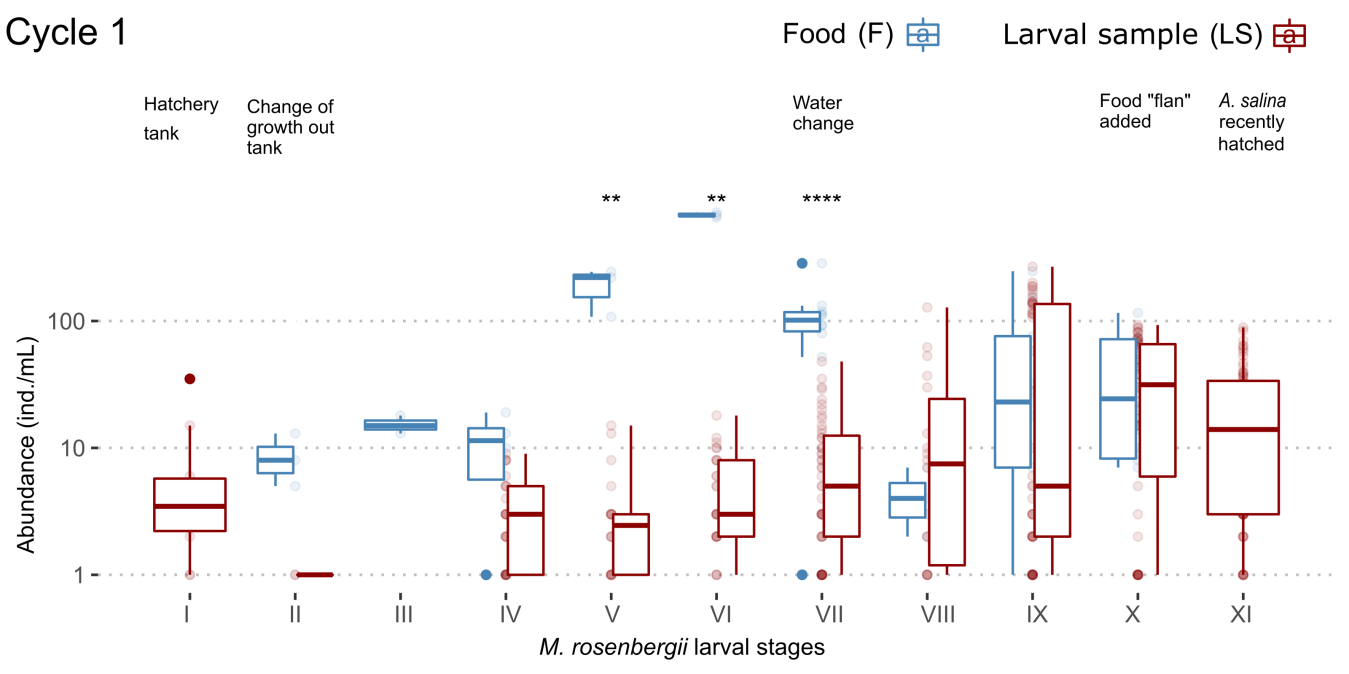
Variation in protozoan abundances associated with the culture of M. rosenbergii. In cycle 1 the abundances of protozoans decreased dramatically in the transition from stage I to stage II when carrying out the change from the hatching tub (stage I) to the growth tub (stage II). From stage III onward, the abundances of Protozoa in larval samples began to increase as the crop aged and then decreased in stage X where the food “flan” was administered (semi-moist preparation based on egg, rice flour, vitamins and minerals) instead of A. salina. In turn, in general, the abundances in food of cycle 1 were greater than in larval samples (stages II, III, IV, V, VI, VII, IX and X). The A. salina monitored during stage XI was observed to have been recently hatched, and Protozoa were absent (Figure 2).
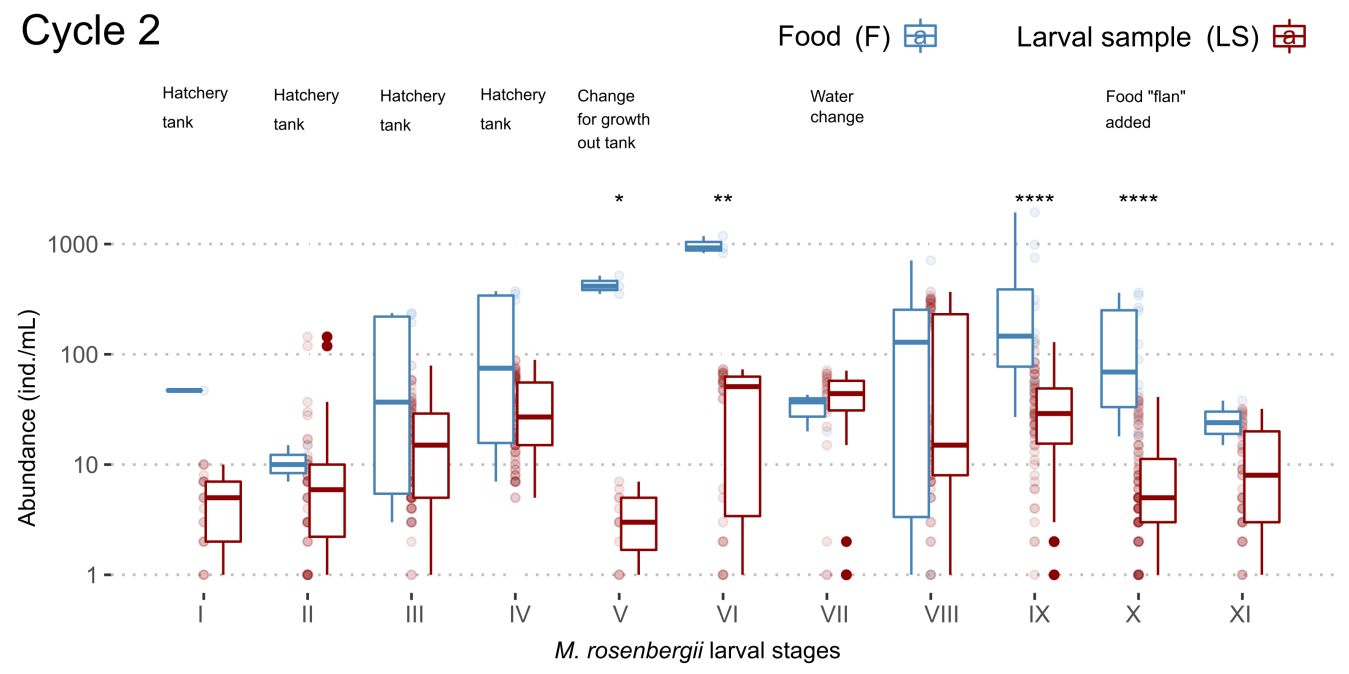
During cycle 2, the abundances of Protozoa increased as the larval stages of M. rosenbergii advanced within the hatching tub until reaching stage IV. Upon reaching this stage, the larvae were transferred to the growth tank, where the abundances of protozoans decreased dramatically during stage V and increased during stage VI. During stage VII, the water was changed, and the abundances remained stable; abundances increased during stage VIII and decreased during stage IX. In stage X, the food “flan” was administered to the crop, decreasing the protozoan abundances with respect to the previous stage. Finally, in stage XI a slight decrease in the protozoan abundances was observed with respect to stage X. In the food monitored during cycle 2, in general, protozoan abundances were higher than in the larval samples, except in stage VII (Figure 3).
Mortality: The mortality rate in both cycles was similar: in cycle 1 it was 89%, and in cycle 2 it was 90%. Both cycles started with 70 larvae/L.
Discussion
The protozoans in the culture medium of M. rosenbergii did not show any affinity for adhering to healthy larvae. However, some cells had a preference for adhering to detritus and mainly to the cysts of A. salina used as a food in the culture of the shrimp, while other protozoans were free-living. Feeding types of ciliates include saprozoic and bacterivorous forms [31, 32, 33]. Consequently, the protozoan abundance and diversity in the larval sample was higher in stages in which a greater amount of organic matter accumulated over time.
The protozoans identified in the present study were mostly free-living ciliates (nine taxa). This differs from that reported by Rodríguez, et al. [6], who found peritrichous (Ciliophora: Peritricha) and suctorian (Ciliophora: Suctoria) ciliates on the M. rosenbergii larvae. These protozoans adhere to a substrate and/or vector (crustacean), unlike free-swimming ciliates. This could be due to the region from which the A. salina came, the season in which the study was carried out, or even the place where the culture of the M. rosenbergii larvae was developed, as has been reported in the literature [34, 35].
Additionally, two species of rotifers (Rotaria rotatoria and Keratella sp.) were identified in both the food and the larval samples. Rotifers serve as a food for larvae of fish, crustaceans and mollusks [36], although both species are also considered as indicators of water quality [37]. Probably, due to the latter, the rotifers were most abundant in the stages in which the crop water was used longer (stages IX, X and XI); however, there are no studies of this to date.
Among the protozoans studied in the shrimp culture, Hypotricha gen. sp. (340 cells; 36, 1935; median (interquartile range) and Hymenostomatida gen. sp. (212 cells; 7, 1182) were highest in abundance (Figure 1). Both taxa have in common that they are mostly free-living saprozoic or bacterivorous organisms and, generally, are natural inhabitants of freshwater bodies [38]. It can be noted that due to the high adaptability of these taxa, they were found in higher abundances in most stages in both cycles where there was a greater amount of organic matter.
The taxonomic diversity of protozoans was lower in the early stages of the cultured shrimp and higher in the later stages (Table 2). This could be due to the water exchange that was made at the beginning of the cycle and to different incubation periods of different taxa, so that as the culture duration increased, new taxa appeared [39]. In general, as the larval stages of M. rosenbergii progressed, the diversity of protozoans in the culture medium increased. In the case of food, maximum diversity values occurred at different points in the larval development cycle of M. rosenbergii because A. salina was prepared and added to the shrimp culture periodically (Table 1).
In contrast, the Simpson’s index was higher in the food (A. salina) than in the larval samples (crop water). In the larval samples, the index values were higher in the stages where the taxonomic diversity of the studied fauna was lower in both cycles (Tables 1 & 2). In all cases, the dominant taxon was Hymenostomatida gen. sp., which has been reported as one of the abundant taxa in wastewater [40, 41]. It is likely that because this taxon is quite common, it was the only one that occurred in stages where there was a recent water change.
Equitability (J’ de Pielou) in the sample was generally higher during the intermediate stages, while in the food, the index reached its highest values at different points of both cycles (cycle 1: stage VII; cycle 2: stage X) (Table 2). This could reflect that most of the protozoan species reached their incubation period in intermediate stages of the M. rosenbergii culture and, as the stages progress, certain species tend to be more abundant [42]. This trend was not observed in the food (Table 1), probably because of the frequency of preparation.
Monitoring the different larval stages of M. rosenbergii during the two cycles demonstrated that the control of culture conditions influences the protozoan abundance (Figures 2 & 3). According to Sherr, et al. [43] and Ponce-Palafox, et al. [9] the quality of crop water influences the protozoan abundance and the presence of diseases in cultured organisms. This could explain why the protozoan abundances were zero or low when the change of water in the culture medium was more recent.
Our study revealed that the food (A. salina) was a source of protozoan contamination in the culture medium of M. rosenbergii. This agrees with what was reported by Méndez- Hermida, et al. [27], who demonstrated that A. franciscana Kellogg can serve as a disseminating vehicle for protozoans due to its encystment capability. However, the protozoans found in the larval sample of M. rosenbergii were not observed attached to the larvae of the shrimp, but rather were free-living forms (nine taxa), which do not affect the shrimp’s mortality. This coincides with Ramírez-Ballesteros, et al. [13], who observed an impairment of the respiratory rate of the crayfish Cambarellus montezumae (de Saussure) only after the crustacean’s gills were colonized by 50 or more suctorians. This is supported by Morales-Covarrubias, et al. [10], who point out that protozoans, in general, are cosmopolitan organisms that can be found naturally in the crustacean culture ponds, and that there may even be a certain number of epibionts on gills, appendages and cuticle of various parts of the body of the hosts without causing sickness.
Six protozoan taxa were found exclusively in the food (A. salina), and a total of ten protozoan taxa (nine free-living ciliates and a peritrich) were found in the food and the larval samples during both cycles. The protozoans in the larval samples of M. rosenbergii were not observed attached to the shrimp larvae, with the exception of the peritrich Vorticella sp., which was found both in the food and in the larval samples, and it was present attached to detritus. Despite the presence of protozoans in the larval samples of M. rosenbergii, they did not affect the mortality of the shrimp larvae during the monitored two culture cycles. However, the protozoan diversity associated with the culture of M. rosenbergii was higher during the stages in which the culture water was used longer. Finally, it was concluded that A. salina was a probable source of the protozoan contamination for the culture water of the shrimp [44].
Acknowledgments
G.G.-G. thanks María Piedad Sánchez Morillo-Velarde (a research scientist of the National Council of Science and Technology, Mexico - CONACyT at ICIMAP-UV), Alberto Asiain-Hoyos (Postgraduate College, Veracruz Campus) and Gabriela Galindo-Cortés (ICIMAP-UV) for their advice in the preparation of the master’s thesis, Miroslav Macek for his support in the identification of the protozoans (National Autonomous University of Mexico - UNAM), Juan Lorenzo Reta-Mendiola (Postgraduate College, Veracruz Campus) and the staff of the “Santa Fe” shrimp postlarvae production farm for his facilities and for supplying the larvae, and José Carlos Jiménez-López (UNAM) for his advice on data analysis. Marcia M. Gowing (Seattle, WA, USA) kindly improved the English style. G.G.-G. acknowledges CONACyT for the scholarship awarded (register number 411965) and the Master’s Program in Ecology and Fisheries of ICIMAP-UV, which made this study possible.
References
-
Luna M, Graziani C, Villarroel E, Lemus M, Lodeiros C, et al. (2007) Evaluation of three diets with different protein content in the culture of river prawn postlarvae, Macrobrachium rosenbergii. Zootecnia Tropical 25(2): 111-121.
-
García-Guerrero MU, Becerril-Morales F, Vega-Villasante F, Espinosa-Chaurand LD (2013) Los langostinos del género Macrobrachium con importancia económica y pesquera en América Latina: conocimiento actual, rol ecológico y conservación. Latin American Journal of Aquatic Research 41: 651-675.
-
Kent G (1995) Aquaculture and food security. In: Proceedings of the PACON Conference on Sustainable Aquaculture, June 1995, Honolulu, Hawaii, USA. Honolulu, Hawaii, USA: Pacific Congress on Marine Science and Technology 95: 11-14.
-
Chong-Carrillo O, Arencibia-Jorge R, Chávez-Chong CO, Akintola SL, García-Guerrero MU, Michán-Aguirre L, et al. (2016) The prawns of the genus Macrobrachium (Crustacea, Decapoda, Palaemonidae) with commercial importance: a patentometric view. Latin American Journal of Aquatic Research 44(3): 602-609.
-
INAPESCA (Instituto Nacional de Pesca) (2018) Acuacultura Langostino Malayo.
-
Rodríguez B, Lodeiros C, Conroy G, Conroy D, Graziani C (2001) Pathobiological studies on cultured populations of the freshwater prawn, Macrobrachium rosenbergii (De Man, 1879), Margarita Island, Venezuela. Revista Científica de la Facultad de Ciencias Veterinarias de la Universidad del Zulia 11 (2): 162-169.
-
Varela-Mejias A, Valverde-Moya J (2018) Determinación de la causa de mortalidad en un vivero del langostino gigante de agua dulce Macrobrachium rosenbergii en Costa Rica: análisis de caso. Revista de Investigaciones Veterinarias del Perú 29(2): 666-675.
-
Aguirre GG, Sánchez MG (2005) Análisis en fresco de camarón, un proceso rápido para el diagnóstico presuntivo de enfermedades. Panorama Acuícola Magazine 19(4): 59-65.
-
Ponce-Palafox JT, González-Salas R, Romero-Cruz O, Febrero-Toussaint I, Arredondo-Figueroa JL, et al. (2005) Enfermedades del camarón de agua dulce Macrobrachium tenellum y Macrobrachium rosenbergii durante el cultivo comercial en estanques rústicos, en empresas rurales. Revista Electrónica de Veterinaria 6: 1-12.
-
Morales-Covarrubias MS (2010) Enfermedades del camarón: detección mediante análisis en fresco e histopatología. 2nd ed. Trillas, México DF, México, pp: 122.
-
Cabrera F, Rubio M (2012) Protozoarios epibiontes en el cultivo de camarón Litopenaeus vannamei. Revista de la Facultad de Ciencias Veterinarias, Universidad Central de Venezuela 53(2): 69-80.
-
Johnson SK (1995) Handbook of shrimp diseases. Texas A&M University, Bryan, Texas, USA, pp: 28.
-
Ramírez-Ballesteros M, Cárdenas-Vázquez R, Lugo- Vázquez A, Mayén-Estrada R (2021) Effect of Cothurnia variabilis and Epistylis gammari (Ciliophora: Peritrichia) on metabolic rate of the crayfish Cambarellus (Cambarellus) montezumae. Diversity 13(7): 333.
-
Fernandez-Leborans G (2010) Epibiosis in crustacea: an overview. Crustaceana 83(5): 549-640.
-
Foissner W (2005) Protozoa. In: Hillel D (Ed.), Encyclopedia of soils in the environment. Elsevier Academic Press. Amsterdam, The Netherlands, pp: 336- 347.
-
Foissner W, Chao A, Katz LA (2008) Diversity and geographic distribution of ciliates (Protista: Ciliophora). Biodiversity and Conservation 17: 345-363.
-
Mayen-Estrada R, Reyes-Santos M, Aguilar-Aguilar R (2014) Biodiversidad de Ciliophora en México. Revista Mexicana de Biodiversidad 85: S34-S43.
-
Lynn DH (2008) The ciliated Protozoa. Characterization, classification, and guide to the literature. 3rd ed. Springer, Dordrecht, Heidelberg, London, New York, USA.
-
Stoecker DK, Silver MW, Michaels AE, Davis LH (1988) Obligate mixotrophy in Laboea strobila, a ciliate which retains chloroplasts. Marine Biology 99(3): 415-423.
-
Macek M, Callieri C, Šimek K, Lugo-Vázquez A (2006) Seasonal dynamics, composition and feeding patterns of ciliate assemblages in oligotrophic lakes covering a wide pH range. Archiv für Hydrobiologie 166: 261-287.
-
Macek M, Peštová D, Martínez-Pérez ME (2008) Seasonal and spatial dynamics of a ciliate assemblage in a warm-monomictic Lake Alchichica (Puebla, México). Hidrobiológica 18(S1): 25-35.
-
Kidder GW (1951) Nutrition and metabolism of protozoa. Annual Review of Microbiology 5: 139-156.
-
Foissner W (2014) Protozoa. Elsevier Reference Module in Earth Systems and Environmental Sciences, Elsevier Academic Press, Amsterdam, The Netherlands, pp: 1-12.
-
López-Ochoterena E, Ochoa-Gasca E (1971) Protozoarios ciliados de México. XVIl. Algunos aspectos biológicos de veinte especies epizoicas del crustaceo Cambarellus montezumae zempoalensis Villalobos. Revista Latinoamericana de Microbiología 13: 221-231.
-
López-Ochoterena E (2001) Protozoarios ciliados de México. XXXV. Sinopsis de las publicaciones incluidas en la serie Protozoarios Ciliados de México (I-XXXIV). Revista de la Sociedad Mexicana de Historia Natural 50(1): 61-66.
-
Mayen-Estrada R, Aladro-Lubel MA (1994) First record of Conidophrys pitelkae (Ciliophora: Apostomatia: Pilisuctorida) in decapod crustaceans from Tamiahua Lagoon, Veracruz. Anales del Instituto de Biología de la Universidad Nacional Autónoma de México, Serie Zoología 65(1): 1-10.
-
Méndez-Hermida F, Gómez-Couso H, Hares-Mazás E (2006) Artemia is capable of spreading oocysts of Cryptosporidium and the cysts of Giardia. Journal of Eukaryotic Microbiology 53(6): 432-434.
-
Foissner W, Berger H, Kohmann F (1996) Taxonomische und ökologische Revision der Ciliaten des Saprobiensystems. Band II: Peritrichia, Heterotrichida, Odontostomatida. Informatiosberichte des Bayer. Landesamtes für Wasserwirtschaft, Heft 5/92. Bartels & Wernitz. Landesamtes für Wasserwirtschaft, München.
-
Fontaneto D, De Smet HW (2015) Rotifera. In: Schmidt- Rhaesa A (Ed.), Handbook of zoology: Gastrotricha, Cycloneuralia and Gnathifera. Gastrotricha and Cnathifera. De Gruyter. Hamburg, Germany 3: 217-300.
-
Ludwig JA, Reynolds JF (1988) Statistical ecology: A primer on methods and computing. A Wiley-Interscience Publication. John Wiley & Sons, New York, Chichester, Brisbane, Toronto, Singapore, pp: 337.
-
Fenchel T (1987) Ecology of Protozoa: The biology of free-living phagotrophic protists. Brock/Springer Series in Contemporary Bioscience. Springer-Verlag, Heidelberg, Berlin, New York, USA, pp: 186.
-
Strom SL, Loukos H (1998) Selective feeding by protozoa: Model and experimental behaviors and their consequences for population stability. Journal of Plankton Research 20(5): 831-846.
-
Ruppert EE, Barnes RD (1996) Zoología de los invertebrados. 6a ed. McGraw-Hill Interamericana, México, D. F., México pp: 1114.
-
Olmo-Rísquez JL (1998) Diversidad local y global de los protozoos ciliados de hábitats de agua dulce. Tesis de Doctorado en Ciencias Biológicas, Universidad Complutense de Madrid, Madrid, España, pp: 122.
-
Jian-Gou J, Sheng-Wi W, Yun-Fen S (2007) Effects of seasonal succession and water pollution on the protozoan community structure in an eutrophic lake. Chemosphere 66 (3): 523-532.
-
Ascón-Dionicio GU (1992) Cultivo masivo de rotíferos en estanques de tierra. Folia Amazónica 4(1): 101-107.
-
Hye-Ji OH, Hyun-Gi J, Gui-Sook N, Yusuke O, Wei D, et al. (2017) Comparison of taxon-based and trophy- based response patterns of rotifer community to water quality: applicability of the rotifer functional group as an indicator of water quality. Animal Cells and Systems 21(2): 133-140.
-
Küppers GC, Kosakyan A, Siemensma F, Claps MC, da Silva-Paiva T, et al. (2020) Protozoa. In: Rogers DC, Damborenea CJ, Thorp (Eds.), Thorp and Covich´s freshwater invertebrates. Cambridge Academic Press, Cambridge, UK, pp: 9-77.
-
Kinner NE, Curds CR, Meerker LD (1988) Protozoa and Metazoa as indicators of effluent quality in rotating biological contactors. Water Science and Technology 20(11-12): 199-203.
-
Foissner W (1988) Taxonomic and nomenclatural revision of Sládeček’s list of ciliates (Protozoa: Ciliophora) as indicators of quality water. Hydrobiologia 166: 1-64.
-
Badenkey Z, Assany Y, Shaghouri G (2015) The detection of some ciliated species of the three families Parameciidae, Loxocephalidae and Urocentridae (Order: Hymenostomatida) as biological indicators. Journal of King Abdulaziz University, Marine Science 27(1): 55-71.
-
Madoni P (2011) Protozoa in wastewater treatment processes: A minireview. Italian Journal of Zoology 78(1): 3-11.
-
Sherr BF, Sherr EB, Berman T (1982) Decomposition of organic detritus: A selective role for microflagellate Protozoa. Limnology and Oceanography 27(4): 765-769.
-
Hernandez-Barraza CA, Aguirre-Guzmán G, López-Cantú DG (2009) Sistemas de producción de acuacultura con recirculación de agua para la región norte, noreste y noroeste de México. Revista Mexicana de Agronegocios 25: 117-130.
- Genetic Improvement of Nile Tilapia (Oreochromis niloticus): Advances in Selective Breeding and Genomic Approaches for Sustainable Aquaculture
- Microplastics, Contaminants, and Waste Hotspots: Divergences and Faults in Prioritizing Control Efforts
- Creating a Healthier, More Vibrant Open and Closed Aquatic Environment. A Submersible, Centrifugal Magnetically Affixed Current Changing Aquarium Pump
- An Attempt to Assess Alpha Diversity and Sample Size: Using the Ostracod Assemblages off Kumamoto Port, Japan
- Assessment of the Efficiency of Common Fishing Gears and Crafts Used at Mohananda River of Chapai Nawabganj, Bangladesh
- Fish Productivity and Biodiversity Status of Sundarban Mangrove in Bangladesh