Growth Effects of Replacing Fishmeal with Housefly (Musca domestica) Maggot Meal in Diet of C. gariepinus Fingerlings
In the face of increasing demand for sustainable aquafeeds, utilization of organic waste for maggot production represents an attractive position that might result in better nutrition for the fish with reduced environmental impact. The present study examines the production and nutritional efficiency of housefly maggot meal sourced from three organic substrates: cow manure, swine manure, and poultry manure, mixed with cow blood for the feeding of Clarias gariepinus. The production of housefly maggots was done using a wetting method. In the wetting method, each substrate used in the production of maggots were wetted twice every day and kept in shaded conditions for the proper development of the larvae. After the larvae had formed, maggots were harvested on the fourth day. The processed maggots were blanched, sealed using sunlight, oven-dried, and then ground into meal. Proximate composition analysis (crude protein, moisture, ash, crude fiber, and nitrogen-free extract) was carried out on the processed maggots. Growth trials were conducted to investigate the effects of inclusion of different levels of maggot meal on the performance of the fish over a period of ten weeks. Data derived from the tests were analyzed using ANOVA, and the level of significance was at (p < 0.05). Proximate composition reveals that the levels of protein remained the same for the diets tested and ranged from 45.32% to 45.81% with p-value of (0.067). Significant differences were seen in moisture content at (p < 0.0001), ash content at (p = 0.009), and NFE content at (p = 0.002). Amongst the various diets analyzed, diet T5 recorded the highest level of moisture at 9.24%, while diet T2 showed the highest in terms of ash content at 9.53%. Growth performance showed that diet T4 (75% maggot meal) significantly improved final weight (15.40 g, p = 0.000), weight gain (14.40 g, p = 0.000), and feed conversion efficiency (FCR: 1.64, p = 0.003) compared with other treatments. Carcass analysis conducted in this study showed that the diet labeled T4 had the highest crude protein content, measuring as high as 58.35%. It had the lowest ether extract levels. Additionally, the analysis of water quality done, shows that diet T5 had higher pH, 8.92 and dissolved oxygen 4.76 mg/L (p< 0.05). The findings of this research are evident that maggot meal is a sustainable and very efficient feedstuff protein source in aquaculture. Against the growth observed with diet T4, absolute benefits of inclusions of higher rates of maggot meal in fish feed for optimum growth performance are indicated. Besides this, the differences seen in water quality parameters among treatments stress the huge role dietary composition plays in setting conditions related to aquaculture. Based on the present observations, further studies relating the impacts of maggot meal on fish health with overall sustainability of aquaculture production systems need to be conducted.
Abbreviations
NaOH: Sodium Hydroxide; HCl: Hydrochloric Acid; NFE: Nitrogen Free Extracts; MWG: Mean Weight Gain; SGR:
Specific Growth Rate; FCR: Feed Conversion Ratio, FCE: Feed Conversion Efficiency; PER: Protein Efficiency Ratio; DO: Dissolved Oxygen; TDS: Total Dissolved Solids; EC: Electrical Conductivity.
Introduction
Aquaculture is now a major player in global fish production with species like Clarias gariepinus being farmed because of their hardness, fast growth rate and palatability [1]. Fishmeal has traditionally been the main protein source in aquafeeds because of its high nutritional value including essential amino acids and fatty acids. But with overfishing, rising prices and ecological impacts of fishmeal production, researchers and aquaculture practitioners are looking for alternative feed ingredients [2].
The demand for sustainable aquaculture has driven the investigation of insect based proteins particularly maggot meal as substitutes for fishmeal. Maggot meal is derived from the larvae of various fly species like Musca domestica and is not only a source of protein but also of lipids and micronutrients [3]. Maggots can be reared on organic waste so reducing feed cost and waste management [4]. Maggot meal has 30-45% protein and 30-40% fat and essential vitamins and minerals that can support fish growth and development [5]. Studies have shown that maggot meal amino acid profile can match that of fishmeal [6]. And maggot meal digestibility is comparable to traditional protein sources [7].
Studies have shown the positive effects of maggot meal in the diet of various fish species including Clarias gariepinus. Fagbenro OA, et al. [8] studied the growth performance of C. gariepinus fingerlings on diets with varying levels of fishmeal replacement with maggot meal. Their results showed that up to 50% of fishmeal can be replaced without affecting weight gain and feed efficiency. Ajani, et al. reported that C. gariepinus fingerlings fed 25% maggot meal substitution had significant SGR and overall health but growth performance declined at higher substitution levels. So a balanced diet is crucial to optimize growth. These results show that feed formulation is important to prevent negative impact on fish performance. The aim of this study is to evaluate maggot meal as a potential replacement for fish meal in the feeding of Clarias gariepinus.
Materials and Methods
Production, Harvesting and Preparation of Maggot Meal
Maggot Production and Harvest: The maggot production was carried out using the wetting method as described by Feldmann-Musham B [9] and the procedure described by Ezewudo BI, et al. [10].
There were three different treatments each triplicated in three units. Maggots used for this study were cultured from 3 organic substrates mixed with cow blood viz: Cow manure + blood, Swine manure + blood and poultry manure + blood. Each manure type was collected from Tripple Z Farm Karshi, Rugan Madaki, Abacha Road and Ado piggery farms, Nasarawa State and mixed with blood (attractant) and were weighed (5kg, 10kg and 20kg) and placed in sacks. The substrate was sprinkled with water twice daily, although the quantity of water added was adapted according to the climate and exposed for the odour to attract the house flies (Musca domestica) to perch and lay eggs on the manures. After which the mouth of the sacks were tied and kept under shade (to avoid direct effect of rainfall and sunlight) to allow for the development of maggot. After 2 days maggots were observed to have started emerging (hatched). Larvae development continued and matured maggots were harvested on day 4 of larva formation using floatation method; the manure with maggots, was first soaked in a basin filled with water, where in the maggots float on the water. They were therefore sieved with 3mm-mesh size net [11]. Using a weighing scale the harvested maggots from poultry manure, swine and cow manure (PMM, SMM, and CMM) were weighed and recorded, respectively. The manure with the highest yield of maggots was determined.
Preparation of Maggot Meal: Preparation of maggot meal was done according to the procedure described by Ezewudo BI, et al. [10]. Collected maggots were washed with clean tap water until they exhibit their characteristic white colour. Collected maggots were blanched with lukewarm water (40oC) for 10 to 20 minutes and exposed to sun in sieves before oven dried at constant temperature (90oC) over different time durations (35 minutes, 45 minutes and 55minutes) and then grinded to powder using blending machine to form maggot meal. The maggot meals were then taken to laboratory for analysis and the maggot meal with the best nutrient composition was determined.
Diet Formulation
The protein levels of the formulated feeds were based on the requirement for Clarias gariepinus fry and fingerlings and were calculated using linear programming (for least cost formulation using Microsoft Excel). In formulating the diet, other feed ingredients such as; soybean meal, Fishmeal, groundnut cake, maize, vitamin premix, carboxymethyl cellulose and fish/vegetable oil required in preparing the experimental diets was procured from a feed mill (Star Mega Feed mills, Nasarawa State, Nigeria). The ingredients of the formulated diets were thoroughly mixed in a Hobart A-200T mixing and pelleting machine (Hobart, Model, CA, USA) and extruded at 80oC under pressure through a 1mm die plate. The dried pellets were kept in airtight polyethylene bags until needed to feed the experimental fish. Proximate of the prepared diets was carried out to check the nutritional quality of the diets.
Determination of Proximate Composition of the Processed Maggot Meal, Experimental Diets and Fish Carcasses
The proximate analysis of the variously processed maggot meal samples was carried out to determine the moisture content, crude protein content, ash content, crude lipid, Nitrogen free extracts and crude fibre.
The proximate analysis of the sample was done according to Association of Official Analytical Chemists [12].
Determination of Moisture Content of the Processed Maggot Meal, Experimental Diet and /Fish Carcasses/: Moisture content of the sample was determined by oven-drying the sample. 10g of the sample will be weighed and put in a pre-dried crucible. The sample will be oven dried at 105°C for 24hours. The samples will then cooled in a desiccator and reweighed. The lost in weight will be recorded as moisture content and expressed as a percentage of the initial weight of sample as shown below
$$\%Moisture Content = \left\{ \frac{[(W1-W0)-(W2-W0)]}{W1-W0} \right\} \times 100$$
- Where:
- $W0$ = Weight of empty crucible
- $W1$ = Weight of crucible + sample before drying
- $W2$ = Weight of crucible + sample after drying
- DM (%) = Dry matter content of sample
- DM (%) = 100 - % Moisture content
Determination of ash content of the processed maggot meal/Experimental diets/fish carcass: The ash was determined according to method of AOAC [12]. Procelain crucibles with lids will be weighed and dried in a muffle furnace (Model M-525) and 5g of the sample was put in the pre-dried crucible. This will be properly covered and the content burnt in a muffle furnace (Model M-525) at 600°C for 24 hours to light grey ash. The sample was cooled in a desiccator and reweighed. The final weight of the sample in the crucible was recorded as ash content and expressed as a percentage of the initial sample weight.
$$Ash(\%) = \frac{W2-W1}{W1-W0} \times 100$$
- Where:
- Ash (%) = Ash content of the sample (%)
- $W0$ = Weight of empty dry crucible
- $W1$ = Weight of empty dry crucible + sample before ashing
- $W2$ = Weight of empty dry crucible + ash
Determination of Crude Protein Content of the Processed Maggot Meal, Experimental Diets and Fish Carcasses: The crude protein was determined according to thermico-Kjeldahl modified methods of AOAC [12]. Two grammes (2g) of dried sample were weighed and put into a Kjeldahl flask. 5g of anhydrous sodium sulphate was then added into the flask followed by 1g copper sulphate and a speck of Selenium then a 25ml concentrated sulphuric acid ($H_2SO_4$) 98% and 5 glass beads. The flask was placed on a digester of the Kjeldahl's apparatus and heated gently until frothing cease. The digestion continues under strong heat for 30 minutes to clear the solution and oxidize all carbons. The digested sample was cooled, diluted with distilled water making it up to 100ml with distilled water. Then 5ml of the aliquot was diluted with 5ml of 60% of sodium hydroxide (NaOH) in Markham distillation apparatus and distilled into 10ml of 4% boric acid.
The content of the apparatus was heated by passing steam through and the distillate collected in distillation flask until the volume reaches 50ml, which was titrated against standard hydrochloric acid (HCl) (0.01M) solution. The volume of 0.01M HCl used was taken as the end point when colour change from blue to red, the volume of 0.01M HCl used was noted. A blank experiment using filter paper without sample was carried out. The volume of 0.01M HCl used for the blank was then subtracted from the actual experiment to obtain the volume of 0.01M HCl used against titrable Nitrogen compound. The percentage Nitrogen and crude protein in the original sample was calculated using the formula below:
$$Nitrogen(\%) = \frac{V(V2-V3) \times 100}{V1 \times W \times 1000} \times 100\%$$
- Where:
- $W$ = Wight of sample in grams
- $V$ = Total volume of the sample solution made
- $V1$ = Volume taken for each distillation
- $V2$ = Volume of the acid used to titrate the sample
- $V3$ = Volume of the acid used to titrate the blank
- $M$ = Molarity of acid used for titration
- Crude protein (%) = %N X 6.25
Determination of Ether Extracts (Oil) Content of the Processed Maggot Meal, Experimental Diets and Fish Carcasses: A soxhlet extractor was fixed with reflux condenser and a small flask which has been previously dried in the oven and weighed. Two grammes (2g) of sample was weighed and transferred to fat-free extraction thimble, plugged lightly with cotton wool. The thimble was then placed in the extractor. 150cm³ of petroleum ether (B.P. 60-80°C) was added into the flask until it siphons over once.
More ether was added until the barrel of 100ml extractor is half full, the condenser was placed, seeing that the joins are tight and placed on the water bath. The source of heat was adjusted so that the ether boils gently and was left to siphon over for at least 8 hours. Finally the setup was watched until the ether gets short of siphoning over, then the flask was detached and the contents siphoned out of the barrel of the extractor into the ether stock bottle. This was well drained then the thimble was removed and dried in the oven. The condenser was replaced while continuous distilling of the ether is carried out until the flask is practically dry. The flask (which now contains all the oil) was detached; the exterior was cleaned and dried in the oven to constant weight. The extracted residue was kept for the "fibre" determination. The mean of loss weight of the extractor thimble and sample and gain in weight of extraction flask was recorded as the lipid content and was expressed as a percentage.
$$\text{Ether extracts} = \frac{\text{wt of oil}}{\text{wt of sample}} \times 100$$
Determination of Crude Fibre of the Processed Maggot Meal, Experimental Diets and Fish Carcasses: Method for crude fibre determination described by AOAC [12] was used. This is an alternative procedure to the more conventional crude fibre method. 500ml glacial acetic acid, 450ml water and 50ml concentrated Nitric acid mixed together. 20g trichoracetic acid was used then dissolved in the mixture and 1g of defatted material was weighed into 250ml conical flask. Carefully, 100ml of the TCA mixture was added into the flask after which it was reflux for exactly 40 minutes, counting from the time heating commenced. To prevent water loss a 3 feet long air condenser or a water-jacket condenser was used. The flask was disconnected and allowed to cool, the content was filtered through sieve No. 4 which was previously dried and weighed. The filter paper was washed 10 times with hot distilled water and once with industrial methylated spirit or absolute ethanol. The filter paper containing the residue was dried in the oven at 105°C for 24 hours after which it was transferred to a dessscator and weighed after cooling. An ashing crucible was weighed after which the weight of the crucible plus the filter paper containing the fibre was weighed. Ashing was done for 24 hours at 500°C, cooled and weighed after which the percentage crude fibre was calculated from the formula below:
$$\text{Crude fibre (\%)} = \left[ \frac{W2 - W3}{W1} \right] \times 100\%$$
- Where:
- $W1 =$ Weight of sample
- $W2 =$ Weight of crucible + dry residue
- $W3 =$ Weight of crucible + ash
Determination of Nitrogen Free Extracts (NFE) of the Processed Maggot Meal, Experimental Diets and Fish Carcasses: This was estimated by subtracting the total crude protein, crude lipid, ash and crude fibre from 100% to get the nitrogen free extract (NFE).
Clarias gariepinus Collection, Acclimatization and Management
Collection of Clarias gariepinus and Fingerlings: Healthy fingerlings of C. gariepinus were procured from the General’s Fish Hatchery, Abacha Road, Mararaba, Nasarawa State and were transported to the experimental site for acclimatization. Acclimatization and Management: The experiment was carried out in 300 litres plastic bowls kept indoors at Simax Farms, Nasarawa State, Nigeria. The fish were acclimatized for 14 days and were randomly allotted to 15 tanks at 50 fingerlings per bowl. The fish were starved for 24 h before the start of the feeding trial. Water from a borehole was passed through a circulatory filtration system before entering the experimental tanks. The fish were fed thrice daily for 10 weeks. Weighing of fish from each bowl was carried out at weekly intervals. Fish were inspected daily for abnormal behaviours and mortality. Water quality parameters were monitored weekly.
Replacement of Fishmeal with Maggot Meal in Diet of Clarias gariepinus Fingerlings
An investigation to determine the effect of replacing fishmeal with maggot meal in diet of C. gariepinus fingerlings was carried out with a view to determine the most suitable level of supplementing fishmeal with maggot meal and evaluate the growth performance. Fifty (50) fingerlings of C. gariepinus were stocked in each tank. Initial mean weight was taken and recorded. There were five experimental treatments, T1-T5. T1 contained 100% fishmeal and 0% MM (control), T2 (75% FM and 25% MM), T3 (50% FM and 50% MM), T4 (25% FM and 75% MM), T5 (0%FM and 100% MM). Each treatment was in triplicates. A total of 750 fingerlings were used. Experimental fish were fed at 5% body weight.
Growth Performance and Nutrient Utilization of Clarias Gariepinus Fed Housefly Maggot Meal: At the end of each experiment (lasting 10 weeks), growth and nutrient utilization data were gathered during the feeding trial and results from analysis of the diets and carcasses were used to determine the following biological parameters: mean weight gain (MWG), percentage weight gain, Specific growth rate (SGR), Feed conversion ratio (FCR), Feed conversion efficiency (FCE), Protein efficiency ratio (PER).
Water Quality Parameters
Water quality parameters such as temperature, pH, Dissolved Oxygen (DO), Total dissolved solids (TDS) and electrical conductivity were determined using water checker (Hanna waterproof water checker model H198129) and Dissolved oxygen (Lutron DO meter DO5509 water checker) following manufacturer instructions. • Temperature: The temperature of the water of the holding tanks was measured using multi-parameter Hanna waterproof tested model H198129. • pH: The pH of the water of the holding tanks was measured using the Hanna multi-parameter waterproof tester model H198129. • Dissolved oxygen: The dissolved oxygen was measured using oxygen digital meter Lutron DO meter model DO05509. • Electrical conductivity: The electrical conductivity of the water of holding tanks was measured using multi- parameter, Hanna waterproof tester H198129. • Total dissolved solids (TDS): The Total dissolved solids (TDS) of the water of the holding tank was measured using multi-parameter Hanna waterproof tester model H198129.
Statistical Analyses
Data resulting from the feeding trial were subjected to the analysis of variance (ANOVA) using Minitab 17 and significant differences were indicated. Means were tested further using least significant difference (LSD) at 5% level of significance.
Results
Table 1 shows diet Proximate Composition. The Table 1 provides the proximate composition (Crude Protein, Moisture, Ash, Crude Fibre, Ether Extract, NFE [Nitrogen- Free Extract] of different diets labeled as T1, T2, T3, T4, and T5. There were no significant differences in crude protein content among the diets (p = 0.067). However, the values ranged from 45.32% (T3) to 45.81% (T1), indicating relatively consistent protein levels across all treatments. Significant differences in moisture content were observed among the diets (p < 0.0001). Diet T5 had the highest moisture content (9.24 ± 0.01%), significantly higher than T4 (8.09 ± 0.03%), T3 (7.66 ± 0.10%), T2 (7.78 ± 0.12%), and T1 (7.12 ± 0.01%), which had the lowest moisture content. Significant differences were found in ash content among the diets (p = 0.009). Diet T2 had the highest ash content (9.53 ± 0.43%), significantly higher than T4 (8.28 ± 0.00%), T3 (8.12 ± 0.16%), T5 (8.06 ± 0.10%), and T1 (7.52 ± 0.09%). Significant differences were observed in crude fibre content among the diets (p = 0.001). Diet T5 had the highest crude fibre content (6.51 ± 0.02%), significantly higher than T4 (6.46 ± 0.01%), T3 (6.38 ± 0.01%), T2 (6.30 ± 0.03%), and T1 (6.27 ± 0.02%) the lowest. There were no significant differences in ether extract (fat) content among the diets (p = 0.642), with values ranging from 7.54% (T1) to 7.93% (T5). Significant differences were observed in NFE content among the diets (p = 0.002). Diet T1 had the highest NFE content (25.75 ± 0.06%), significantly higher than T3 (24.76 ± 0.07%), T4 (23.70 ± 0.26%), T5 (22.80 ± 0.04%), and T2 (22.84 ± 0.54%).
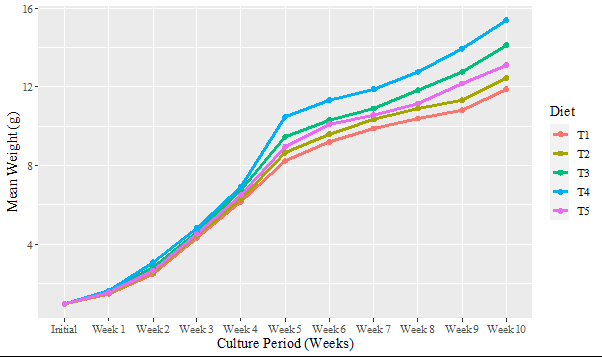
Figure 1 show the weekly weight progression data which reflects the growth patterns of the experimental fish fed different diets (T1 = 0% maggot meal, T2 = 25% maggot meal, T3 = 50% maggot meal, T4 = 75% maggot meal,T5 = 100% maggot meal). Initial weights among the diets showed minimal variation, with diet T3 starting slightly higher than others but not significantly different (p > 0.05). After Week 2, Significant differences in weight gain were observed (p < 0.05). Diet T4 exhibited the highest weight gain, followed closely by T5, indicating these diets promoted rapid early growth. In contrast, T1 showed the lowest weight gain during this period. In week 3, Significant differences persisted (p < 0.05). T4 continued to lead in weight gain, with T2 also showing notable progress. T1 and T3 lagged behind, showing slower growth rates compared to other diets. During week 4, Weight differences remained significant (p < 0.05).
T4 maintained its lead in weight gain, while T2 and T5 also showed substantial increases. T1 and T3 continued to exhibit slower growth rates. Throughout Week 5-10, differences in weight gain were consistently significant (p < 0.05). T4 consistently showed the highest cumulative weight gain over time, followed by T5 and occasionally T2. T1 and T3 consistently exhibited slower growth rates, indicating less effective nutritional support compared to other diets.
Table 2 shows the growth and Feed Performance Parameters. All treatments had a similar mean initial weight of 1.0 ± 0.0 grams, indicating uniformity in the starting weight of the experimental subjects.
Significant differences were observed in mean final weight among the diets (p = 0.000). Diet T4 resulted in the highest mean final weight (15.40 ± 0.08 grams), significantly higher than T3 (14.11 ± 0.12 g), T5 (13.11 ± 0.04 g), T2 (12.49 ± 0.25 g), and T1 (11.88 ± 0.12 g). This indicates that T4 promoted the highest growth in terms of final weight. Similar to MFW, significant differences were observed in mean weight gain among the diets (p = 0.000). Diet T4 had the highest mean weight gain (14.40 ± 0.08 grams), significantly higher than T3 (13.11 ± 0.12 g), T5 (12.11 ± 0.04 g), T2 (11.49 ± 0.25 g), and T1 (10.88 ± 0.12 g). This means that T4 was most effective in promoting overall weight gain. Significant differences were observed in specific growth rate among the diets (p = 0.000). Diet T4 exhibited the highest specific growth rate (3.91 ± 0.01% per day), significantly higher than T3 (3.78 ± 0.01% per day), T5 (3.68 ± 0.00% per day), T2 (3.61 ± 0.03% per day), and T1 (3.54 ± 0.01% per day). This
indicates that T4 not only promoted higher final weight but also accelerated growth rate. Significant differences were also observed in feed conversion ratio among the diets (p = 0.003). Diet T4 had the lowest FCR (1.64 ± 0.01), indicating more efficient feed utilization compared to T3, T5, T2, and T1. Lower FCR values signify better feed efficiency. Significant differences were observed in feed conversion efficiency among the diets (p = 0.002).
Diet T4 had the highest FCE (60.94 ± 0.27), indicating superior conversion of feed into body mass compared to T3, T5, T2, and T1. Significant differences were observed in protein efficiency ratio among the diets (p = 0.008). Diet T4 had the highest PER (1.34 ± 0.01), indicating efficient utilization of dietary protein for growth compared to T3, T5, T2, and T1. Significant differences were observed in apparent net protein utilization among the diets (p = 0.000). Diet T4 had the highest ANPU (79.13 ± 0.34%), indicating effective utilization of dietary protein for growth compared to T3, T5, T2, and T1. There were no significant differences in survival rates among the diets (p = 0.812), with all treatments showing high survival rates ranging from 98.00% to 99.33%.
The Table 3 presents the proximate composition of carcasses from different diets labeled as Initial, T1, T2, T3, T4, and T5. Significant differences were observed in crude protein content among the carcasses from the different diets (p = 0.000). The initial carcass composition had the lowest crude protein content (46.32 ± 0.07%), significantly lower than all experimental diets (T1-T5). Among the experimental diets, carcasses from T4 had the highest crude protein content (58.35 ± 0.06%), followed by carcasses from T5 (55.29 ± 0.03%), T3 (53.97 ± 0.00%), T2 (51.98 ± 0.01%), while carcasses from T1 has the lowest protein (49.84 ± 0.04%). There were no significant differences in moisture content among the carcasses from the different diets (p = 0.105), with values ranging from 7.64% (T4) to 7.90% (T1 and Initial). Significant differences were observed in ash content among the diet carcasses (p = 0.005). Initial carcasses had the highest ash content (10.26 ± 0.04%), significantly higher than carcasses from T4 (10.38 ± 0.14%) and T5 (10.12 ± 0.01%), but not significantly different from carcasses in diets T1, T2, and T3. carcasses from diet T4 had the highest ash content among the experimental diets, followed by carcasses from diet T1, T5, T2, and T3.Significant differences were observed in ether extract (fat) content among the diets (p = 0.000).
Initial carcasses had the highest ether extract content (9.05 ± 0.07%), significantly higher than all experimental diets (T1-T5). Among the experimental diets, carcasses fromT1 had the highest fat content (8.89 ± 0.03%), followed by carcasses from T2 (8.64 ± 0.01%), T5 (8.37 ± 0.10%), T3 (7.79 ± 0.07%), and T4 (7.80 ± 0.00%). This indicates a reduction in fat content from the initial composition due to dietary changes, with T4 showing the lowest fat content. Significant differences were also observed in NFE content among the carcasses from the different diets (p = 0.000). Initial carcasses had the highest NFE content (26.48 ± 0.06%), significantly higher than all experimental diets (T1- T5). Among the experimental diets, carcasses from T5 had the highest NFE content (18.52 ± 0.04%), followed by T4 (15.85 ± 0.10%), T3 (20.64 ± 0.04%), T2 (21.62 ± 0.02%), and T1 (23.21 ± 0.03%).
Table 4 presents the water quality parameters in experimental tanks of Clarias gariepinus fed different concentrations of Maggot meal (MM). for pH, dissolved oxygen (DO), total dissolved solids (TDS), temperature (Temp), electrical conductivity (EC), hardness, turbidity, and ammonia levels across five treatments (T1 to T5). The pH values ranged from 7.94 ± 0.01 to 8.92 ± 0.01 across treatments T1 to T5.
Treatment T5 had the highest pH of 8.92 ± 0.01, significantly higher than all other treatments (p < 0.05), while T1 had the lowest pH of 7.94 ± 0.01. Dissolved Oxygen (DO) levels ranged from 3.89 ± 0.02 to 4.76 ± 0.02 mg/L. Treatment T5 had the highest DO concentration of 4.76 ± 0.02 mg/L, significantly higher than all other treatments (p < 0.05), whereas T4 recorded the lowest DO concentration of 3.89 ± 0.02 mg/L.
Total Dissolved Solids (TDS) values varied from 351.93 ± 0.57 to 419.00 ± 0.35 mg/L. Treatment T1 had the highest TDS of 419.00 ± 0.35 mg/L, significantly higher than all other treatments (p < 0.05), whereas T5 had the lowest TDS of 351.93 ± 0.57 mg/L. Temperature ranged from 26.71 ± 0.04 to 27.27 ± 0.03°C.
Treatments did not significantly differ in temperature, although T5 had the highest value of 27.27 ± 0.03°C. Electrical Conductivity (EC) values ranged from 701.20 ± 0.26 to 836.10 ± 0.32 µS/cm. Treatment T1 had the highest EC of 836.10 ± 0.32 µS/cm, significantly higher than all other treatments (p < 0.05), while T5 had the lowest EC of 701.20 ± 0.26 µS/cm. Hardness values ranged from 5.31 ± 0.00 to 8.57 ± 0.02 mg/L. Treatment T1 had the highest hardness of 8.57 ± 0.02 mg/L, significantly higher than all other treatments (p < 0.05), whereas T5 had the lowest hardness of 5.31 ± 0.00 mg/L. Turbidity levels ranged from 14.12 ± 0.00 to 15.62 ± 0.00 NTU. Treatment T1 had the highest turbidity of 15.62 ± 0.00 NTU, significantly higher than all other treatments (p < 0.05), while T4 had the lowest turbidity of 14.12 ± 0.00 NTU.
Ammonia concentrations ranged from 0.10 ± 0.00 to 0.30 ± 0.01 mg/L. Treatment T2 had the highest ammonia level of 0.30 ± 0.01 mg/L, significantly higher than all other treatments (p < 0.05), whereas T3 and T5 had the lowest ammonia levels of 0.10 ± 0.00 mg/L. In conclusion, the water quality parameters varied significantly across the treatments (p < 0.05). Treatment T5 generally exhibited favorable conditions with higher pH, DO, and lower TDS compared to other treatments, while T1 often had the highest values for TDS, EC, and hardness. These findings suggest that the different concentrations of Maggot meal influenced water quality parameters in the experimental tanks of Clarias gariepinus, highlighting the importance of dietary management in aquaculture systems.
| Crude Protein | Moisture | Ash | Crude Fibre | Ether Extract | NFE | |
|---|---|---|---|---|---|---|
| T1 | 45.81 ± 0.01 | 7.12 ± 0.01d | 7.52 ± 0.09b | 6.27 ± 0.02c | 7.54 ± 0.06 | 25.75 ± 0.06a |
| T2 | 45.79 ± 0.19 | 7.78 ± 0.12bc | 9.53 ± 0.43a | 6.30 ± 0.03c | 7.76 ± 0.00 | 22.84 ± 0.54c |
| T3 | 45.32 ± 0.06 | 7.66 ± 0.10c | 8.12 ± 0.16b | 6.38 ± 0.01bc | 7.75 ± 0.29 | 24.76 ± 0.07ab |
| T4 | 45.59 ± 0.08 | 8.09 ± 0.03b | 8.28 ± 0.00b | 6.46 ± 0.01ab | 7.88 ± 0.22 | 23.70 ± 0.26bc |
| T5 | 45.45 ± 0.07 | 9.24 ± 0.01a | 8.06 ± 0.10b | 6.51 ± 0.02a | 7.93 ± 0.20 | 22.8 ± 0.04c |
| p-value | 0.067 | 0 | 0.009 | 0.001 | 0.642 | 0.002 |
Table 1: Diet Proximate Composition. Means in the same column followed by the same superscripts differ significantly (p<0.05) T1
T5 = 100% maggot meal
T1 = 0% maggot meal
T2 = 25% maggot meal
T3 = 50% maggot meal
T4 = 75% maggot meal
T5 = 100% maggot meal
| MIW | MFW | MWG | SGR | FCR | FCE | PER | ANPU | Survival | |
|---|---|---|---|---|---|---|---|---|---|
| T1 | 1.0 ± 0.0 | 11.88 ± 0.12d | 10.88 ± 0.12d | 3.54 ± 0.01d | 1.78 ± 0.01a | 56.16 ± 0.47c | 1.23 ± 0.01b | 61.51 ± 0.50c | 98.67 ± 0.67 |
| T2 | 1.0 ± 0.0 | 12.49 ± 0.25cd | 11.49 ± 0.25cd | 3.61 ± 0.03cd | 1.77 ± 0.04ab | 56.67 ± 1.34bc | 1.24 ± 0.03b | 64.95 ± 1.52c | 98.00 ± 1.15 |
| T3 | 1.0 ± 0.0 | 14.11 ± 0.12b | 13.11 ± 0.12b | 3.78 ± 0.01b | 1.67 ± 0.01bc | 59.77 ± 0.37ab | 1.37 ± 0.05a | 74.91 ± 2.54ab | 98.00 ± 1.15 |
| T4 | 1.0 ± 0.0 | 15.40 ± 0.08a | 14.40 ± 0.08a | 3.91 ± 0.01a | 1.64 ± 0.01c | 60.94 ± 0.27a | 1.34 ± 0.01ab | 79.13 ± 0.34a | 98.67 ± 0.67 |
| T5 | 1.0 ± 0.0 | 13.11 ± 0.04c | 12.11 ± 0.04c | 3.68 ± 0.00c | 1.72 ± 0.00abc | 58.13 ± 0.11abc | 1.28 ± 0.00ab | 71.67 ± 0.12b | 99.33 ± 0.67 |
| p-value | - | 0 | 0 | 0 | 0.003 | 0.002 | 0.008 | 0 | 0.812 |
Table 2: Growth and Feed Performance Parameters. Means in the same column followed by the same superscripts differ significantly
| Crude Protein | Moisture | Ash | Ether Extract | NFE | |
|---|---|---|---|---|---|
| Initial | 46.32 ± 0.07f | 7.89 ± 0.12 | 10.26 ± 0.04a | 9.05 ± 0.07a | 26.48 ± 0.06a |
| T1 | 49.84 ± 0.04e | 7.90 ± 0.10 | 10.15 ± 0.06ab | 8.89 ± 0.03ab | 23.21 ± 0.03b |
| T2 | 51.98 ± 0.01d | 7.88 ± 0.04 | 9.88 ± 0.01bc | 8.64 ± 0.01bc | 21.62 ± 0.02c |
| T3 | 53.97 ± 0.00c | 7.85 ± 0.04 | 9.76 ± 0.06c | 7.79 ± 0.07d | 20.64 ± 0.04d |
| T4 | 58.35 ± 0.06a | 7.64 ± 0.01 | 10.38 ± 0.14a | 7.80 ± 0.00d | 15.85 ± 0.10f |
| T5 | 55.29 ± 0.03b | 7.71 ± 0.01 | 10.12 ± 0.01abc | 8.37 ± 0.10c | 18.52 ± 0.04e |
| p-value | 0 | 0.105 | 0.005 | 0 | 0 |
Table 3: Proximate Composition of Carcass. Means in the same column followed by the same superscripts differ significantly (p<0.0
| Diet | pH | DO(mg/L) | TDS(mg/L) | Temp(℃) | EC (µS/cm) | Hardness (mg/L) | Turbidity (NTU) | Ammonia (mg/L) |
|---|---|---|---|---|---|---|---|---|
| T1 | 7.94 ± 0.01d | 4.35 ± 0.03c | 419.00 ± 0.35a | 26.89 ± 0.03b | 836.10 ± 0.32a | 8.57 ± 0.02a | 15.62 ± 0.00a | 0.20 ± 0.00b |
| T2 | 8.62 ± 0.01bc | 4.62 ± 0.02b | 380.27 ± 0.53b | 26.71 ± 0.04c | 762.23 ± 0.26b | 5.71 ± 0.00d | 15.02 ± 0.00b | 0.30 ± 0.01a |
| T3 | 8.46 ± 0.10c | 4.15 ± 0.03d | 378.00 ± 0.42c | 26.83 ± 0.03bc | 752.03 ± 1.36c | 5.81 ± 0.00c | 14.66 ± 0.02c | 0.10 ± 0.00c |
| T4 | 8.67 ± 0.00b | 3.89 ± 0.02e | 368.90 ± 0.50d | 27.19 ± 0.03a | 732.00 ± 0.32d | 6.23 ± 0.01b | 14.12 ± 0.00e | 0.20 ± 0.00b |
| T5 | 8.92 ± 0.01a | 4.76 ± 0.02a | 351.93 ± 0.57e | 27.27 ± 0.03a | 701.20 ± 0.26e | 5.31 ± 0.00e | 14.16 ± 0.00d | 0.30 ± 0.00a |
| p- value | 0 | 0 | 0 | 0 | 0 | 0 | 0 | 0 |
Table 4: ** Water quality parameters of experimental tanks of Clarias gariepinus fed different concentrations of Maggot meal (MM)
Means in the same column followed by different superscripts differ significantly (p<0.05) Key:
DO= Dissolved oxygen TDS= Total dissolved solids EC= Electrical conductivity Table 4: Water quality parameters of experimental tanks of Clarias gariepinus fed different concentrations of Maggot meal (MM).
Discussion
The proximate analysis of different diets, which were labeled as T1 to T5, is presented in Table 1. These shed light on nutritional parameters that could influence growth and performance traits in Clarias gariepinus. Concentration variations of moisture, ash, crude fiber, and nitrogen- free extract (NFE) underline some key factors pertinent to the development of dietary formulations for optimum aquaculture practices. The crude protein levels in all dietary formulations ranged between 45.32% and 45.81%, without any statistically significant variations. This is in line with the research carried out by Ogunji J, et al. [13] on Housefly Maggot Meal as a suitable bioresource for fish feed to boost early gonadal development in Clarias gariepinus. Its findings agreed with those of Akinwole A, et al. [14] who investigated growth performance, nutrient utilisation, survival, and some body indices of African catfish Clarias gariepinus fed a diet based on maggot meal. The uniformity observed in protein concentrations indicates that all tested dietary formulations provide adequate protein necessary for the growth of C. gariepinus. Prior research emphasizes the necessity of sustaining protein levels exceeding 40% in aquaculture rations to achieve optimal growth outcomes. Emmanuel A, et al. [15] document favorable findings when employing a diet comprising 40% crude protein, which includes a composite meal consisting of 25% maggot meal and various other animal-derived protein sources. The study found that weight gain, protein intake, and growth rates at 75-100% inclusion levels of this composite meal were comparable to the control fish meal diet [15]. Akinwole A, et al. [14] also presents a finding when he compared a maggot meal-based diet (28.70% crude protein) to a fish meal-based diet (34.65% crude protein). The weight gain, growth rate, and protein utilization values for the fish-meal diet greatly outweighed that fed with maggot meal, despite the protein content being below 40%. Magouz F, et al. [16], although not focusing specifically on maggot meal, found that a 30% protein diet gave significantly higher growth performance compared to those with 25% protein diets for C. gariepinus fingerlings. This would therefore imply that higher levels above 30% are indeed beneficial. Although the lack of variation appears beneficial for fulfilling protein needs, it is crucial to recognize that the quality of protein sources considerably influences both digestibility and bioavailability [17]. The assessment of dietary protein quality is influenced by factors such as the composition of essential amino acids, digestibility, and bioavailability [18, 19]. Generally, animal-derived proteins are perceived to possess superior quality and enhanced digestibility in comparison to plant-derived proteins, attributed to their amino acid profile and reduced levels of antinutritional compounds [19, 20]. There were significant differences in the moisture content, and T5 had the highest moisture content of 9.24%. This agrees with Yan J, et al. [21]
conclusions on the effects of replacement of fish meal with housefly maggot meal on muscle nutritional composition, amino acid profiles, as well as inosine monophosphate levels in juvenile Litopenaeus vannamei. The moisture content represents an essential element in determining the comprehensive nutritional worth of aquatic feeds, given that elevated moisture levels may increase the likelihood of spoilage and affect feed stability [22]. This may lead to a shorter shelf life for T5 and a loss of nutrient value over time.
In contrast, feeds characterized by reduced moisture content are frequently favored in aquaculture settings to mitigate the potential for microbial deterioration and to prolong storage duration [23, 24].
Although fish may derive advantages from the enhanced palatability linked to increased moisture levels, it is crucial to maintain a proper balance of moisture to facilitate feed preservation. Importantly, much significant differences were seen in ash content, for which T2 showed the maximum value (9.53%). Ash content is often increased along with an increase in the availability of minerals and trace elements; however, it could also be associated with a higher proportion of inorganic material that might be present in the diet [25]. Moreover, the ash content in aquafeeds is closely related to the mineral profile of the dietary formulation. High ash levels generally indicate high mineral levels, which can be beneficial for the growth and maintenance of healthy fish.
For instance, Domínguez D, et al. [25] explained that the inclusion of inorganic mineral forms in diets based on vegetable meal radically increased growth rates, as well as vertebral mass, ash content, and Zn levels due to bone mineralization, in juveniles of gilthead sea bream.
Similarly, Kokkali M, et al. [26] show that increased mineral fortification level improves retention efficiency of Zn, Mn, Cu, and Fe in Atlantic salmon. However, source and form of minerals in feeds can have a great impact on bioavailability and, further on, overall performance. Domínguez D, et al. [25] suggest that organic mineral delivery methods may be more effective than inorganic and encapsulated ones because they enhance bone osteogenesis and reduce the expression of genes involved in oxidative stress. Crude fiber content showed significant differences among diets, and the highest value of 6.51% was observed in T5. While dietary fiber can enhance gastrointestinal health and facilitate gut motility [27], excessive quantities, especially those exceeding species-specific tolerances, may disrupt nutrient absorption and diminish overall feed efficiency [28]. The digestive systems of fish exhibit limitations in efficiency, resulting in the inability to assimilate roughly one-quarter of their dietary intake due to the presence of indigestible detrimental factors that impede the digestive process. One
such specific anti-nutritional element of crude fiber has the potential to negatively affect nutrient absorption in fish.
Elevated concentrations of crude fiber may hinder the bioavailability of nutrients derived from feed components, which could result in diminished meat output and suboptimal feed utilization. Although dietary fiber plays a significant role in enhancing gastrointestinal health, excessive quantities can compromise energy availability and subsequently slow growth rates. Therefore, achieving an appropriate balance of fiber inclusions is crucial, especially for juvenile fish, where maximizing growth efficiency is of utmost importance. The lack of significant differences in the ether extract content, p = 0.642, ranged from 7.54% to 7.93%, which further shows the uniformity of all the dietary formulations. Lipids play an important role in determining energy density in fish diets and are fundamental for normal growth and metabolic processes. Although the existing range seems sufficient according to standard criteria, previous studies suggest that enhanced energy feeds may have a beneficial effect on both growth performance and feed conversion efficiencies across multiple fish species [29].
Lipids serve as a dense energy source in fish feed, delivering a minimum of double the energy compared to carbohydrates and proteins. They are essential in the nutritional framework of aquaculture, offering both energy and vital fatty acids, especially the long-chain polyunsaturated fatty acids that are prevalent in fish [30]. Lipids are the major energy source in aqua diets and reach high incorporation levels in the energy-dense feeds, hence playing a vital role in enabling fish to experience typical growth and metabolic processes. Colombo SM, et al. [30], however recorded a high variation in the NFE content, with the highest content in treatment T1 as 25.75%.
NFE is, in its core, the non-fibrous, soluble carbohydrate fraction of the diet; high NFE values are desirable to provide supplementary energy sources for growth and physiological functions [31]. In fact, more available feed levels can enhance feed palatability and digestibility in fish. Carbohydrates serve as an economical energy source in aquafeeds, contributing to enhanced feed quality and mitigating the breakdown of proteins and lipids.
However, excessive dietary carbohydrates can lead to poor growth performance and inflammatory immune responses in some fish species. For example, Epinephelus akaara fed 30% dietary carbohydrates exhibited poorer growth compared to those fed 0% or 18% carbohydrates. The weekly weight progression data presented in Figure 1 delineates the impact of dietary compositions on the growth performance of Clarias gariepinus. The results show that different diet regimes elicit different growth rates, hence the crucial role of nutritional strategies in aquaculture. The data shows more specifically that T4 and T5 are the best diets for inducing fast growth while T1 was the least in terms of weight gain throughout the experimental period. These findings are in agreement with those reported by Akinwole A, et al. [14] when he fed C. gariepinus with varying inclusion levels of maggot meal but is, however, contrary to the work of Idowu AB, et al. [32] which reported that Clarias gariepinus fry fed with 25% maggot meal out-weigh others. Initial weights among treatments showed little variation as T3 was started a bit higher from the rest but not significantly so. This observation suggests that variations in initial weights were negligible and that any resultant growth differences can be attributed to the diets themselves rather than starting conditions [33]. The alignment of early weight gain, particularly by Week 2, demonstrated significant differences across the diets. At this juncture, T4 demonstrated the most significant increase in weight, suggesting that its formulation may offer ideal nutrient proportions conducive to early growth.
The sustained pattern of T4 outperforming in weight gain from Weeks 2 to 10 substantiates conclusions from prior research highlighting the critical role of dietary formulation in enhancing growth performance among aquaculture species. The higher growth rate recorded for T4 would suggest better digestibility, more palatability, or the optimality of the ratio of protein to energy sources, as Hariati AM, et al. [34] identified as one of the key factors that improve feed efficiency and subsequently growth performance. Additionally, the impressive performance of T5 should not go unnoticed. The fact that it kept close to T4 within the time frame of the experiment shows that it also contains useful nutritional ingredients.
Studies suggest that varied protein sources, including insects or materials derived from insects, can improve growth parameters in fish. Insect meals, especially those sourced from black soldier flies and mealworms, have shown encouraging prospects as substitutes for fishmeal in aquafeeds.
At inclusion levels ranging from low to moderate, insect meals typically do not adversely affect fish growth when compared to diets that are based on fishmeal [35]. Some research indicates that specific insect meals might possess immunostimulatory characteristics that could enhance fish health [36]. In contrast, T1 exhibited the least weight gain from the beginning, a result that could be associated with insufficient nutrient density or bioavailability [37]. The overall growth data showed that T1 and T3 consistently had lower performance compared to the other nutritional treatments, which may denote inadequacy of these feeds to meet the growth-enhancing requirements of C. gariepinus.
The poorer performance of these treatments agrees with reports suggesting that low-quality feeds do not support good growth performance.
The persistent underachievement observed in T1 and T3 underscores the fundamental significance of feed formulation within the realm of aquaculture. Investigations into fish nutrition have demonstrated that dietary compositions surpassing specific protein thresholds are essential for realizing optimal growth rates. The examination of growth and feed performance metrics, as detailed in Table 3, demonstrates the notable influence of dietary formulation on the growth patterns of Clarias gariepinus.
The starting weights for all dietary treatments were consistent at 1.0 ± 0.0 grams. This uniformity provides a dependable reference point, guaranteeing that any subsequent variations in growth can primarily be ascribed to differences in diet. Diet T4 proved to be the best, giving the highest MFW of 15.40 ± 0.08 grams and MWG of 14.40 ± 0.08 grams (p = 0.000). This is in agreement with the work of previous authors, which reported that application of quality feed can significantly enhance growth rates of fish. The nutritional profile and quality of aqua feed have been identified as a factor in fish growth improvement and efficiency of feed utilization.
For instance, studies conducted on crucian carp Carassius carassius showed that fishes fed with Tong Wei TW had weight gain percentages 106.3% and 2.0% higher compared to Zhong Shan ZS- and Zhong Liang ZL-fed fish, respectively. This was attributed to the higher quality of protein in the TW feed, as suggested by the protein efficiency ratios.
The improved performance that was observed in T4 can be attributed to the optimized nutrient formulations, consisting of appropriate levels of protein, energy, and essential fatty acids [34].
Diets with high levels of digestible protein and energy are capable of eliciting an improved growth response in aquaculture species. The investigation concerning juvenile pacu (Piaractus mesopotamicus) indicated that a diet containing 350 g/kg of starch and 210 g/kg of digestible protein was optimal for both growth performance and feed efficiency. This nutritional formulation achieved an equilibrium between digestible protein and energy derived from starch, thereby resulting in enhanced growth results. In the case of the gilthead seabream (Sparus aurata), diets that had the incorporation of plant by-products, glutens, concentrates, and processed animal proteins proved to exhibit higher growth performance, better nutrient and energy retention, and lower feed conversion ratios than did a control diet. According to Aragão C, et al. [36], these alternative sources of protein provided nutritionally available nutrients for effective growth. T1 and T2 showed lower performances in growth. This can be ascribed to inadequate nutrient composition, which may have failed to meet the energy and protein requirements of the fish [37].
The studies show repeatedly that poor nutritional provision can result in impaired growth and reduced general well-being among fish.
The specific growth rate was highest in T4 and was 3.91% per day, hence further confirming the nutritional efficiency of this diet. Specific growth rates are indeed strong indicators, as they reflect efficiency of growth in relation to body weight. According to Ahmad I, et al. [37], the ability to achieve high SGR in T4 reflects good nutrient absorption and utilization, leading to better growth performance. Several works have used SGR when researching fish growth performance under different conditions. For instance, during the experiment on common carp, the highest value of specific growth rate was 0.346 ± 0.02% g/day and was obtained in fish fed a diet with 15% protein concentrate. Similarly, in research done on African catfish, SGR was determined to be significantly higher in fish with fed 7% of the body weight compared with lower feeding rates [38]. These findings really pinpoint the potential of SGR in enhancing feeding strategies.
Furthermore, T4 demonstrated the least feed conversion ratio (FCR) of 1.64 ± 0.01 and the highest feed conversion efficiency (FCE) of 60.94 ± 0.27, highlighting its exceptional performance in feed utilization. Reduced FCR values signify a more effective conversion of feed into biomass, which is a critical factor in aquaculture for reducing production expenses and enhancing profitability [39]. The enhancement in FCE aligns with findings of Khan M, et al. [40], when 60% replacement of soybean meal with maggot meal resulted in significantly lower feed conversion ratio (FCR) compared to lower inclusion rates. Similarly, Fawole FJ, et al. [41] reported improved growth performance and immuno-physiological indices with 71% maggot meal supplementation in catfish diets.
Hariati AM, et al. [34] reported optimal growth performance, nutrient efficiency, and digestibility in snakehead fry when 30% of the protein was replaced with protein from maggot meal. The PER results (1.34 ± 0.01) and ANPU (79.13 ± 0.34%) further substantiate T4’s excellent performance in protein utilization respectively. High PER and ANPU values indicate effective conversion of dietary protein into fish biomass, reinforcing the necessity of high- quality protein sources in aquaculture diets [39]. Several studies indicate positive effects of maggot meal on protein utilization in various animal species. In Djissou ASM, et al. [42], higher PER values of 2.16 and 2.14 were obtained from maggot meal than other protein sources such as earthworm meal, termite meal, and chicken viscera meal. This indicates a high-quality protein from maggot meal for fish feeding.
In African catfish, adding 21% maggot meal to soybean- based diets enhanced growth performance parameters such as final body weight, weight gain, and specific growth rate compared with the other diets.
It also enhanced immuno-physiological parameters and the ability of antioxidants. In milkfish, for example, a 50% replacement of fish meal with maggot meal resulted in an optimum protein efficiency ratio of 0.83±0.03% [43]. In the case of Nile tilapia, diets containing housefly maggot meal as a partial replacement for fishmeal showed no statistical differences in protein efficiency ratios (from 2.05 to 2.37) compared to control diets. Survival rates showed remarkable similarities in all dietary treatments, starting from 98.00% to 99.33%; no evidence of significant difference was observed. This outcome has become one of the positive signs of general health and suitability of diets, indicating that despite observed differences in growth performance, nutritional demands essential for survival could be sufficiently met under each treatment as reported by Yustiati, et al. [39]. The attainment of elevated survival rates is essential for the sustainability and economic viability of aquaculture, illustrating that effective feed management practices can promote both growth and health among fish populations. The proximate composition of the carcasses from Clarias gariepinus, which were provided with various diets (designated as Initial, T1, T2, T3, T4, and T5) as detailed in Table 2, offers significant insights into the nutritional results associated with differing feeding strategies.
The marked differences observed in crude protein, ether extract (fat), and nitrogen-free extract (NFE) underpin the impacts of dietary changes on the nutritional quality of fish carcasses-a cornerstone upon which the improvement of aquaculture feed formulations relies. One of the most important findings relates to the high increase in crude protein levels recorded among the different diets, with the carcasses from diet T4 presenting the highest protein level (58.35 ± 0.06%). This finding agrees with the observation made by Idowu AB, et al. [32] that stated crude protein was highest in fish fed with maggots at 76.31%, while it was lowest in fish without an experimental diet [32].
Muin H, et al. [44] explain further that although there were no significant differences in crude protein levels among the fishes treated with different diets (Diet 1 to Diet 5), the fishes that were fed with Diet 3 containing 70% replacement of fish meal with black soldier fly maggot meal showed a significant increase in crude protein content towards the end of the experiment as shown by Muin H, et al. [44]. This indicates that the inclusion of maggot meal may enhance the crude protein levels found in fish carcasses. Prior studies have highlighted the essential function of dietary protein in promoting both the growth and overall health of fish. Research indicates that protein plays a crucial role in the growth, feed conversion, and overall well-being of fish; however, the ideal quantities and origins of protein may differ based on the species of fish and their developmental stage [45]. Well- structured dietary formulations are recognized for their ability to improve muscle growth and overall development in fish, with protein concentrations exceeding 50% frequently advised for peak performance in aquaculture species. The initial protein concentration of 46.32% was markedly insufficient, underscoring the advantageous impacts of formulated feeds in relation to the preliminary nutritional condition at the onset of the study.
In contrast, the moisture content did not differ significantly among the experimental diets, always within a narrow range between 7.64% and 7.90%. While moisture content is relevant to feed stability and spoilage risk, the recorded values fall within the acceptable range commonly reported by Zambrano, et al. [46] suggesting that diets had appropriate levels of moisture that facilitated fish growth and at the same time did not lead to unwarranted spoilage. This consistency suggests that, even though moisture may have the potential to be a factor in feed quality; it may not have an immediate effect on carcass composition according to the parameters of the study. The statistical deviation in ash content provides another aspect to the analysis of diet quality.
The ash content was highest in the initial carcass of 10.26 ± 0.04% and might have indicated a surplus mineral that is detrimental to growth performance if not tightly regulated. In contrast, T4 exhibited the greatest ash content of all experimental diets (10.38 ± 0.14%), indicating a substantial mineral contribution; however, this also emphasizes the necessity for accuracy in diet formulation to achieve ideal mineral profiles that enhance fish health without negatively affecting nutrient absorption. Furthermore, notable variations were observed in the ether extract (fat) content, with the initial carcasses displaying the highest fat content (9.05 ± 0.07%).
Dietary changes and their implications in energy density of fish along the feeding succession were reflected in the reduction in fat content across the dietary groups, with T1 having the highest level among experimental diets at 8.89 ± 0.03%. Fish fed low fat diets can utilize energy more effectively for growth instead of fat deposition, something of special importance to species like C. The species gariepinus, characterized by excessive fat accumulation, may experience health complications that impact its marketability [47].
Numerous investigations suggest that the regulation of dietary fat is essential for achieving optimal body compositions in aquaculture species. Moreover, the non- fibrous carbohydrate (NFE) content displayed considerable variability across the different diets, with the initial carcasses exhibiting the highest NFE level (26.48 ± 0.06%). The decline in NFE concentrations observed in the experimental groups underscores the importance of achieving a proper equilibrium between dietary carbohydrates and the levels of protein and fat to support ideal growth rates. NFE is crucial as it acts as a significant energy source; consequently, diets that supply adequate amounts of carbohydrates while maintaining protein intake are vital for promoting optimal health and development in fish. Table 4 presents a comprehensive analysis of water quality parameters in the experimental tanks housing Clarias gariepinus fed varying concentrations of Maggot meal (MM).The pH values ranged significantly from 7.94 ± 0.01 to 8.92 ± 0.01 across treatments.
Treatment T5 had the highest pH, which was considerably above the suggested range for most freshwater fishes (7.0-8.5). This indicates that the addition of maggot meal in the feed can be influencing the acid-base balance in the aquatic ecosystems [48]. The pH was also positively related to increased biological activity and improved nutrient availability [49]. In contrast, the minimal pH recorded in T1 suggests that diets of lower efficacy may lead to less than ideal environmental conditions, which could negatively impact fish growth [50]. Furthermore, dissolved oxygen concentrations (DO) were markedly higher in T5 (4.76 ± 0.02 mg/L) when compared to other treatments, demonstrating a positive correlation with fish health and growth [51].
Adequate oxygen levels are crucial for sustaining metabolic processes in aquatic organisms; thus, the superior DO in T5 suggests shifts in metabolism and respiration facilitated by the dietary composition [52]. Lower DO levels in T4 (3.89 ± 0.02 mg/L) underscore potential risks of suboptimal growth conditions in more concentrated feeding regimes. Total dissolved solids and electrical conductivity are considered vital parameters to determine the quality of water in aquaculture. Treatment T1 had maximum values for TDS (419.00 ± 0.35 mg/L) and EC (836.10 ± 0.32 µS/ cm), respectively; these higher values may indicate wastes that might be accumulated due to the consumption of less effective diets [53].
While some TDS is necessary for providing minerals, excessively high levels can affect fish welfare and growth potential. T5, with the lowest readings in both TDS and EC (351.93 ± 0.57 mg/L and 701.20 ± 0.26 µS/cm, respectively), indicates a cleaner rearing environment conducive to optimal growth conditions. The hardness varied from 5.31 ± 0.00 to 8.57 ± 0.02 mg/L, with the highest concentrations shown for T1. Water hardness is crucial in physiological mechanisms and could even interfere with metabolic processes.
The increased hardness levels measured in T1 may appear beneficial on the surface; however, an extremely high concentration of minerals can potentially interfere with the osmoregulation in C. gariepinus and negatively affect its welfare. The turbidity ranged from 14.12 ± 0.00 to 15.62 ± 0.00 NTU, with the highest value in T1. Increased turbidity negatively impacts photosynthetic activity in aquatic plants and impairs fish by reducing visibility conditions [53].
The concentration of ammonia varied significantly, with T2 recording the highest level at 0.30 ± 0.01 mg/L. Increased ammonia concentrations pose a threat to the health of fish by disrupting gill functionality and possibly resulting in toxicity [48]. The measurement of the lowest ammonia levels in T3, which was 0.10 ± 0.00 mg/L, suggests effective biological filtration and decomposition of waste, thereby underscoring the critical role of dietary management in sustaining reduced toxicity levels within aquaculture environments [54, 55, 56].
References
-
Huisman EA, and Van der Poel TJ (1999) Nutrition of the African Catfish, Clarias gariepinus: a review. Aquaculture Research 30(3): 215-223.
-
Tacon AGJ, Metian M (2008) Global Overview on the Use of Fishmeal and Fish Oil in Industrially Formulated Aquafeeds: Trends and Future Prospects. Aquaculture Research 39(3): 306-320.
-
St-Hilaire S, Cranfield M, Trawick R (2007) The Potential for Using Black Soldier Fly Larvae as a Protein Source in Aquaculture. Aquaculture 274(4): 679-682.
-
Van Huis A, Van Itterbeeck J, Klunder H, Mertens E, Van der Fels-Klerx H (2013) Edible Insects: Future Prospects for Food and Feed Security. FAO Forestry Paper 171, Food and Agriculture Organization of the United Nations.
-
Makkar HPS, Tran G, Heuzé, V, Ankers P (2014) State-of- the-art on Use of Insects as Animal Feed. Animal Feed Science and Technology 197: 1-33.
-
Wang SK, Chen HH, Chen JC, Lo YC (2017) Nutritional Evaluation of Black Soldier Fly Larvae as Dietary Protein for Fish: A Review. Aquaculture Nutrition 23(5): 775- 787.
-
Alder J, Wood L (2004) Fisheries and Aquaculture: The Impact of Globalization on Fisheries Policy. Aquaculture Economics and Management 8(1-2): 1-12.
-
Fagbenro OA, Adebayo AA (1997) The Effects of Substituting Fishmeal with Maggot Meal in the Diet of Clarias gariepinus. Aquaculture Research 28(1): 53-56.
-
Feldmann-Musham B (1944) Studies on the ecology of the levant housefly (Musca domestica vicinia). Bulletin of Entry Research 35: 53-67.
-
Ezewudo BI, Monebi CO, Ugwumba AA (2014) Production and utilization of Musca domestica maggots in the diet of Oreochromis niloticus (Linnaeus, 1758) fingerlings. African Journal of Agricultural Research 10(23): 2363- 2371.
-
Sogbesan OA, Ajuonu ND, Musa BO, Adewole AM (2006) Harvesting techniques and evaluation of maggot meal as animal dietary protein source ‘’Heteroclarias” in outdoor concrete tanks. World Journal of Agricultural Science 2(4): 394-402.
-
AOAC (Association of Official Analytical Chemists) (2012) Official Methods of Analysis of Official Chemists Internaltional. In: 19th (Edn.), Association of Official Method of Analytical Chemists, USA, pp: 771.
-
Ogunji J, Amaechi N, Iheanacho S, Evulobi O, Mgbabu CN (2021) Housefly Maggot Meal as a Potent Bioresource for Fish Feed to Facilitate Early Gonadal Development in Clarias gariepinus (Burchell,1822). Sustainability 13(2): 921-934.
-
Akinwole A, Dauda A, Ogunkunle V (2020) Growth performance, nutrient utilization, survival and body indices of African catfish (Clarias gariepinus, Burchell 1822) reared on maggot meal based diet. FUDMA Journal of sciences 4(2): 53-59.
-
Emmanuel AO, Olujimi MF, Christianah I (2022) Nutrient utilization and growth performance of African Catfish (Clarias gariepinus) fed varying levels of Composite Meal (CM) in replacement of fishmeal. International Journal of Aquaculture and Fishery Sciences 8(2): 054-058.
-
Magouz F, Moustafa E, Khalafalla M, Sadek A (2019) The impact of different stocking densities and dietary protein levels on the performance of (Clarias gariepinus) fingerlings. Slovenian veterinary research 56(22): 67- 77.
-
Kohli V, Singha S (2024) Protein digestibility of soybean: How processing affects seed structure, protein and non- protein components. Discover Food 4(1).
-
Davies RW, Jakeman PM (2020) Separating the Wheat from the Chaff: Nutritional Value of Plant Proteins and Their Potential Contribution to Human Health. Nutrients 12(8): 2410.
-
Szepe KJ, Dyer PS, Salter AM, Johnson RI, Avery SV (2021) Influence of environmental and genetic factors on food protein quality: current knowledge and future directions. Current Opinion in Food Science 40: 94-101.
-
Sá AGA, Moreno YMF, Carciofi BAM (2019) Food processing for the improvement of plant proteins digestibility. Critical Reviews in Food Science and Nutrition 60(20): 3367-3386.
-
Yan J, Cao J, Wang G, Huang Y, Zhang R, et al. (2013) Effects of replacement of fish meal with housefly maggot meal on muscle nutritional composition, amino acids, and inosine monophosphate content in juvenile Litopenaeus vannamei. Journal of Fishery Sciences of China 19(2): 265-274.
-
Uyeh DD, Lohumi S, Park T, Woo S, Cho BK, et al. (2021) Rapid and Non-Destructive Monitoring of Moisture Content in Livestock Feed Using a Global Hyperspectral Model. Animals 11(5): 1299.
-
Rathod NB, Annapure US, Ozogul F, Bhagwat PK, Pillai S, et al. (2021) Cold plasma for the preservation of aquatic food products: An overview. Comprehensive Reviews in Food Science and Food Safety 20(5): 4407-4425.
-
Ma S, Wang H, Yang J, Li J, Xue M, et al. (2022) Effects of Clostridium autoethanogenum protein inclusion levels and processing parameters on the physical properties of low-starch extruded floating feed. Aquaculture Reports 23: 101030.
-
Domínguez D, Torrecillas S, Hamre K, Rimoldi S, Terova G, et al. (2017) Inorganic, organic, and encapsulated minerals in vegetable meal based diets for Sparus aurata (Linnaeus, 1758). Peer Journal 5(12): 3710.
-
Kokkali M, Giakovakis A, Sweetman J, Sveen, L, Lyons P, et al. (2023) Optimisation of trace mineral supplementation in diets for Atlantic salmon smolt with reference to holistic fish performance in terms of growth, health, welfare, and potential environmental impacts. Frontiers in Physiology 14: 1211987.
-
Wang H, Huang X, Tan H, Chen X, Chen C, et al. (2022) Interaction between dietary fiber and bifidobacteria in promoting intestinal health. Food Chemistry 393:1-14.
-
Ojha BK, Singh PK, Shrivastava N (2019) Enzymes in the Animal Feed Industry. Enzymes in Food Biotechnology pp: 93-109.
-
Oketch EO, Oh S, Wickramasuriya SS, Heo JM, Choi JS (2023) Physiology of lipid digestion and absorption in poultry: An updated review on the supplementation of exogenous emulsifiers in broiler diets. Journal of Animal Physiology and Animal Nutrition, 107(6):1429-1443.
-
Colombo SM, Foroutani MB, Parrish C (2020) Fats and Oils in Aqua feed Formulations Food Chemistry pp: 1-28.
-
Yang Y, Han T, Xiao J, Li X, Wang J (2018) Transcriptome analysis reveals carbohydrate-mediated liver immune responses in Epinephelus Akaara. Scientific Reports 8(1): 639-647.
-
Idowu AB, Oyediran AG, Amusan AAS (2021) The response of Clarias gariepinus fingerlings (Burchell 1822) to the diet containing Housefly maggot (Musca domestica)(L). Nigerian Journal of Animal Production 30(1): 139-144.
-
Imsland AKD, Jonassen TM, Hangstad TA, Mikalsen B, Reynolds P, et al. (2018) Effects of three commercial diets on growth, cataract development and histopathology of lumpfish (Cyclopterus lumpusL.). Aquaculture Research 49(9): 3131-3141.
-
Hariati AM, Wiadnya DGR, Arifin NB, Yuniarti A, Fakhri M (2022) The Effect of Maggot Formulated Feed on Essential Amino Acids Composition, Digestibility and Growth of Dwarf Snakehead, Channa gachua Fry. Sains Malaysiana 51(10): 3143-3151.
-
Hua K (2021) A meta-analysis of the effects of replacing fish meals with insect meals on growth performance of fish. Aquaculture 530: 735732.
-
Aragão C, Xavier MJ, Azeredo R, Gonçalves AT, Costas B, et al. (2022) Alternative Proteins for Fish Diets: Implications beyond Growth. Animals 12(9): 1211.
-
Ahmad I, Ullah M, Alkafafy M, Ahmed N, Mahmoud SF, et al. (2022) Identification of the economics, composition, and supplementation of maggot meal in broiler production. Saudi Journal of Biological Sciences 29(6): 103277.
-
Alofa CS, Abou Y (2020) A Comparison between Chicken Viscera and Housefly Maggot Cultured from this By- products for Nile Tilapia Diets: Growth Performance, Feed Utilization and Whole Body Composition. Asian Journal of Fisheries and Aquatic Research 5(3): 1-12.
-
Yustiati A, Suryadi IB, Haetami K, Habibie MR (2020) Growth Performance of Mutiara Catfish (Clarias gariepinnus) Fed a Combination of Commercial Feed and Black Soldier Fly Maggot (Hemetia illucens). Asian Journal of Fisheries and Aquatic Research 9(4): 27-36.
-
Khan M, Khan R, Chand N, Khan S, Sultan A (2018) Utilizing the House Fly (Musca Domestica) Larva as an Alternative to Soybean Meal in Broiler Ration During the Starter Phase. Revista Brasileira de Ciência Avícola 20(1): 9–14.
-
Fawole FJ, Shamna N, Memudu HA, Abdullahi N, Hassaan MS, et al. (2022) Housefly maggot meal complement soybean meal in a fish-free diet for hybrid catfish (Clarias gariepinus ♀ x Heterobranchus longifilis ♂): Effect on growth, body composition, blood biochemistry and antioxidant enzyme activity. Animal Feed Science and Technology 295: 115543.
-
Djissou ASM, Godome T, Koshio S, Odjo I, Fiogbe ED (2018) Amino Acids Composition of Maggot, Earthworm, Termite and Chicken Viscera Meals Used as Proteins Sources in Fish Feeding. International Journal of Aquaculture 8(9): 12-24.
-
Herawati VE, Hariyadi P, Rismaningsih N, Windarto S, Pinandoyo P, et al. (2020) Maggot Meal (Hermetia illucens) Substitution on Fish Meal as Source of Animal Protein to Growth, Feed Utilization Efficiency, and Survival Rate of Milkfish (Chanos chanos). HAYATI Journal of Biosciences 27(2): 154-168.
-
Muin H, Taufek N, Kamarudin K, Razak S (2017) Growth performance, feed Utilization and body composition of nile tilapia, Oreochromis niloticus (Linnaeus, 1758) fed with different levels of black soldier fly, Hermetia illucens (Linnaeus, 1758) maggot meal diet. Iranian Journal of Fisheries Sciences 16(2): 567-577.
-
Khan UK, Sakomura KN, Fernandes JK, Rodrigues TA, Do Nascimento TT, et al. (2019) Dietary protein quality and proper protein to energy ratios: a bioeconomic approach in aquaculture feeding practices. Latin American Journal of Aquatic Research 47(2): 232-239.
-
Zambrano VM, Dutta B, Mercer DG, Maclean HL, Touchie MF (2019) Assessment of moisture content measurement methods of dried food products in small- scale operations in developing countries: A review. Trends in Food Science and Technology 88: 484-496.
-
Xie RT, Amenyogbe E, Chen G, Huang JS (2020) Effects of feed fat level on growth performance, body composition and serum biochemical indices of hybrid grouper (Epinephelus fuscoguttatus × Epinephelus polyphekadion). Aquaculture 530: 735813.
-
Naylor RL, Abd Al-Jabbar Ibrahim A, Al-Humairi KOM (2000) Effective aquaculture: Steps towards sustainable farmed fish. Journal of aquatic Science 90(5): 1150- 1151.
-
Pavlidis MA, Takahashi LS, Oliva‐Teles A, Enes P (2010) The effect of water quality on the health and growth of tilapia species: A review. International journal of Aquaculture 18(2): 505-516.
-
Duncan N (2012) Hardness and alkalinity in freshwater systems: Physiological implications for fish. British Journal of Aquaculture 35(7): 100-112.
-
Zhou X, Huang S, Kong W, Yu H, Li F, et al. (2020) The significance of dietary carbohydrate quality on fish health and growth. Ecotoxicology and Environmental Safety 9(9): 150-161.
-
Hernández AJ, David SG, Kolawole OD (2016) The role of fiber in aquaculture feeds. Journal of Biotechnology 47(12): 3645-3657.
-
Amir G, Dias J, Cabano M, Fuentes J (2018) Impacts of feeding frequency and dietary composition on water quality attributes in Clarias gariepinus. Aquaculture Research 49(1): 201-211.
-
Ahmed I, Roohi N, Roohi A (2021) Effect of chitosan oligosaccharide and valine on growth, serum hormone levels and meat quality of broilers. South African Journal of Animal Science 51(1): 9-18.
-
Fasakin EA, Balogun AM, Ajayi OO (2003) Nutrition implication of processed maggot meals: hydrolysed, defatted, full-fat, sun-dried and oven dried, in the diets of Clarias gariepinus fingerlings. Aquaculture Research 9(34): 733-738.
-
Yigit M, Yilmaz S, Bulut M, Gürses K, Maita M, et al. (2018) Evaluation of Dietary Protein Level in Practical Feed for Two band Bream Diplodus vulgaris. North American Journal of Aquaculture 80(4): 379-387.
- Genetic Improvement of Nile Tilapia (Oreochromis niloticus): Advances in Selective Breeding and Genomic Approaches for Sustainable Aquaculture
- Microplastics, Contaminants, and Waste Hotspots: Divergences and Faults in Prioritizing Control Efforts
- Creating a Healthier, More Vibrant Open and Closed Aquatic Environment. A Submersible, Centrifugal Magnetically Affixed Current Changing Aquarium Pump
- An Attempt to Assess Alpha Diversity and Sample Size: Using the Ostracod Assemblages off Kumamoto Port, Japan
- Assessment of the Efficiency of Common Fishing Gears and Crafts Used at Mohananda River of Chapai Nawabganj, Bangladesh
- Fish Productivity and Biodiversity Status of Sundarban Mangrove in Bangladesh