MTH Score- A Novel Scoring System to Risk Stratify Renal Transplant Cases and to Improve Outcomes Post Renal Transplant
ntroduction: Kidney transplantation is the optimal treatment of ESRD. Maximum incidence of graft dysfunction is in the first year post transplant. Methodology: 410 cases of live donor renal transplant were studied in a period of 2 years. All recipients were followed for 1 year and their mean serum creatinine was considered to compare variables affecting the post transplant outcomes. We studied various pre and post transplant factors. Using these factors we made 3 score charts (pre transplant, post transplant and combined MTH score) by giving points in ascending order starting from one to each subgroup of the factors affecting transplant outcome. Maximum points were given to the category in the subgroup which has the best impact on the transplant outcome. We classified patients into low risk MTH group C (score >30), intermediate risk MTH group B (score 21-30) and high risk MTH group A (score 11-20). Results: 96.72 % recipients in MTH low risk group C had serum creatinine < two at the end of one year and had better graft survival as against 54.54% in MTH high risk group A. Conclusion: Thus MTH score can help risk stratify renal transplant cases and predict the outcomes in renal transplant cases. Also modifying the risk factors can help high risk cases to fall into low risk category and may improve post transplant graft survival rates in the first year.
Introduction
Kidney transplantation is the optimal treatment of ESRD in terms of morbidity, mortality and quality of life [1]. ESRD is a highly prevalent cause of morbidity and mortality. The Increasing familiarity with live donation and the generally successful outcomes have led to an increase in the number of renal transplants. “marginal donors” or “expanded criteria donors” [2], “medically complex donors” [3] are those donors which were once rejected from donation. Despite significant improvements in one-year kidney allograft survival [1], the rate of chronic graft loss after the first year remains substantial. The risk of graft loss has traditionally been divided into an early, high-risk period and a later period of constant low risk [4, 5].
We studied the pre-transplant and post-transplant factors affecting renal transplant outcomes in live donor renal transplantation and devised a novel scoring system to risk stratify them. All recipients were followed up to one year and their mean creatinine at one year was taken into consideration to compare the various factors.
Materials and Methods
After taking approval from the ethical committee of our hospital, 420 CASES of renal transplant were included in the study from May 2015 to may 2017. All cases were live kidney donation. The recipients were followed for one year. The mean creatinine of recipients at one year was calculated and used to compare variables. Donor and recipient factors like donor age, donor sex, ratio of donor kidney weight to recipient body weight, recipient age, donor to recipient sex, cold ischemia time, time for diuresis, number of blood transfusions to recipient,
Observation
amount of steroids taken by recipient in first 3 months after transplant, number of acute rejection episodes, number of renal arteries, hepatitis C virus infection of recipient were considered to find their effect on recipient creatinine at one year. We made three score charts (pre transplant, post transplant& combined MTH score) by giving points in ascending order starting from one to each subgroup of the factors affecting transplant outcome. Maximum points were given to the category in the subgroup which has the best impact on the transplant outcome.
Statistical Analysis
Data was entered into Microsoft excel data sheet and was analyzed using SPSS 22 version software. Categorical data was represented in the form of Frequencies and proportions. Continuous data was represented as mean and standard deviation. Independent t test or Mann Witney U test (*) was used as test of significance to identify the mean difference between two groups. ANOVA (Analysis of Variance) or Kruskal Wallis test (**) was the test of significance to identify the mean difference between more than two groups. p value <0.05 was considered as statistically significant.
| Subjects | Recipient Creatinine at 1 year | ||||||||||||||||||||||
|---|---|---|---|---|---|---|---|---|---|---|---|---|---|---|---|---|---|---|---|---|---|---|---|
| Profile of subjects | Points | P value | |||||||||||||||||||||
| Count | % | Median | SD | ||||||||||||||||||||
| Donor Gender | Males | 183 | 2 | 2.03 | 1.6 | 1.54 | 2 | <0.002* | |||||||||||||||
| Females | 227 | 1 | 1.85 | 1.5 | 1.45 | 1 | |||||||||||||||||
| Age of Donor | < 30 | 76 | 4 | 1.36 | 1.4 | 0.12 | 4 | <0.001** | |||||||||||||||
| 31 – 40 | 196 | 3 | 1.49 | 1.5 | 0.09 | 3 | |||||||||||||||||
| 41 – 50 | 120 | 2 | 2.32 | 1.6 | 1.87 | 2 | |||||||||||||||||
| >50 | 28 | 1 | 6.51 | 6.8 | 1.53 | 1 | |||||||||||||||||
| Recipient Gender | Males | 322 | 1 | 2.08 | 1.6 | 1.65 | 1 | <0.001* | |||||||||||||||
| Females | 88 | 2 | 1.36 | 1.4 | 0.13 | 2 | |||||||||||||||||
| Age of Recipient | < 20 | 15 | 5 | 1.26 | 1.3 | 0.05 | 5 | <0.001** | |||||||||||||||
| 21 – 30 | 89 | 4 | 1.39 | 1.5 | 0.12 | 4 | |||||||||||||||||
| 31 – 40 | 100 | 3 | 1.48 | 1.5 | 0.07 | 3 | |||||||||||||||||
| 41 – 50 | 138 | 2 | 1.57 | 1.6 | 0.07 | 2 | |||||||||||||||||
| >50 | 68 | 1 | 4.17 | 1.9 | 2.74 | 1 | |||||||||||||||||
| Donor – Recipient Gender distribution | M to F | 27 | 4 | 1.42 | 1.5 | 0.11 | 4 | <0.001** | |||||||||||||||
| M to M | 156 | 3 | 2.13 | 1.6 | 1.65 | 3 | |||||||||||||||||
| F to F | 61 | 2 | 1.34 | 1.3 | 0.13 | 2 | |||||||||||||||||
| F to M | 166 | 1 | 2.04 | 1.6 | 1.66 | 1 | |||||||||||||||||
| DKW/RBW ratio | < 2 | 32 | 3 | 3.52 | 1.8 | 2.41 | 1 | <0.001** | |||||||||||||||
| 2-3 | 370 | 2 | 1.81 | 1.5 | 1.32 | 2 | |||||||||||||||||
| >3 | 8 | 1 | 1.36 | 1.4 | 0.17 | 3 |
Table 1: Pre Transplant Factors.
| Graft GFR (ml/hour) | 40-45 | 53 | 1 | 3.96 | 1.8 | 2.91 | 1 | <0.001** |
|---|---|---|---|---|---|---|---|---|
| 46-50 | 35 | 2 | 2.87 | 1.8 | 2.18 | 2 | ||
| 51-55 | 95 | 3 | 1.54 | 1.6 | 0.12 | 3 | ||
| 56-60 | 118 | 4 | 1.51 | 1.5 | 0.12 | 4 | ||
| 61-65 | 96 | 5 | 1.44 | 1.5 | 0.11 | 5 | ||
| 66-70 | 13 | 6 | 1.46 | 1.5 | 0.07 | 6 |
Table 2: Pre Transplant Factors.
*Mann Whitney U test, ** Kruskal Wallis test. Table 1: Pre Transplant Factors.
| Subjects | Recipient Creatinine at 1 year | |||||||||||||||||||||
|---|---|---|---|---|---|---|---|---|---|---|---|---|---|---|---|---|---|---|---|---|---|---|
| Points | P value | |||||||||||||||||||||
| Count | % | Mean | Median | SD | ||||||||||||||||||
| No. of blood transfusions | Nil | 241 | 58.78 | 1.81 | 1.5 | 1.32 | <0.001** | |||||||||||||||
| 1 to 2 | 53 | 12.93 | 1.41 | 1.5 | 0.12 | 3 | ||||||||||||||||
| 3 to 4 | 82 | 20 | 1.97 | 1.5 | 1.49 | 2 | ||||||||||||||||
| > 4 | 34 | 8.29 | 3.47 | 1.8 | 2.56 | 1 | ||||||||||||||||
| Time to dieresis | <5 mins | 320 | 78.05 | 1.48 | 1.5 | 0.12 | 3 | <0.001** | ||||||||||||||
| 5 -10 mins | 52 | 12.68 | 3.41 | 1.8 | 2.72 | 2 | ||||||||||||||||
| >10 mins | 48 | 11.71 | 3.67 | 1.8 | 2.54 | 1 | ||||||||||||||||
| Acute rejection episodes | Nil episodes | 276 | 67.31 | 1.83 | 1.5 | 1.28 | 3 | <0.001** | ||||||||||||||
| 1 episode | 102 | 24.87 | 1.47 | 1.5 | 0.12 | 2 | ||||||||||||||||
| >2 episode | 30 | 7.31 | 3.41 | 1.7 | 2.67 | 1 | ||||||||||||||||
| Steroid dose during first 3 months | <1 kgms | 242 | 59.02 | 1.44 | 1.5 | 0.12 | 3 | <0.001** | ||||||||||||||
| 1 -1.5 kgms | 138 | 33.66 | 2.21 | 1.6 | 1.78 | 2 | ||||||||||||||||
| >1.5 kgms | 30 | 7.32 | 4.63 | 5.5 | 2.57 | 1 | ||||||||||||||||
| Cold ischemia time | 50-60 | 222 | 1.54 | 1.5 | 0.76 | 4 | <0.001** | |||||||||||||||
| 61-70 | 111 | 27.07 | 1.61 | 1.6 | 0.11 | 3 | ||||||||||||||||
| 71-80 | 56 | 13.66 | 3.71 | 1.7 | 2.77 | 2 | ||||||||||||||||
| >80 | 21 | 5.12 | 2.92 | 1.6 | 2.49 | 1 |
Table 3: Post Transplant Factors. • Deaths in first year after transplant – 10 (2.38%) • Number of renal arteries, side of the re
** Kruskal Wallis test. Table 2: Post Transplant Factors.
- Deaths in first year after transplant – 10 (2.38%)
- Number of renal arteries, side of the renal graft, mode of donor nephrectomy (lap/open), HCV infection to recipient did not significantly affect the mean creatinine at the end of one year.
- Pre transplant factors (Table 1)-The donor age < 30 years, male sex donor, female sex recipient, recipient age <20 years, donor graft GFR ,transplant from a male donor to a female recipient, higher Dkw/Rbw ratio had a favorable impact on the recipient serum creatinine.
- Post transplant factors (Table 2) – less blood transfusions, less amount of steroids, less time to diuresis, less episodes of acute rejection, less cold ischemia time had a favorable impact on the recipient serum creatinine.
- Donor age more than 50 years had a negative impact on mean creatinine [6, 7, 8].
- According to pre-transplant MTH score ,post transplant MTH score & combined pre &post transplant MTH score (Table 3) patients falling in the score range of 21- 27, > 15 & > 40 respectively had significantly less mean recipient creatinine at the end of one year.
Discussion
There is a global increase in the number of live-donor kidney transplants in view of a severe shortage of deceased donor organs [9, 10]. The results of live-donor transplantation are generally superior to those obtained from deceased donors [11]. The probability of graft survival among related and unrelated donors was essentially similar [12]. The use of unrelated donors led to a higher graft survival than related ones in certain conditions, namely, type I DM, focal glomerulosclerosis and polycystic kidney disease [13]. The risk factors associated with DGF (decreased graft function) analysed in multicentre studies include- Donor-related (age, hypertension, serum creatinine level); recipient-related (HLA mismatch, male gender, diabetes mellitus, serious hemodynamic problems, previous transplantation) and CIT (cold ischemia time) [14, 15, 16]. Studies have shown that CIT was the most important risk factor for the occurrence of DGF [17, 18]. Blood transfusion is an individual risk factor for the development of graft dysfunction [19]. Reduced pre-donation GFR, higher blood pressure, and total cholesterol levels, usually associated with older age, were suggested as a possible explanation for negative correlation between donor age and serum creatinine. We made three scoring system from the points given to the pre transplant &post transplant factors and a combine scoring system. In our study we found that the pre transplant factors like donor age, donor sex, graft GFR, ratio of Dkw/Rbw, recipient age, recipient sex, donor to recipient sex had a significant impact on the mean recipient creatinine at one year. Post transplant factors like time to diuresis, cold ischemia time, number of blood transfusions, total amount of steroid taken in first three months after transplant, number of acute rejection episodes had a significant impact on mean recipient creatinine at one year. The intraoperative factor affecting graft function significantly was cold ischemia time. We also considered factors like number of renal arteries, hepatitis C infection in the recipient& laparoscopic vs donor nephrectomy, but these were found to be statistically in significant in affecting mean recipient creatinine at one year.
- According to pre transplant score we made three groups of scores from 5-12, 13-20 & 21-27. The mean recipient creatinine at end of one year was significant less (1.38) in the 21-27 group as compared to (2.29) in the 5-12 group.
- According to post transplant MTH score we made three groups of scores from 5-10, 11-15 &>15. The mean recipient creatinine at end of 1 year was significant less (1.3) in the >15 group as compared to (3.03) in the 5- 10 group.
| Subjects | Recipient Creatinine at 1 year | ||||||||||||||||
|---|---|---|---|---|---|---|---|---|---|---|---|---|---|---|---|---|---|
| MTH Donor Criteria | |||||||||||||||||
| Count | % | Mean | Median | SD | |||||||||||||
| 11to 20 | 8 | 1.90% | 6.12 | 7.6 | 3.33 | ||||||||||||
| MTH group A | |||||||||||||||||
| 21 to 30 | 313 | 74.50% | 2.04 | 1.6 | 1.57 | ||||||||||||
| MTH group B | |||||||||||||||||
| >30 | 99 | 23.60% | 1.39 | 1.4 | 0.13 | ||||||||||||
| MTH group C | |||||||||||||||||
| P value | <0.001** |
Table 4: Combined pre and post transplant MTH score. • According to pre &post transplant MTH score (table 3) made three groups of
** Kruskal Wallis test Table 3: Combined pre and post transplant MTH score.
- According to pre &post transplant MTH score (table 3) made three groups of scores from 11-20 (MTH group A), 21-30 (MTH group B ) &>30 (MTH group C). The mean recipient creatinine at end of one year was significant less (1.39) in the MTH group C as compared to (6.12) in the MTH group A.
- 54.54 % recipients in MTH group A had serum to know the probability of success of the transplant preoperatively and post operatively and can help to plan for more intensive follow up of the recipients falling in the least score group (MTH group A).
creatinine< two at the end of one year.
- 96.72 % recipients in MTH group C had serum creatinine< two at the end of one year.
- 27.27% recipients in MTH group A were restarted on HD in the first year post renal transplant.
- Classifying patients according to the score will guide us
| Mean | Median | ||||||||||||||||||||||
|---|---|---|---|---|---|---|---|---|---|---|---|---|---|---|---|---|---|---|---|---|---|---|---|
| 95% Confidence Interval | 95% Confidence Interval | ||||||||||||||||||||||
| Estimate | Std. Error | Lower Bound | Upper Bound | Estimate | Std. Error | Lower Bound | Upper Bound | ||||||||||||||||
| 27.605 | 0.232 | 27.151 | 28.059 | 27 | 0.288 | 26.435 | 27.565 |
Table 5: Means and Medians for combined MTH Score.
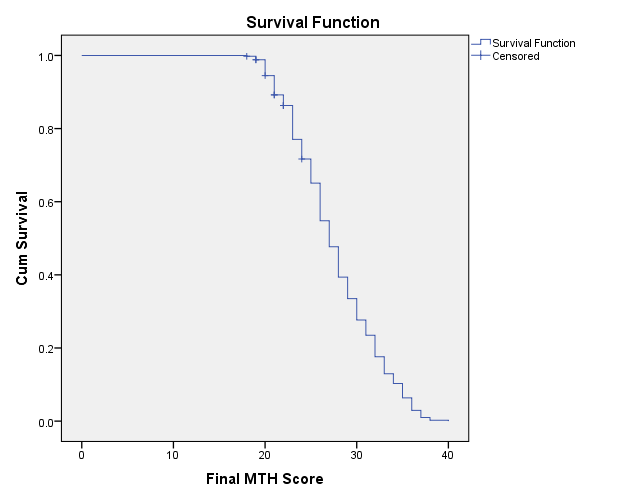
- Score on graft survival Outcome.
- Grafts with combined MTH Score of 27.6 and below had reduced survival (The recipients in this group had more mean serum creatinine at the end of one year).
- Test Result Variable(s): Final MTH Score
- Asymptotic 95% Confidence
- Area
- Std.
- Error
- P value
- Interval
- Lower Bound
- Upper Bound
- 0.915 0.026 <0.001*
- 0.864
- 0.966
Table 6: Area under the Curve.
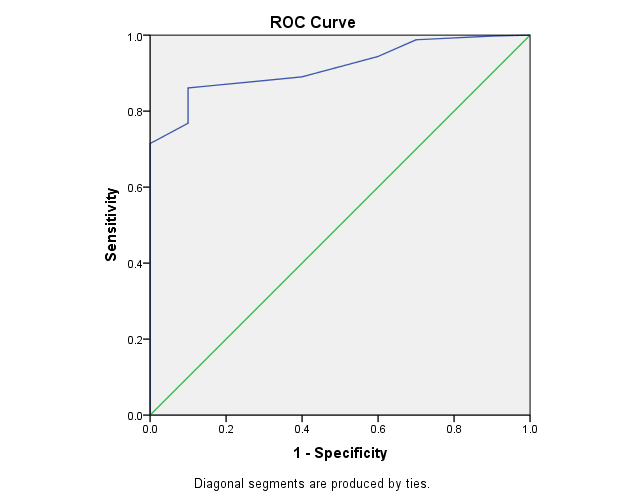
AUC showed that Final MTH Score had better validity in predicting the prognosis among renal transplant subjects compared to pre treatment and post treatment MTH Score.
Conclusion
since kidney transplant is the optimal method of treatment in ESRD, factors like donor age, donor sex, graft GFR, ratio of donor kidney weight to recipient body weight, recipient age, recipient sex, donor to recipient sex, time to diuresis, number of blood transfusions, total amount of steroid taken in first 3 months after transplant, number of acute rejection episodes, cold ischemia time should be taken into consideration to predict the outcomes in renal transplant.
The pre transplant MTH score, post transplant MTH score and the combined pre and post transplant MTH score can help predict the outcomes in renal transplant to some extent.
Donors & recipients can be counseled about the probability of transplant outcomes according to the MTH sscores. Also modifying the risk factors can help high risk cases to fall into low risk category and may improve post transplant graft survival rates in the first year. MTH score can be a Guide for future scoring systems in transplant.
References
-
Hariharan S, Johnson CP, Bresnahan BA, Taranto SE, McIntosh MJ, et al. (2000) Improved graft survival after renal transplantation in the United States, 1988 to 1996. N Engl J Med 342(9): 605-612.
-
Petrini C (2013) A few ethical criteria for evaluating the risks for ‘marginal’ living kidney donors. Transplant Proc 45(3): 1267-1269.
-
Reese PP, Caplan AL, Kesselheim AS, Bloom RD (2006) Creating a medical, ethical, and legal framework for complex living kidney donors. Clin J Am Soc Nephrol 1(6): 1148-1153.
-
Terasalo PI, Cecka JM, Gjertson DW (1997) Risk rate and long-term kidney transplant survival. In: Clinical Transplants 1996, Terasaki PI (Ed), UCLA Tissue Typing Laboratory, Los Angeles, pp: 443.
-
Prommool S, Jhangri GS, Cockfield SM, Halloran PF (2000) Time dependency of factors affecting renal allograft survival. J Am Soc Nephrol 11(3): 565-573.
-
Fuggle SV, Allen JE, Johnson RJ, Collett D, Mason PD, et al. (2010) Factors affecting graft and patient survival after live donor kidney transplantation in the UK. Transplantation 89(6): 694-701.
-
Issa N, Stephany B, Fatica R, Nurko S, Krishnamurthi V, et al. (2007) Donor factors influencing graft outcomes in live donor kidney transplantation. Transplantation 83(5): 593-539.
-
Noppakun K, Cosio FG, Dean PG, Taler SJ, Wauters R, et al. (2011) Living donor age and kidney transplant outcomes. American Journal of Transplantation 11(6): 1279-1286.
-
Tuttle-Newhall JE, Krishnan SM, Levy MF, McBride V, Orlowski JP, et al. (2009) Organ donation and utilization in the United States: 1998–2007. Am J Transplant 9(4): 879-893.
-
DSO (2000) Organ donation and transplantation in Germany. pp: 45-46.
-
Lee S, Kim J, Shin M, Kim E, Moon J, et al. (2010) Comparison of outcomes of living and deceased donor kidney grafts surviving longer than 5 years in Korea. Transplant Proc 42(3): 775-777.
-
Lowell JA, Brennan DC, Shenoy S, Hagerty D, Miller S, et al. (1996) Living-unrelated renal transplantation provides comparable results to living-related renal transplantation: a 12-year single-center experience. Surgery 119(5): 538-543.
-
Futagawa Y, Waki K, Gjertson DW, Terasaki PI (2005) Living-unrelated donors yield higher graft survival rates than parental donors. Transplantation 79(9): 1169-1174.
-
Mikhalski D, Wissing KM, Ghisdal L, Broeders N, Touly M, et al. (2008) Cold ischemia is a major determinant of acute rejection and renal graft survival in the modern era of immunsuppresion. Tansplantation 85(7): S3-9.
-
Pérez-Gutiérrez A, Morales-Buenrostro LE, Vilatobá- Chapa M, Mendoza-De-la-garza A, Vega-Vega O, et al. (2013) Risk factors for the development of delayed graft function in deceased donor in renal transplants. Rev Invest Clin 65(2): 109-115.
-
Kayler LK, Srinivas TR, Schold JD (2011) Influence of CIT-induced DGF on kidney transplant outcomes. Am J Transplant 11(12): 2657-2664.
-
Quiroga I, McShane P, Koo DD, Gray D, Friend PJ, et al. (2006) Major effects of delayed graft function and cold ischemia time on renal allograft survival. Nephrol Dial Transplant 21(6): 1689-1696.
-
Kyllönen LE, Salmela KT, Eklund BH, Halme LE, Höckerstedt KA, et al. (2000) Long term results of 1047 cadaveric kidney transplantations with special emphasis on initial graft function and rejection. Transplant Int 13(2): 122-128.
-
Sert I, Colak H, Tugmen C, Dogan SM, Karaca C (2014) The effect of cold ischemia time on delayed graft function and acute rejection in kidney transplantation. Saudi J Kidney Dis Transpl 25(5): 960-966.
- Reconstruction of Nasal Defect Using a Local Flap Based in the Nanoperforants Concept: A Case Report
- Transplant Tourism in Japan: Insights from Nationwide Surveys and Emerging Ethical Challenges
- The Challenge of Peritoneal Vaginoplasty in Transgender Women: Review Literature and Personal Perspectives
- Algorithmic Paternalism: Autonomy Versus Automation
- Dermatoscopy in Gorlin Syndrome: Avoiding the Disfigurement in Patients
- How Artificial Intelligence is Ushering in a New Era of Innovation in General and Plastic Surgery: A Short Communication