A RP-HPLC Method for Simultaneous Estimation of Vilanterol Trifenatate and Fluticasone Furoate in Dry Powder Inhalation Formulation
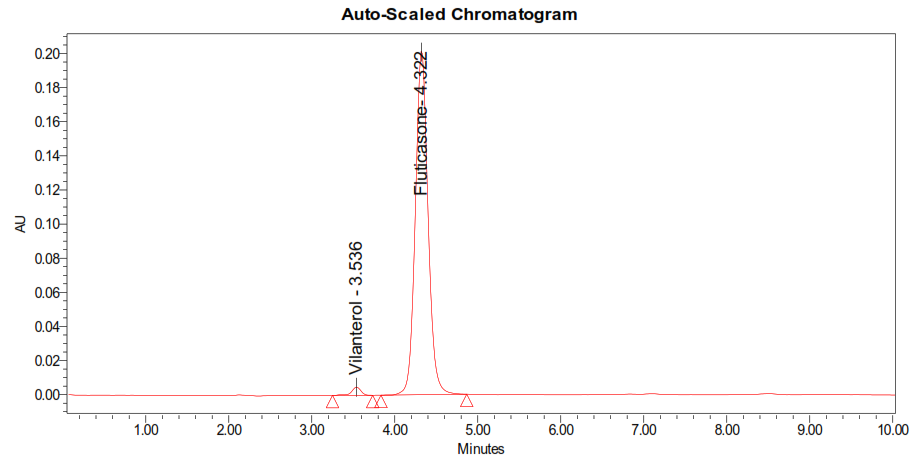
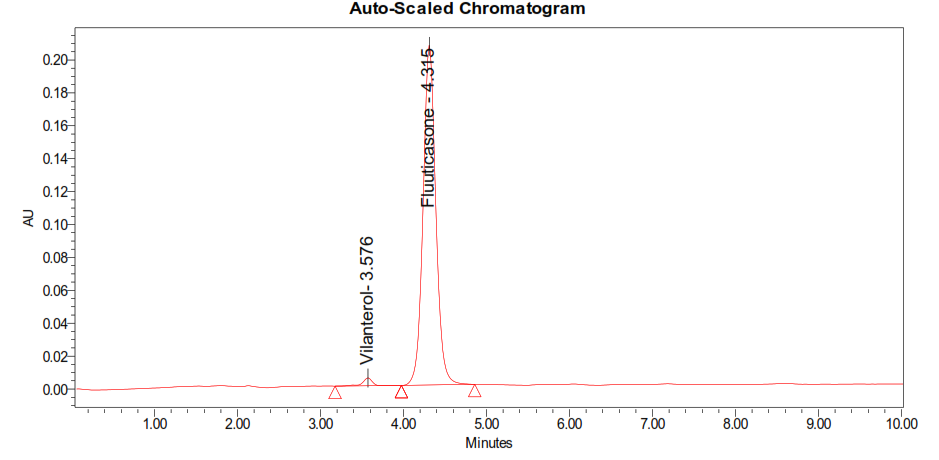
A novel RP-HPLC approach was developed for the synchronous estimation of Vilanterol and Fluticasone. To optimize chromatographic variables, a mobile phase consisting of methanol: ACN: phosphate buffer pH 7 (60:20:20% v/v) was employed with a stationary phase of a Water BEH X Bridge C18 column (250 mm × 4.6 mm, 5 μ) at a flow rate of 1 mL/min. The temperature of the column was maintained at 40°C, and the isosbestic point of these two drugs was detected at 280 nm. An isocratic elution, well-resolved excellent peak symmetry was obtained for both molecules in less than 10 minutes. The retention times of fluticasone furoate and vilanterol trifenatate were determined to be 4.232 and 3.539 minutes, respectively. The calibration curves were linear in concentration ranges of 50 μg-250 μg for vilanterol trifenatate and 5 μg-25 μg for fluticasone furoate, with mean % recoveries of 99–100%. The suggested method was validated in accordance with ICH Q2 (R1) guidelines. For vilanterol trifenatate, the limits of detection and quantitation are 0.39 and 0.7 μg/mL, while for fluticasone furoate, they are 1.18 and 2.12 μg/mL, respectively. As a result, the suggested RP-HPLC method was effective in quantifying the two-compound inhalation formulation.
Introduction
Vilanterol Trifenatate is chemically known as 4-[(1_R_)- 2-[6-[2-[(2,6-dichlorophenyl)methoxy]ethoxy]hexylamino]- 1-hydroxyethyl]-2-(hydroxymethyl)phenol;2,2,2] triphenylacetic acid (figure 1) and chemical name of Fluticasone furoate is [(6_S_,8_S_,9_R_,10_S_,11_S_,13_S_,14_S_,16_R_,17_R_)-6,9- difluoro-17-(fluoromethylsulfanylcarbonyl)-11-hydroxy- 10,13,16-trimethyl-3-oxo-6,7,8,11,12,14,15,16-octah- ydrocyclopenta[a]phenanthren-17-yl] furan-2-carboxylate (figure 2). The USFDA has approved a combined dosage form of both drugs, Vilanterol Trifenatate and Fluticasone furoate used for the treatment of chronic obstructive pulmonary disease (COPD), which includes asthma, emphysema, and chronic bronchitis [1]. Patients with COPD, particularly those with emphysema and chronic bronchitis, can benefit from long-term maintenance treatment for airway restriction using FFE, a synthetic trifluorinated corticosteroid with strong anti-inflammatory properties [2]. Additionally, it has been licensed to treat symptoms of nasal allergies, such as runny nose, congestion, itching, and sneezing [3, 4]. It works by suppressing the inflammatory responses that allergens and irritants in the air cause in the nasal passage. Once daily, VTL, a selective long-acting beta2-adrenergic agonist, is used to treat asthma and COPD [5, 6]. According to a review of the literature, a few high-performance liquid chromatographic methods have been established for the determination of fluticasone furoate and vilanterol trifenatate [7]. The aim of the present investigation is to develop an RP-HPLC method for the simultaneous quantification of VTL and FFE in pharmaceutical formulations, as there are only very few methods described for the analysis of these drugs [8, 9].
Materials and Methods
Chemicals and Standards Used
Water Merck HPLC grade, Methanol Merck HPLC grade, Acetonitrile Merck HPLC grade, Ortho phosphoric acid Merck L.R, KH2PO4 Merck L.R, 0. 22µ Nylon filter, Advanced lab HPLC grade 0.45µ filter paper Millipore HPLC grade.
Instruments Used
HPLC-auto sampler –PDA detector Acquity Model-2996 PDA Empower-software version-2 Waters U.V double beam spectrometer UV 3000+ U.V win software Lab India Digital weighing balance (sensitivity 5mg) ER 200A Ascoset pH meter AD 102U ADWA Sonicator SE60US Enertech.
| Trials | Column | Mobile phase ratio | Detection wavelength | Flow rate | Injection volume | Column temperature | Auto sampler temperature | Run time |
|---|---|---|---|---|---|---|---|---|
| Trial 1 | Agilent Eclipse XBD-C18 (4.6 x150mm),3µm | MeOH: H2O (70:30%v/v) | 280 nm | 1.0 ml/ min | 20µl | ambient | ambient | 20 min |
| Trial 2 | Agilent Eclipse XBD- C18(4.6x150mm),3µm | Methanol: pH 6.8 phosphate Buffer (70:30%v/v) | 280 nm | 1.0 ml/ min | 20µl | ambient | ambient | 6 min |
| Trial 3 | Waters BEH-C18 (4.6x150mm), 3.0 µm | methanol: pH 6.8 phosphate buffer (60:40 % v/v) | 280 nm | 1.0 ml/ min | 20µl | ambient | ambient | 10 min |
| Trial 4 | Waters BEH-C18 (4.6x150mm), 5.0 µm | Methanol: pH phosphate buffer (60:40% v/v) | 280 nm | 1.0 ml/ min | 20µl | ambient | ambient | 15 min |
| Trial 5 | Waters BEH C18 column (4.6×150mm), 3.0µm | Buffer: Methanol: ACN (20:60:20%v/v/v) | 280 nm | 1.0 ml/ min | 20µl | ambient | ambient | 10.0 min |
Table 1: Chromatographic trials for simultaneous estimation of Fluticasone and Vilanterol by RP- HPLC.
| Trials | Observation |
|---|---|
| Trial 1 | The trial shows only one peak in the chromatogram, so more trials were required for obtaining peaks. |
| Trial 2 | In this trial only Fluticasone peak was eluted, still more trials were required for both peaks. |
| Trial 3 | In this trial both Fluticasone and Vilanterol were eluted but there is no proper resolution. Still more trials were required for better resolution in peaks. |
| Trial 4 | The separation was good; peak shape was good; still more trials were required to reduce the retention times of peaks. |
| Trial 5 | The separation was good, peak shape was good, so we concluded that further trial was not required to reduce the retention times of peaks, so it was taken as final method. |
Table 2: Chromatographic trials and observations.
Preparation of Phosphate Buffer
Potassium dihydrogen phosphate (2.95 grams) and dipotassium phosphate (5.45 grams) were weighed, dissolved, and diluted to 1000 mL with HPLC water. The pH was then corrected to 3 using ortho phosphoric acid in a 1000 mL beaker. After being sonicated, the resultant solution was filtered.
Preparation of Mobile Phase
20 mL (30%) of the aforementioned buffer, 60 mL of methanol (HPLC grade-60%), and 20 mL of acetonitrile (20%) degassed in an ultrasonic water bath for five minutes. The substance through a 0.22 µ filter.
Preparation of the Fluticasone and Vilanterol Standard and Sample Solution
Standard Solution Preparation: A 100 mL clean dry volumetric flask containing 25 mg of working standard Vilanterol and 200 mg of Fluticasone was filled with diluent, which was sonicated to dissolve the material completely. The volume was then adjusted using the same solvent. Additionally, 1.5 mL of the stock solutions above was pipetted into a 10 ml volumetric flask and diluted with diluent.
Sample Solution Preparation: A 100 mL clean, dry volumetric flask was filled with an accurately weighed and transferred sample containing 200 mg of fluticasone and 25 mg of vilanterol. A diluent was added, and the mixture was sonicated to dissolve it entirely. The volume was then adjusted using the same solvent. Pipetting 1.5 ml of the stock solutions into a 10 ml volumetric flask, they were diluted with diluent until the desired level was reached.
System Suitability: After injecting 10 µL of both the standard and sample into the chromatographic system, the areas of the Vilanterol and Fluticasone peaks were measured, and the assay % was calculated using the formula. The tailing factor for the peaks in the standard solution resulting from vilanterol and fluticasone should not be greater than 1.5. It is recommended that the theoretical plates for the peaks of Vilanterol and Fluticasone in standard solution be a less than 2000.
Specificity
The system suitability for specificity was assessed in order to ascertain whether any contaminants are interfering with the analytical peak’s retention time. In order to achieve specificity, blank injections were made.
Linearity
Stock solution concentrations of 0.5 ml, 1.0 ml, 1.5 ml, 2 ml, and 2.5 ml were added to a 10 ml volumetric flask and diluted with diluent until the desired level was reached. The peak area was measured after each level was introduced into the chromatographic apparatus. Plot the peak area vs concentration on a graph with the concentration on the X-axis and the peak area on the Y-axis, then the correlation coefficient was calculated.
Range
The assay method is found to be precise, linear, and accurate for fluticasone and vilanterol in the range of 100 µg/ml-500 µg/ml and 12.5 µg/ml-62.5 µg/ml, respectively, based on data on precision, linearity, and accuracy were calculated.
Accuracy
The standard solution was injected to determine accuracy -50 %, accuracy -100 %, and accuracy -150 % concentrations. The amount added and amount found for fluticasone and vilanterol, as well as the mean and individual recovery values were determined. Each level’s recovery % should range from 98.0 to 102.0 %.
Precision
Repeatability
Six injections of the standard solution were introduced, and the area of each injection was measured in an HPLC. The % RSD for the area of five replicate injections was observed to be within the specified limits. The % RSD for the area of five standard injections results should not be more than 2.
Intermediate Precision/Ruggedness
Using different make columns of the same dimensions, precision was carried out on different days in order to assess the method intermediate precision, also referred to as ruggedness. Six injections of the standard solution were made, and the area of each injection was measured in an HPLC. It was observed that the % RSD for the five replicate injections were between the prescribed ranges. The findings of the five sample injections should have an RSD of no more than 2%.
Limit of Detection (LOD)
According to the formula, LOD can be determined using the standard deviation of the response (SD) and the slope of the calibration curve (S) at levels that approximate the LOD. The standard deviation of the y-intercepts of the regression can be used to calculate the standard deviation of the response lines.
Limit Of Quantification
LOQ can be calculated based on the standard deviation of the response (SD) and the slope of the calibration curve (S) according to the formula. Again, the standard deviation of the response can be determined based on the standard deviation of y-intercepts of regression lines.
Robustness
Deliberate alterations were made to the mobile phase composition and flow rate to assess the method robustness. The flow rate was varied at 0.9 ml/min to 1.1 ml/min. A standard solution containing 300 ppm of fluticasone and 37.5 ppm of vilanterol was prepared, and the method flow rate as well as different flow rates were used to analyze the results.
Results and Discussion
Method Development
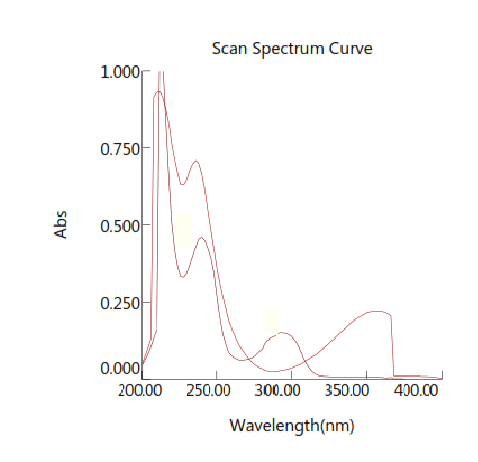
After dissolving the drug in mobile phase to achieve a concentration of 10µg/ml for both individual and combined standards, the detection wavelength was selected. The final solution was scanned in the 200–400 nm UV range. After obtaining the overlay spectra of Vilanterol and Fluticasone, the isobestic point of both substances revealed the maxima of absorbance at 280 nm. Table 3 represents optimized conditions and the spectrums are shown in Figure 3.
| Parameters | Optimized Method |
|---|---|
| Column | Water BEH X Bridge RP C18 4.6 ×150 mm 5.0 µm |
| Column temperature | Ambient |
| Wavelength | 280 nm |
| Mobile phase ratio | 60:20:20 methanol: ACN: phosphate buffer pH 7 |
| Flow rate | 1.0 ml/min |
| Auto sampler temperature | Ambient |
| Injection volume | 10 µl |
Table 3: Optimized chromatographic conditions for simultaneous estimations of Fluticasone and Vilanterol by RP-HPLC method. Opti
Specificity
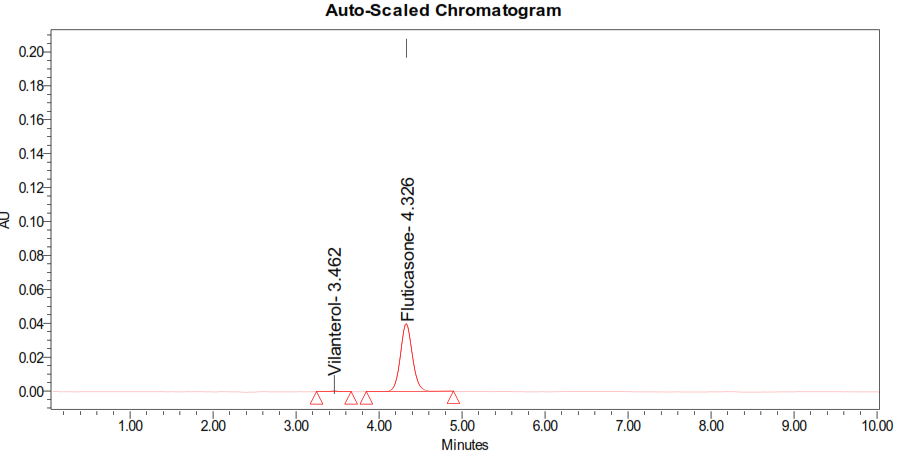
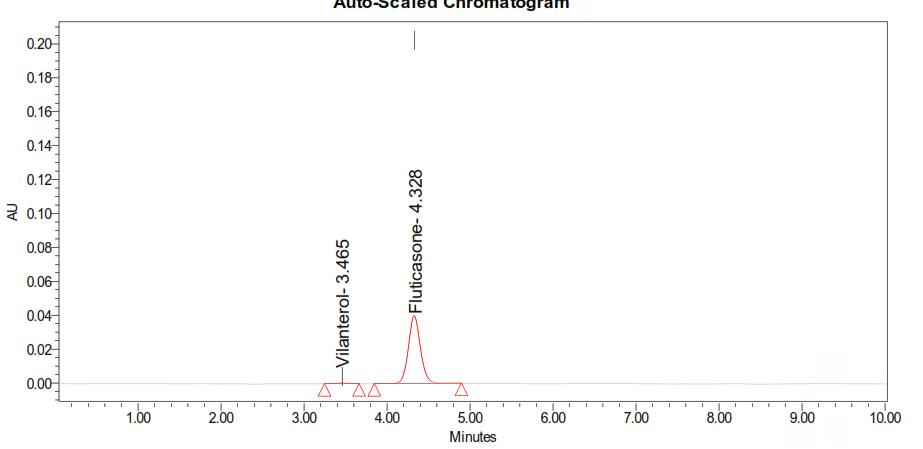
The system suitability of the method for specificity was assessed in order to determine whether any impurities are interfering with the analytical peak’s retention time. The study was performed by injecting blank. The chromatograms are shown in Figure 5 and Figure 6.
Linearity
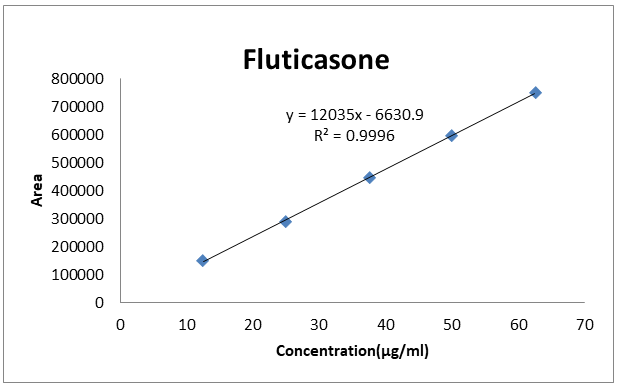
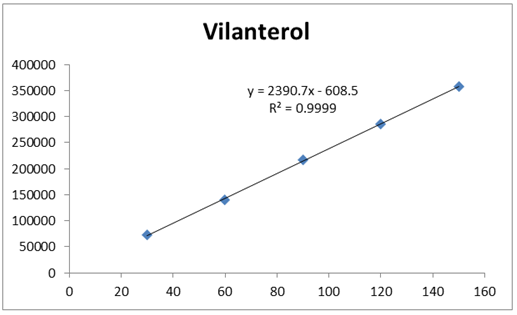
The linearity study was carried out at different concentrations of Fluticasone ranging from 100 ppm to 500 ppm and Vilanterol concentrations ranging from 12.5 ppm to 62.5 ppm. Each level was introduced into the chromatography system. The area of each level was utilized to calculate the correlation coefficient. The linearity investigation was performed for concentration range of 100 µg/ml -500 µg/ ml of Fluticasone and 12.5 µg/ml-62.5 µg/ml of Vilanterol. The correlation coefficient was determined to be 0.999 and 0.999. (NLT 0.999), respectively. The results are tabulated in Table 4 and Table 5. Calibration graph for FLU and VIL are shown in Figure 7 and Figure 8.
| S. No | Linearity Level | Concentration | Area |
|---|---|---|---|
| 1 | I | 12.5 | 148475 |
| 2 | II | 25 | 286753 |
| 3 | III | 37.5 | 445725 |
| 4 | IV | 50 | 596836 |
| 5 | V | 62.5 | 745622 |
| Correlation Coefficient | 0.999 |
Table 4: Linearity Results for Vilanterol.
| S. No | Linearity Level | Concentration | Area |
|---|---|---|---|
| 1 | I | 100 | 71914 |
| 2 | II | 200 | 140828 |
| 3 | III | 300 | 215732 |
| 4 | IV | 400 | 286753 |
| 5 | V | 500 | 357562 |
| Correlation Coefficient | 0.999 |
Table 5: Linearity Results for Fluticasone.
Accuracy
The accuracy study was conducted for Vilanterol and Fluticasone at 50%, 100%, and 150%. Three injections of each level were made into the chromatographic equipment. The % recovery was calculated using the area of each level. The results are tabulated in Table 6 and Table 7.
| %Concentration (at specification Level) | Area | Amount Added (mg) | Amount Found (mg) | % Recovery | Mean Recovery |
|---|---|---|---|---|---|
| 50% | 225703 | 12.5 | 12.59 | 100.69 | 100.39 |
| 100% | 448470 | 25 | 25.01 | 100.04 | |
| 150% | 675483 | 37.5 | 37.67 | 100.45 | |
| 50% | 109553 | 100 | 100.13 | 100.44 | 100.39 |
| 100% | 219229 | 200 | 200.3 | 100.5 | |
| 150% | 327988 | 300 | 300.21 | 100.24 |
Table 6: The accuracy results for Vilanterol.
Repeatability
The precision study was performed for five injections of Fluticasone and Vilanterol. Each standard injection was injected into the chromatography system. The area of each standard injection was utilized to calculate the % RSD. The precision study for the % RSD of Fluticasone and Vilanterol was determined to be 0.4 and 0.2, respectively (NMT 2). The results are summarized in Table 8.
| Injection | Area for Fluticasone | Area for Vilanterol |
|---|---|---|
| Injection-1 | 448662 | 218753 |
| Injection-2 | 446873 | 214829 |
| Injection-3 | 446352 | 216426 |
| Injection-4 | 447562 | 218452 |
| Injection-5 | 447529 | 216468 |
| Injection-6 | 446244 | 217567 |
| Average | 447203.7 | 217082.5 |
| Standard Deviation | 907.4 | 1468.9 |
| %RSD | 0.2 | 0.7 |
Table 7: Showing % RSD results for Fluticasone & Vilanterol.
Intermediate Precision/Ruggedness
| Injection | Area for Fluticasone | Area for Vilanterol |
|---|---|---|
| Injection-1 | 448776 | 218573 |
| Injection-2 | 445735 | 218562 |
| Injection-3 | 447673 | 214652 |
| Injection-4 | 448673 | 215354 |
| Injection-5 | 445876 | 216454 |
| Injection-6 | 448676 | 216457 |
| Average | 447568.2 | 216675.3 |
| Standard Deviation | 1424.2 | 1618.5 |
| %RSD | 0.3 | 0.7 |
Table 8: The results are summarized for Vilanterol and Fluticasone.
The intermediate precision study included six Fluticasone and Vilanterol injections. Each standard injection was injected into the chromatographic system. The % RSD was 0.2 & 0.7 The results are tabulated in Table 9.
LOD and LOQ
Three injections of the prepared LOD and LOQ solutions were injected, and the area of each injection was measured in an HPLC. It was discovered that the % RSD for the area of six replicate injections was between the specified range. The chromatograms are shown in Figure 9 and Figure 10.
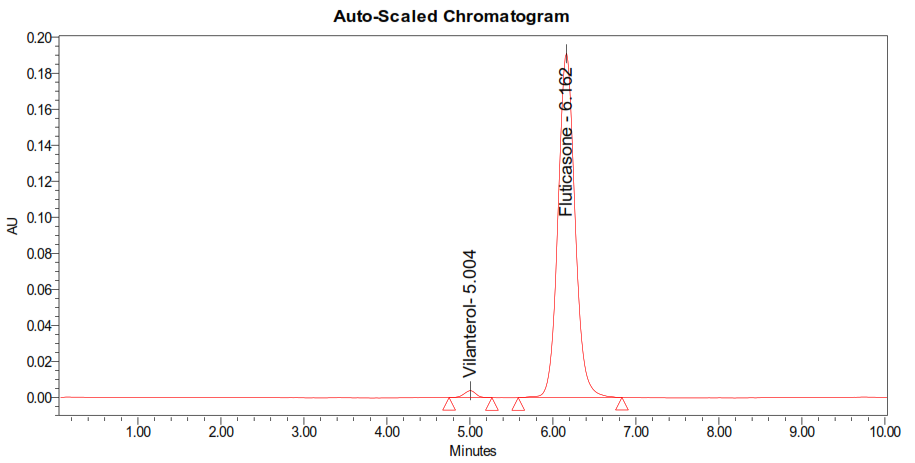
Robustness
Fluticasone and Vilanterol were tested for robustness at flow rates ranging from 0.4ml/min to 0.6ml/min and mobile phase ratios ranging from more organic phase to less organic phase. The method is robust in low flow conditions and can withstand a ±5% change in the mobile phase. The chromatograms are shown in Figures 11 and Figure 12, and the results are summarized in Tables 10 and Table 11. Based on the above results, it is possible to conclude that the variation in flow rate had a significant effect on the method. This indicates that the method is robust even with a change in flow rate of ±0.03ml/min. The method is only robust under low flow conditions.
| S. No | Flow Rate (ml/min) | System Suitability Results | ||
|---|---|---|---|---|
| USP Tailing | USP Plate Count | |||
| 1 | 0.9 | 1.46 | 4626.92 | |
| 2 | 1 | 1.46 | 4725.92 | |
| 3 | 1.1 | 1.46 | 4865.39 | |
| S. No | Change in Organic Composition in the Mobile Phase | System Suitability Results | ||
| USP Resolution | USP Tailing | USP Plate Count | ||
| 1 | 10% less | 3.37 | 1.29 | 6214.27 |
| 2 | *Actual | 3.18 | 1.29 | 6256.39 |
| 3 | 10% more | 2.96 | 1.29 | 6232.23 |
Table 11: System suitability results for Fluticasone.
| S. No | Flow Rate (ml/min) | System Suitability Results | ||
|---|---|---|---|---|
| USP Resolution | USP Tailing | USP Plate Count | ||
| 1 | 0.9 | 3.31 | 1.29 | 6132.29 |
| 2 | 1 | 3.18 | 1.29 | 6256.39 |
| 3 | 1.1 | 3.02 | 1.29 | 6352.29 |
Table 9: System suitability results for Vilanterol.

On evaluation of the above results, it can be concluded that the variation in±5%. Organic composition in the mobile phase affected the method significantly. Hence it indicates that the method is robust even by change in the mobile phase ±5%. The chromatograms are shown in Fig. No. 13 & 14 and results are tabulated in Table 12 and Table 13.
| S. No | Change in Organic Composition in the Mobile Phase | System Suitability Results | |
|---|---|---|---|
| USP Plate Count | USP Tailing | ||
| 1 | 10% less | 1.46 | 4762.23 |
| 2 | *Actual | 1.46 | 4725.92 |
| 3 | 10% more | 1.46 | 4767.76 |
Table 10: System suitability results for Fluticasone.
Discussion
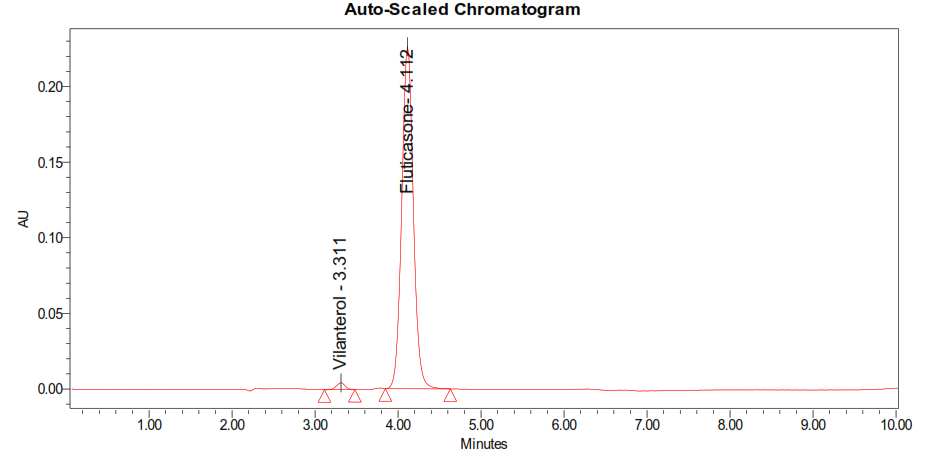
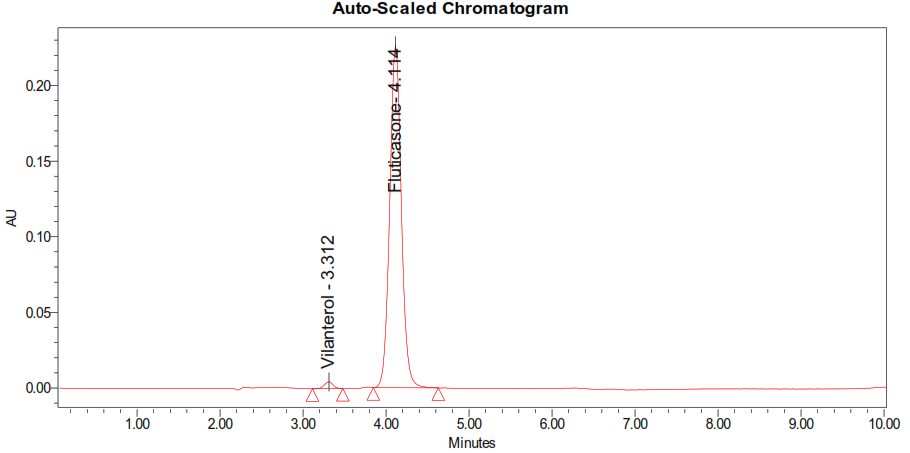
A new method for their simultaneous estimation was established using the RP-HPLC method. Vilanterol and Fluticasone % purity was determined to be 103.39 % and 104.4 %, respectively and the chromatographic conditions were successfully developed for the separation of Vilanterol and Fluticasone by using a Waters BEH C18 column (4.6×150mm) 5µm, flow rate of 1.0 ml/min, mobile phase ratio of 60:20:20 methanol: ACN: phosphate buffer pH 7, detection wavelength was 280 nm. The instrument used was WATERS HPLC Auto Sampler, Acquity module, photo diode array detector 2996, and Empower-software version 2. The retention times were found to be 3.539 mins and 4.232 mins, respectively. The resolution was found to be 10.18, and the system suitability characteristics for Vilanterol and Fluticasone, such as theoretical plates and tailing factor, were found to be 993, 1.23, and 5775, 1.12. In compliance with ICH criteria, the analytical method was verified (ICH, Q2 (R1)). Vilanterol and Fluticasone’s linearity investigation revealed that their concentration ranges were 50 µg–250 µg and 5 µg–25 µg, respectively. The correlation coefficient (r2) was determined to be 0.999 and 0.999, and the recovery % were 99.56% and 99.48%. The repeatability RSD was 0.1 and 1.4 percent. The % RSD values for Intermediate Precision Analyst 1 and Analyst 2 were 0.5 and 0.6 and 0.8 and 0.3, respectively. Precision, robustness, and reproducibility were the focus of the precision investigation. The LOQ values were 1.18 and 2.12, while the LOD values were 0.39 and 0.7.
Conclusion
The new method for separating Fluticasone and Vilanterol was found to take less time and cost-effective than reported methods. The previous methods were developed in tri ethyl amine, whereas the current method was developed in phosphate buffer; the separation between two peaks is much better than the reported methods. Compared to the existing method, buffer preparation is simpler. The validation also shows that all parameters are within their limits. For the routine analysis of Vilanterol and Fluticasone in API and pharmaceutical dosage form, the recommended RP-HPLC method can therefore be utilized.
References
-
Malerba M, Radaeli A, Montuschi P, Morjaria JB (2016) Vilanterol trifenatate for the treatment of COPD. Expert Rev Respir Med 10(7): 719-731.
-
Gray EL, Chang V, Thomas PS (2016) Fluticasone furoate and vilanterol trifenatate combination therapy for the treatment of asthma. Expert Rev Respir Med 10(8): 839- 847.
-
Guo Y, Yang Y, Peng J, Zhu X, Ji Z, et al. (2019) Enantiomeric separation of vilanterol trifenatate by chiral liquid chromatography. Chirality 31(10): 813-817.
-
Yadav S, Jain V, Magar H, Kumar MV, Warde S, et al. (2023) A Novel RP-HPLC Method for Simultaneous Estimation of Vilanterol Trifenatate, Umeclidinium Bromide and Fluticasone Furoate in Inhalation Dry Powder Formulation. J Chromatogr Sci 61(10): 075.
-
Valizadeh M, Braki ZA, Smiley E, Arghand A, Dastafkan P, et al. (2023) Simultaneous Quantitative Analysis of Salmeterol and Fluticasone in Inhalation Spray Using HPLC and a Fast Spectrophotometric Technique Combined with a Time Series Neural Network and Multivariate Calibration Methods_._ Journal of AOAC International 106(4): 1109-1117.
-
Masimukku SK, Chintala R (2018) Development and validation of stability indicating RP-HPLC method for fluticasone furoate and vilanterol in pharmaceutical formulations. Indian Drugs 55(3): 27-31.
-
Valizadeh M, Sohrabi MR, Motiee F (2021) Simple spectrophotometric method for simultaneous determination of salmeterol and fluticasone as anti- asthma drugs in inhalation spray based on artificial neural network and support vector regression. Optik 240: 166879.
-
Patel B, Patel S (2023) Simultaneous quantification of Fluticasone propionate and Olopatadine hydrochloride by High-performance thin-layer. chromatography 6(9): 2300070.
-
Babu GR, Sowjanya M, Ramayyappa M, Karishma MDA, Bharathi V, et al. (2023) Rapid RP-HPLC Method for Simultaneous estimation of Umeclidinium and Vilanterol in human plasma. Research Journal of Pharmacy and Technology 16(3): 1017-1022.
- Potential Medicinal Herbs and Secondary Metabolites in Combating Corona Virus
- Monkeypox and its Clinical Implications in Pregnancy
- Pharmacognostical Analysis of the Leaves of Important Nervine Medicinal Plant: Strychnos Nux-Vomica L
- Assessment of Antibacterial Activity of Various Solvent Extracts of Dictyota Dichotoma Against Multidrug Resistant Bacterial Strain
- An Insights of Bioactive Elements on Malignancy: Mechanistic Avenues
- Advances and Future Directions in Pharmacognosy and Chinese Medicine