Atmospheric Pressure and its Impact on COVID-19 Cases in Villa Clara, Cuba
There are a large number of natural and even social phenomena in nature, whose occurrences, evolution and final result depend on several independent variables. Even though all these variables intervene in the phenomenon, some are more important than others and even the interrelation between them plays a very important role. The intervention of several independent variables makes the prediction of the occurrence of a natural phenomenon difficult to quantify. Predictive techniques have been developed both in the study of natural phenomena and in social phenomena, each with its scope and limitations.
Opinion
There are a large number of natural and even social phenomena in nature, whose occurrences, evolution and final result depend on several independent variables. Even though all these variables intervene in the phenomenon, some are more important than others and even the interrelation between them plays a very important role. The intervention of several independent variables makes the prediction of the occurrence of a natural phenomenon difficult to quantify. Predictive techniques have been developed both in the study of natural phenomena and in social phenomena, each with its scope and limitations.
Currently there are several methods to predict the occurrence of some phenomenon or result, which are included in the predictive analysis. Predictive analytics is a subdiscipline of data analysis that uses statistical techniques, such as machine learning or data “mining,” to develop models that predict future events or behaviors. These predictive models allow you to take advantage of behavior patterns found in current and historical data to identify risks. This type of analysis is based on the identification of relationships between variables in past events, in order to later exploit these relationships and predict possible results in future Opinion situations. Doing this is not easy since it must be taken into account that the precision of the results obtained depends a lot on how the data analysis has been carried out, as well as on the quality of the assumptions.
On the trivial level, it might seem that predictive analytics is the same as forecasting (which makes predictions at a macroscopic level), but no, it’s something else entirely. In a crude example, while a forecast can predict how many hurricanes may form in a year, predictive analytics can indicate what intensity and what time of year they are most likely to form, and even where.
Therefore, to carry out predictive analysis it is essential to have a large amount of data, both current and past, in order to establish behavior patterns and thus induce knowledge. In the example above, there is more probability of prediction if you also consider variations in regional and global temperature, wind direction, changes and sources of change in pressures etc. This process is done thanks to computational learning. Computers can “learn” autonomously and thus develop new knowledge and capabilities, for this it is necessary to have large databases and predictive analysis tools.
There are currently several techniques applicable to predictive analysis; i) regression, which includes linear, non-linear, and multivariable adaptive regression; support vectors, ii) computational learning, which includes neural networks, Naïve Bayes and K-nearest neighbors. One of these tools is the Regressive Objective Regression method that we will explain briefly later. Various applications are included in the bibliography, and the idea is to extend this type of analysis to social and epidemiological phenomena such as the COVID-19 epidemic in Santa Clara, Cuba using atmospheric pressure as an exogenous variable.
Some of the most important natural phenomena that we would like to be able to predict, in order to minimize their economic and health impact are, for example, earthquakes and hurricanes, the proliferation of infections caused by various viruses or diseases, among which is SARS- COV-2, and in certain regions of the planet the proliferation of viral diseases transmitted by mosquitoes, or bacteria transmitted by rodents, etc. Each of these natural and/or biological phenomena are caused by various factors that affect rapid or slow proliferation. Furthermore, each region of the planet is an extremely complex macrosystem, so variables that could play an important role in its prediction in one region may change in another. The present work is dedicated to the application of ROR for some of the phenomena mentioned above.
Regression analysis is the most widely used statistical technique to investigate or estimate the relationship between dependent variables and a set of independent explanatory variables. In our environment, the ROR methodology has allowed mathematical modeling the larval densities of mosquitoes, b) the population dynamics of mollusks, c) the modeling of infectious entities of different etiologies, such as HIV/AIDS, Cholera, Influenza, Acute Respiratory Infections (ARI), Covid-19, Acute Bronchial Asthma Crisis (CAAB), Fasciolosis, Angiostrongylosis and even, d) in the estimation of the longitude and area of the universe, monthly forecast of precipitations and extreme temperatures, e) forecast of meteorological disturbances (cold fronts, and hurricanes, latitude prediction and length of earthquakes, search for information in white noises modeling of the Equivalent Effective Temperature (TEE) and Atmospheric Pressure ( PA) h) up to the electricity consumption of a municipality or province, and more recently in the COVID-19 pandemic.
Next, a ROR model to predict the number of new cases of Covid-19 in Villa Clara Cuba by measuring the impact of vaccination at the country level and the impact of atmospheric pressure at sea level, we hope that this model can bring some clarity to the study of this disease. The model explains 90% of the cases with an error of 127 cases, the Durbin Watson statistic is small, so the model admits new variables that could measure the impact, for now we will analyze vaccination and atmospheric pressure (Table 1).
| Model | R | R squaredb | Adjusted R squared | Standard error of the estimate | Durbin-Watson |
|---|---|---|---|---|---|
| 1 | .900a | 0.81 | 0.807 | 127.4840148 | 0.526 |
Table 1: Summary of the modelc, d.
a. Predictors: PRE_2_mean, Unstandardized Predicted Value, DS, Lag105SP b. For regression through the origin (the no-intercept model), R-squared measures the proportion of the variability in the dependent variable about the origin explained by the regression. This CANNOT be compared to the R-squared for models that include intercept.
c. Dependent variable: Sum Prov.
d. Linear regression through the origin Table 1: Summary of the modelc, d.
This model depends on the number of cases returned in 105 days that corresponds to the National data for Cuba. The mathematical effect of vaccination is small but 100% significant, this may be due to the fact that the vaccination data that we were able to obtain correspond to the nation and not to the province, despite this difficulty we decided to include them, the cases of Covid-19 depend on the Atmospheric Pressure in the Yabú station as it increases, the cases of Covid increase , with an increase of 1000 hPa the cases can increase by 184 cases, we know that the increase in cases depends on contagion, which does not mean that the virus may be affected by atmospheric pressure and favor or not its incidence in people.
Finally, a plot of the predicted cases against the real ones is made and the forecast is displayed until February 24, 2022, apparently there may be an increase in cases, reaching 1000 cases, which would bring a new pandemic outbreak, it is because of this means that strict measures must be taken at airports and continue with the mouth mask and avoiding crowds (Figure 1).
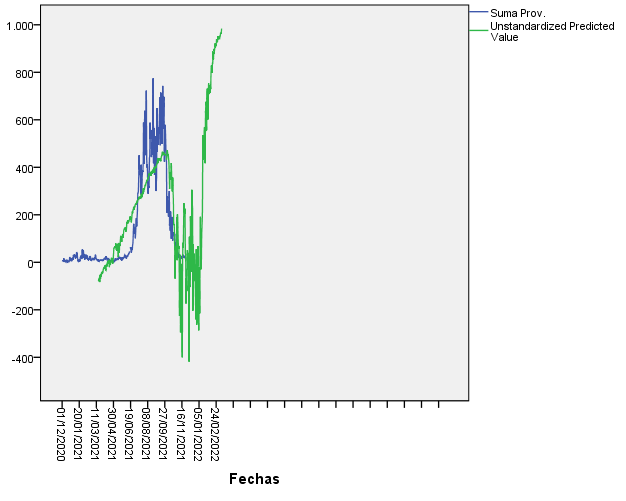
It is concluded that, the model explains 90% of the cases with an error of 127 cases. This model depends on the number of cases returned in 105 days. The cases of Covid-19 depend on the Atmospheric Pressure in the Yabú station as it increases, the cases of Covid increase. With an increase of
1000 hPa the cases can increase by 184 cases. There may be an increase in cases, reaching 1000 cases, which would bring a new pandemic outbreak, which is why strict measures must be taken at airports and continue with the use of masks and avoiding crowds.
- Mitochondrial Bio-Logistics: Steering Co-Enzyme Q10 and Lycopene Synergies within the Science 4.0 Bio-OS Framework
- Hymenoptera Specimens from the Caño Negro Wetland, of the National Museum Collection, Costa Rica
- Science 4.0: Comprehensive Architecture of the Biological Operating System (Bio-OS) A Framework for Systemic Resilience and Industrialized Bio-Governance
- Rabbit on, or Hare Back? Understanding Climate Change
- Clinical Validation of Science 4.0: Flow Steering and Epigenetic Drift Inversion on a 76-Year-Old Hybrid System
- Seeds Planted by another Mind