Expression of TNF-Α and IL-1β Messenger RNA in Stem Cells of Normotrophic and Hypertrophic Scars
Introduction: Post-burn hypertrophic scar tissue (Hsc) is characterized by increased collagen synthesis, cellular growth (hyperplasia) and cell turnover (shedding). Its clinical characteristics (erythema, pain, dysesthesia, pruritus, elevation) exhibit aspects of chronic local inflammation, but the mechanism of its etiopathogenesis has not been clearly elucidated. In chronic skin inflammation, pro inflammatory and profibrogenic cytokines play an important role in producing skin dysfunction. In this study, we examined changes in tumor necrosis factor (TNF)-α and interleukin (IL)-1 β mRNA expression and its presence in post-burn hypertrophic scars in stem cells. Results obtained in normotrophic scar tissue (Nsc) were compared to results obtained in normal skin (Ns). Materials and Methods: Skin biopsies were obtained from 15 patients with (Hsc) who presented burns on over 10% of their skin surface, more than a year post-injury. Nsc was obtained from 17 patients who experienced scarring in optimal conditions. Ns were obtained from 11 patients who underwent cosmetic or reconstructive surgery. We performed histopathology analysis with routine processing. TNF-α and IL-1β mRNA expression levels on all three types of biopsy were obtained via semi-quantitative RT-PCR, RT-qPCR, western blot and by in situ hybridization. Results: When analyzing mRNA expression levels by semi-quantitative RT-PCR, and qPCR we observed higher TNF-α and IL-1β levels in post-burn hypertrophic scar tissue relative to normal skin and normotrophic scar tissue. In contrast, in situ hybridization revealed significant differences in IL-1β hybridization intensity localized in Hsc epidermis relative to Nsc and Ns epidermis. For TNF-α, expression intensity in epidermis and dermis did not differ between Ns, Nsc and Hsc. Wefound higher TNF-α-positive porcentage of cells in the epidermis of Ns and Hsc relative to Nsc; meanwhile IL-1β-positive percentage of cells were higher in the epidermis of Hsc as compared to Ns and Nsc. Our histopathologic analysis yielded relatively low inflammatory infiltrate cell counts, and we found no correlation between inflammatory infiltrate cell count and cytokines produced. Conclusion: Together these results suggest that there is increase in TNF-α and IL-1β mRNA expression in post-burn Hsc. Interestingly, the basal keratinocytes (stem cells) showed differential expression of both cytokines compared to other cell types, which suggests that they may play an important role in post-burn skin repair processes.
Gamaliel5
Potosi, Mexico
(Nsc) were compared to results obtained in normal skin (Ns).
were obtained via semi-quantitative RT-PCR, RT-qPCR, western blot and by in situ hybridization.
found higher TNF-α-positive porcentage of cells in the epidermis of Ns and Hsc relative to Nsc; meanwhile IL-1β-positive percentage of cells were higher in the epidermis of Hsc as compared to Ns and Nsc. Our histopathologic analysis yielded relatively low inflammatory infiltrate cell counts, and we found no correlation between inflammatory infiltrate cell count and cytokines produced.
Conclusion: Together these results suggest that there is increase in TNF-α and IL-1β mRNA expression in post-burn Hsc.
Interestingly, the basal keratinocytes (stem cells) showed differential expression of both cytokines compared to other cell types, which suggests that they may play an important role in post-burn skin repair processes.
Keywords: Burns; Inflammation; Collagen; Keratinocytes; Proinflammatory Cytokines Abbreviations: TNF-α: Tumor Necrosis Factor Alpha; IL-1β: Interleukin 1 Beta; Hsc: Hypertrophic Scars; Nsc: Normotrophic Scars; Ns: Normal Skin; PDGF: Platelet- Derived Growth Factor; FGF: Fibroblastic Growth Factor; TGF-β: Transforming Growth Factor Beta.
Introduction
Burns constitute a high-interest research area due to the skin’s physiological importance. Burns can create scars that have psychological, functional and aesthetic consequences and dramatically influence a patient’s quality of life [1]. The most commonly used method of diagnosing pathological scars is clinical examination. Laboratory analysis and available instrumentation are not capable of predicting the evolution, duration and end result of scars. Histological, immunological and biochemical studies have enabled us to understand new concepts in the etiopathogenesis of scars; in the future, the combination of basic data with clinical information will lead to further advances in the prevention, resolution and treatment of pathological scars.
In the 1990s, the Muir, et al. [2] proposed a classification scheme for hypertrophic scars based on clinical criteria and related to scar evolution times. Later, Magliacani, et al. [3] proposed a new classification based on clinical criteria, but also including contraction and tissue atrophy, and further categorizing hypertrophic scars as active (AHS; active hypertrophic scars) or in remission (RHS; remission hypertrophic scars). This classification continues to be one of the most frequently used.
It has been suggested that, among other important characteristics for determining the state of activation of a scar, the number of T lymphocytes and macrophages found in the inflammatory infiltrate are determinants in scar development [4, 5, 6, 7]. Likewise, a correlation has been hypothesized between the quantity and function of immune cells in the inflammatory infiltrate, their activity, and fibroblast to myofibroblast differentiation via the production and expression of different cytokines that influence the development of pathological scars [8, 9, 10, 11, 12] and result in irreversible changes to tissue architecture [13, 14].
The post-burn hypertrophic scar (Hsc) is characterized by increased collagen synthesis, higher cellular growth (hyperplasia), and increased cell turnover (shedding, as dead cells are replaced by younger cells) [1]. Its clinical characteristics (erythema, pain, dysesthesia, pruritus, elevation) exhibit aspects of chronic local inflammation, but the mechanism of etiopathogenesis has yet to be clearly elucidated [3].
The overproduction of collagen fibers is the most salient characteristic of this type of skin disorder; some well-known cytokines such as IL-1β, TNF-α, PDGF, FGF and TGF-β directly trigger the proliferation of fibroblasts and/or stimulate the production of conjunctive tissue [15, 16, 17]. These cytokines are produced primarily by activated macrophages, but some are also produced by other cell types such as lymphocytes, endothelial cells, and the fibroblasts themselves.
Specifically, the tumor necrosis factor (TNF)-α regulates a great number of cellular responses such as scarring, proliferation, differentiation, inflammation and death. TNF-α is present in two forms: as a 26-kDa membrane protein (mTNF) and as a 17-kDa soluble protein (sTNF), derived from the membrane form by proteolytic liberation via the TNF-α converting enzyme (TACE) [18]. To perform its biological function, TNF-α attaches to Type I (TNFR1, 55-kDa) and Type II (TNFR2,
75-kDa) receptors which recruit proteins that can activate different signaling pathways [19]. Through its cytoplasmic death domains, TNFR1 recruits TNFR1- associated death domain protein (TRADD) and TNF receptor-associated factor 2 (TRAF-2), then activates the mitogen-activated protein (MAP) kinase pathway [20].
The cytokine interleukin (IL)-1β mediates immune regulation and inflammatory response, including regulation of scarring, growth, differentiation and various metabolic processes. It is produced primarily by activated macrophages, but is also expressed in B and T lymphocytes, as well as epithelial, endothelial and mesenchymal cells [21, 22]. IL-1β is generated as a precursor, pro-IL-1β, and converted to its mature form by the IL-1β converting enzyme (ICE or caspase-1). It is thought that IL-1β is only active as a mature protein. It joins with IL-1 receptor, type I (IL-1R1) and the IL-1R accessory protein (AcP) which together form the receptor signaling complex. IL-1R heterodimerizes and recruits MyD88, and this complex joins with toll interacting protein (TOLLIP), IL-1R-associated kinase (IRAK) and IRAK4. The proximity of these molecules to the receptor facilitates interaction through association of their death domains. The signaling involves the receptor joining TNF receptor-associated factor (TRAF)6, activating MAP kinases (TAK1, MKK6) and subsequently triggering activation of NFκB, JNK and p38 [23].
It has been demonstrated that IL-1β cooperates with TNF-α, in spite of structural differences, to execute certain processes, such as control of collagen synthesis [24, 25, 26]. In this study, we examined the expression and tissue localization of TNF-α and IL-1β mRNA in post-burn Hsc. We compared the results to those obtained in normotrophic scars (Nsc) and normal skin (Ns) using semi-quantitative RT-PCR, RT-qPCR, western blot and in situ hybridization. We also assessed whether expression of TNF-α and IL-1β mRNA correlates with porcentage of cells in the inflammatory infiltrate and in the tissue.
Materials and Methods
Patients
Hypertrophic scars were classified by their histopathology into active (AHS) or in remission (RHS) based on the infiltrated immune cell counts [4, 11, 27]; we found that our classification did not necessarily correlate with the classification based on clinical characteristics [3]. Hypertrophic scar tissue was obtained with patient consent; 15 patients presented post-burn Hsc after having at least 10% body surface area burned (BSAB) following at least one year of evolution (Table 1).
Nsc specimens were obtained from 17 patients whose lesions healed optimally. Ns biopsies were obtained from 11 patients who underwent cosmetic surgery procedures. None of the patients had evidence of infection or any type of cancer. And none had been treated with Immuno modulators within three months prior to surgery.
| Normal Skin | Normotrophic scars | Hypertrophic scars | |||||||||
|---|---|---|---|---|---|---|---|---|---|---|---|
| Features | |||||||||||
| Ns | Nsc | Hsc | |||||||||
| Number of patients | 11 | 17 | 15 | ||||||||
| Age (years) | 26 (4-54) | 14(3-37) | 15(4-22) | ||||||||
| Male / Female | 4:07 | 3:14 | 8:07 | ||||||||
| Time of scars | -------------- | > 1 year | > 1 year |
Table 1: Clinical features of patients.
Light Microscopy in Skin Tissue
We placed the biopsies in SafeFix ® fixative for 24 hours, routinely processed them and embedded them in Paraplast ® at 56°C. The tissue sections (5 μm thick) were stained with hematoxylin-eosin, and were examined by dermatopathology specialists at Mexico General Hospital. Analyses were conducted to assess the following parameters: density, composition and location of inflammatory infiltrate (perivascular, periadnexal, perineural or interstitial); presence of hemorrhaging; vascular changes (dilation, necrosis, thrombosis);
cutaneous appendices (pilous follicles, sudoriferous glands); alterations (necrosis, spongiosis); and dermal edema, fibrosis or sclerosis.
RNA Preparation
RNA was extracted from tissue samples previously stored in AM7020 RNAlater ® (Applied Biosystems) via the Tripure ® method (11667165001, Roche Applied Science). Prepared RNA sample quality was analyzed with NanoDrop ® and Bioanalyzer ® (Agilent Technologies).
cDNA Synthesis
Total RNA was transcribed to complementary DNA (cDNA) according to the SuperScript First-Strand Synthesis System for RT-PCR protocol (Catalog No. 11904-018, Invitrogen). Briefly, 1 μg of total RNA, 1 μl dNTPs mix, 1 μl Oligo(dT)12-18 (0.5 μg/μl) were brought to a final volume of 10 μl with DEPC-treated water. The mixture was pre-incubated for 5 min at 65°C, and chilled on ice for 5 min. We added 2 μl 10x RT buffer, 4 μl 25 mM MgCl2, 2 μl 0.1 M DTT, 1 μl RNAse inhibitor, and incubated at 42°C for 2 min. We then added 1 μl SuperScript® II RT to each tube, mixed and incubated the mixture at 42°C for 50 min, completing the reaction at 70°C for 15 min. We collected reaction material after brief centrifugation at 4°C. Finally, we added 1 μl of RNase H to each tube and incubated for 20 min at 37°C before proceeding to blank DNA amplification.
Polymerase Chain Reaction (PCR)
Five microliters of cDNA were amplified with TNF-α, IL-1β and β-actin oligonucleotides in a Palm-Cycler® thermal cycler (Corbett Life Science CG1-96) in a total volume of 50 μl containing 5 μl 10X PCR buffer, 1.5 μl 50 mM MgCl2, 1 μl 10 mM dNTP mix, 1 μl sense oligonucleotide at 10 mM concentration, 1 μl antisense oligonucleotide at 10 mM concentration, 0.3 μl Taq DNA polymerase (5 units/μl), 5 μl complementary DNA (from the earlier reaction) and lastly 35.2 μl DEPC-treated water. The TNF-α oligonucleotides (GenBank accession number NM_000594) were the following: sense CCTGTAGCCCATGTTGTAGCAA and antisense CCTTGGTCTGGTAGGAGACG, (TIB, MOL BIOL, LLC). There were 35 amplification cycles with the following characteristics: 94°C for 2 min, (94°C for 30 s, 61°C for 1 min, 68°C for 1 min), 68°C for 7 min.
The IL-1β oligonucleotides (GenBank accession number NM_000576) were the following: sense CTGTCCTGCGTGTTGAAAGA and antisense GAAGTCAGTTATATCCTGGC. PCR conditions for IL-1β were 94°C for 2min, (95°C for 1 min, 50°C for 1 min, 72°C for 5 min), with a 10-min post-extension period at 72°C. Thirty-five PCR cycles were also performed in this case.
The following oligonucleotides were utilized for β- actin (GenBank accession number NM_001101): sense CCAAGGCCAACCGCGAGAAGATGAC and antisense AGGGTACATGGTGGTGCCGCCAGAC. There were 35 amplification cycles for β-actin with the following characteristics: 94°C for 2min, (94°C for 30sec, 66°C for 30sec, 68°C for 1min), 68°C for 7min.
The amplified samples were run through electrophoresis in 2% agarose gel; the PCR products were stained with 2.5 μl GelRed® (41002, Biotium). Gel photographs were taken with an ultraviolet light transilluminator coupled to a computer running Dolphin- 1D® software (Wealtec). Densitometry was performed according to the parameters established by the software.
Quantitative Polymerase Chain Reaction (qPCR)
To evaluate the level of gene expression by real-time PCR with SYBR Green dye was applied. The Piko Real (Thermo Fisher Scientific) equipment for reaction monitoring was used. β actin gene was used as internal control. The PCR reaction was performed in 20 μl final volume using 96-well plates. The reaction mixture contained 10 μl Syber Green SuperMix, 100 nM of each primer (forward and reverse) and 1 μl cDNA. All samples were run in duplicate. Each sample was normalized on the basis of its β actin.
Statistical Analysis for qPCR
TNF α and IL-1 β staining scores follow an ordinal scale. Data followed a parametric distribution and were shown as means ± SD. We used one-way analysis of variance (ANOVA) and the Tukeys test post hoc for multiple comparisons. Statistical analyses were performed using excel and GraphPad Software, Prism 8.0 (GraphPad Software, San Diego, CA, USA). Differences were considered as statistically significant whenever a P value < 0.05 occurred.
Analysis of TNF-α and IL-1β Expression via In Situ Hybridization
Skin biopsy tissue samples were cut into multiple 5- μm sections under conditions DNase and RNase-free, collected on treated thin films, and each probe hybridized separately. We used oligonucleotides complementary to human TNF-α (GeneDetect Company, GD1177-OP), human IL-1β (GD1104-OP) and control (GD5000-OP). We used an in situ hybridization protocol published on the GeneDetect Company website.
Briefly, we used the following procedure: Tissue sections were deparaffinized with xylene and graduated alcohols (100%, 95% and 50%) and placed in 0.2 N HCl (Merck 10114) at room temperature to remove basic proteins. The samples were washed with distilled water and subjected to enzymatic digestion with proteinase K (1 μg/ml, Sigma 2308) in 0.05 M Tris-HCl, (Sigma, T1535), pH 7.4 for 5 min at room temperature. The sections were again washed with distilled water, that had been treated with 0.1% diethyl pyrocarbonate (DEPC, Fluka, 32490), for 5 min [28]. The thin films were transferred to freshly prepared 0.1 M TEA buffer (Sigma T1377) with acetic anhydride (Sigma, A6404) for 5 min. The equilibrium solution consisted of formamide 100% (Promega H5052), 2 M NaCl, 1 M Tris‐HCl (pH 7.4), 0.5 M EDTA, 1.59 M DTT (Sigma, D8906), 52 μg/μl heparin (BioChemika, 51550) in DEPC-treated water (Invitrogen 750023); 50× Denhardt’s Solution (Sigma D2532); tRNA (Sigma, R5636), 10% dextran sulfate (Sigma, D8906), and 500 μg/ml denatured salmon sperm DNA (Sigma, 15632‐011). Lastly, DTT was added to the prehybridization solution (final concentration 10 mM). Hybridization temperature in all cases was 35°C.
The following day the samples were washed in high astringency conditions (sequentially in 2x citrate buffer and in 100 mM Tris-HCl, 150 mM NaCl (pH 7.5) to reduce background noise and non-specific hybridization signals [29]. Final detection was performed according to the reagent supplier’s instructions (Rembrandt® Cat. no. HKD47). Briefly, 2 to 3 drops of the conjugated antibody were added to the thin films, which were then incubated overnight at 4°C and washed with deionized water. A 1X aminoethylcarbazol (AEC; Sigma A6926) working solution was applied and the thin films were again incubated for 5 to 15min. They were counterstained with hematoxylin for 5 to 10 min. The sections were mounted for microscopic evaluation, photographed with a Leica microscope fitted with a Nikon camera, and evaluated with MCID® Image Analysis software (Imagine Research, Inc., St. Catherines, Canada). Two samples from patients with gingivitis, which is characterized by an acute inflammation process, provided the positive control tissue.
Quantitative Analysis of mRNA Expression in Human Dermis and Epidermis
Dermal and epidermal images were digitized as TIFF files (using Adobe® PhotoShop v9.0) and quantitative analysis was performed with MCID M2 image analysis No. Patients Porcentage % No. Patients Porcentage % Leve 14 88.8 Moderade 1 11.1 Perivascular 6 44.4 Perivascular 0 0 Perivascular, periadnexial 4 22.2 Perivascular, periadnexial 0 0 Perivascular, interstitial 2 11.1 Perivascular, interstitial 1 11.1 Interstitial 2 11.1 Interstitial 0 0 Table 3: Inflammatory cell infiltrate of hypertrophic scars.
software (Imaging Research, Inc., Ontario, Canada). Briefly, rectangular cross-sections of linear epidermal cells (approximately 10 cells wide) were selected, as were sections of dermal tissue below the epidermis. Intensity was measured at various heights of the rectangular cross- sections in a total of 1,000 μm2. We also analyzed positive cell counts per μm2. In photographing the samples, we avoided background noise and also measured as a control variable the negative cell count in each tissue cross- section. We too obtuved the percentage of cells, the count a total of 300 cells.
Results
Histopathology
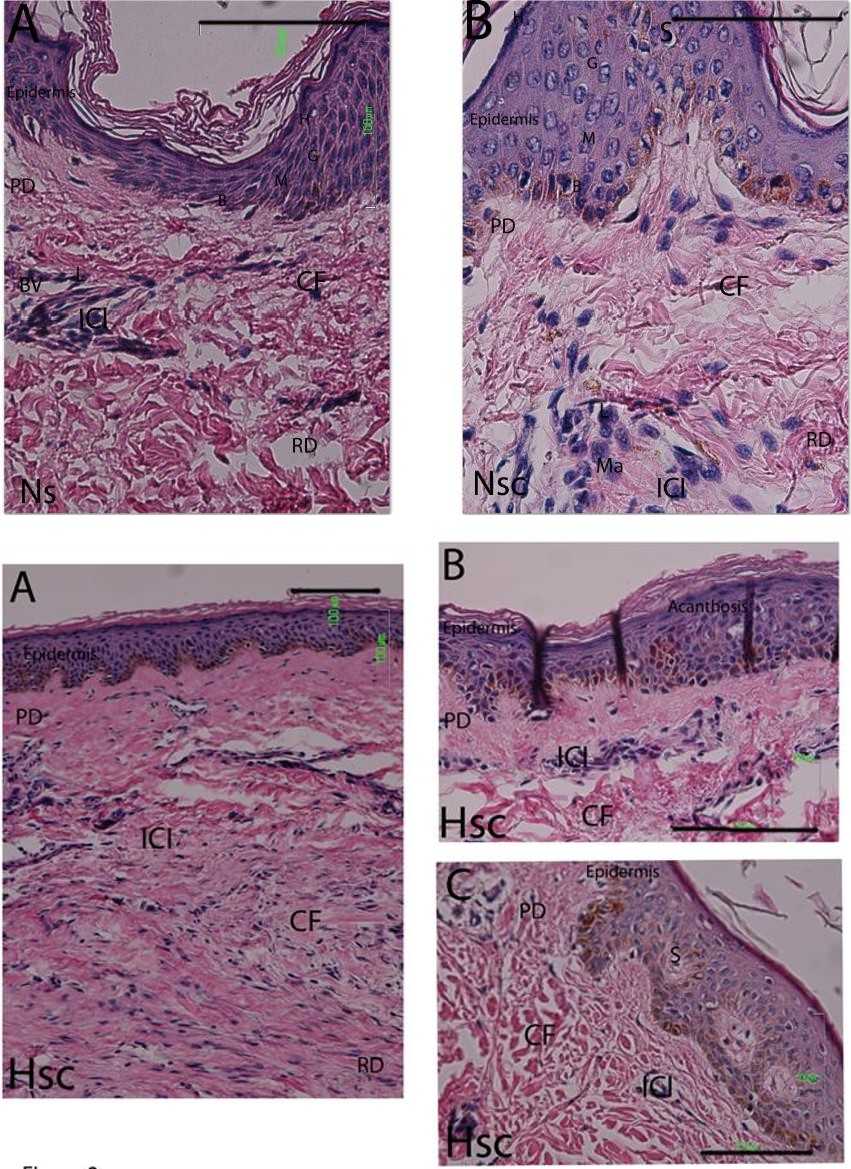
Histopathologic analysis, conducted in line with prior studies showed no differences in the number of lymphocytes [27] (Figure 1A). Both the Nsc (Table 2) and the Hsc (Table 3) specimens were characterized by slight dermal lymphocyte infiltrate, forming small groups of perivascular cells in the upper dermis and occasionally in the lower dermis. A few other lymphocytic cells were dispersed among the collagen fibers (Figure 1B, Figure 2A-C). In general, the epidermis was not affected, although dermal buds were at times more pronounced and showed signs of spongiosis. Exceptionally, two patients with hypertrophic scarring presented traces of cutaneous appendages and acanthosis in the epidermal layer (Figure 2C); and only one hypertrophic scar biopsy was characterized by moderate inflammatory infiltrate, with lymphocyte presence surrounding the blood vessels and macrophages between the collagen fibers (Table 3).
| No. Patients | Porcentage % | |||||
|---|---|---|---|---|---|---|
| Leve | 17 | 100 | ||||
| Perivascular | 8 | 45.45 | ||||
| Interstitial | 8 | 45.45 | ||||
| Not value | 1 | 9.1 |
Table 2: Inflammatory cell infiltrate of normotrophic scars.
TNF-α and IL-1β mRNA Expression
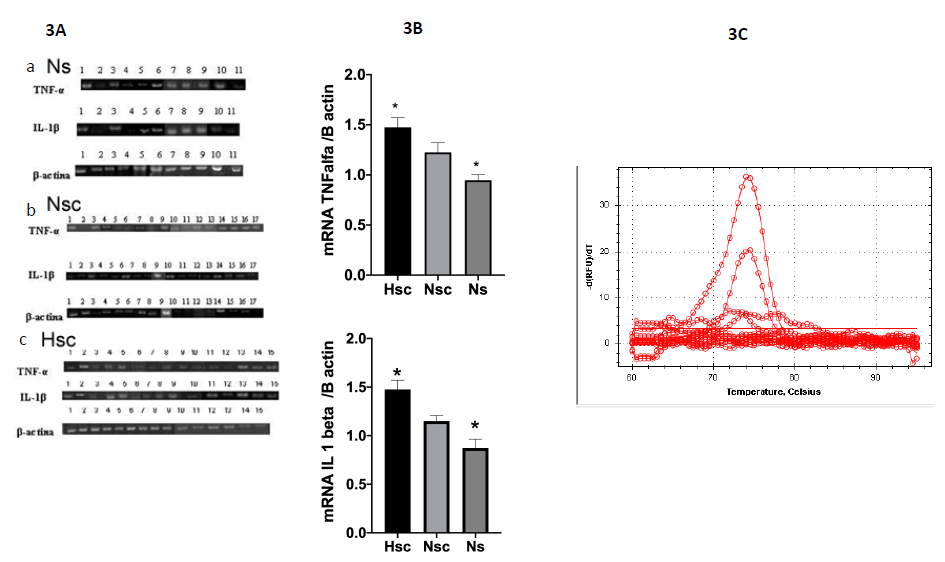
TNF-α, IL-1β and β-actin mRNA expression was determined by semi-quantitative RT-PCR in Ns biopsies (N=11) as well as Nsc (N=17) and Hsc (N=15) biopsies. The analysis densitometric analysis revealed significant differences in TNF-α (p ≤ 0.0048) and IL-1β (p ≤ 0.0047) mRNA expression between Hsc scars and Ns (normal skin) but no Nsc. Figure 3A, 3B. We also perform RT-qPCR (Figure 3C). The mRNA was expressed 2 times more in Hsc than in Ns.
Analysis of TNF-α and IL-1β Gene Expression by Real Time PCR
To further analyze TNF-α and IL-1β at level of transcription, gene expression was achieved by real-time quantitative PCR kinetics using SybrGreen I chemistry. The baseline adjustment method of the Piko Real software was used to determine the threshold cycle in each reaction. A melting curve was constructed for each primer pair to verify the presence of one gene-specific peak and the absence of primer dimmer. Analysis of mRNA levels showed a marked an increase in the expression of TNF and IL1. The value was twice more. The melting curve of the genes showing a single peak. The Tm values of each amplification products are shown over peaks (Figure 3C).
TNF-α mRNA Expression Determined by In Situ Hybridization
TNF-α mRNA expression was determined by in situ hybridization for 28 biopsies: 5 Ns biopsies, 11 Nsc biopsies, and 12 Hsc biopsies. Analysis of hybridization intensity and positive porcentage cells (Figure 4) revealed significant differences in expression intensity between epidermis and dermis within any of the three biopsy types. A comparison in 1000-μm2 sections showed a higher TNF-α-positive porcentage of cells in epidermis of Ns (30%) and Hsc epidermis (28%) relative to Nsc (21%). By dermis we showed a higher TNF-α-positive porcentage of cells in dermis of Nsc (27%) relative to Hsc (20%) and Ns (12%). mRNA (Figure 4).
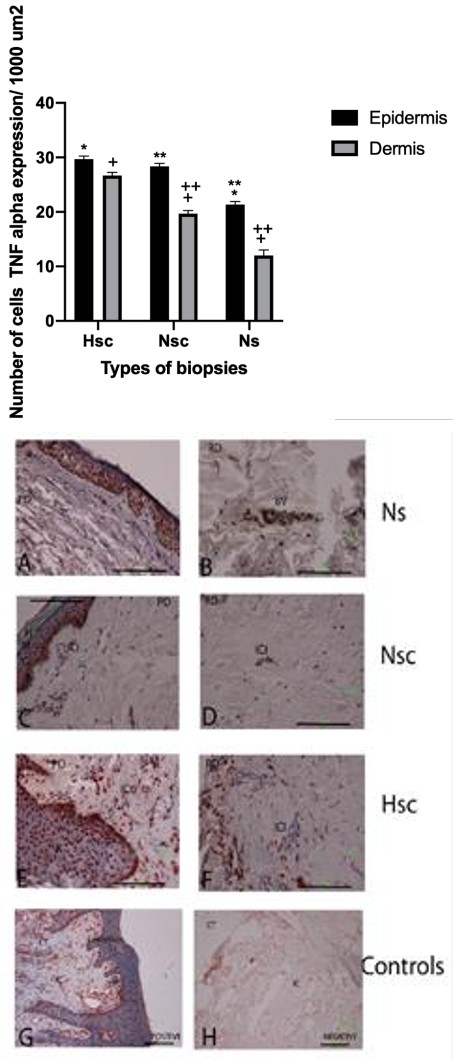
Figure 5A-H: Expression of TNF-α mRNA in three types biopsies 5 A-B. Expression of TNF-α in epidermis (E), immune infiltrate cells (ICI) of papilar dermis (PD) of Ns. 5 C-D. Expression of TNF-α in basal and malpighian layers, papillary dermis, immune cell infiltrate and nervous axons (NA) in reticular dermis of Nsc. 5 E-F. Expression of TNF-α in epidermis and cell immune infiltrate in papilar dermis and around of blood vessels in reticular dermis of Hsc. 5 G. Tissue control positive was gingival tissue with probes oligo dT in the epithelium and the connective tissue and infiltrate cells. 5H. In the negative controls no showing detectable expression. Detection by transcripts was visualized with aminoethylcarbazole (AEC, red coloration). Bars 100μm.
IL-1β mRNA Expression Determine by In Situ Hybridization
IL-1β mRNA expression intensity of the epidermis Hsc tissue differed from that in Ns and Nsc tissue (Figure 6). We also found more porcentage of positive cells for the epidermis (61%) and dermis (23%) of Hsc relative to the epidermis (35%) and dermis (11%) of Nsc as well as the epidermis (17%) and dermis (10%) of Ns. We found statistically significant differences in the porcentage of cells (Figure 6).
IL-1β mRNA expression was determined in 24 biopsies: 4 Ns biopsies, 9 Nsc biopsies, and 11 Hsc biopsies. We observed hybridization intensity and IL-1β positive porcentage of cells.
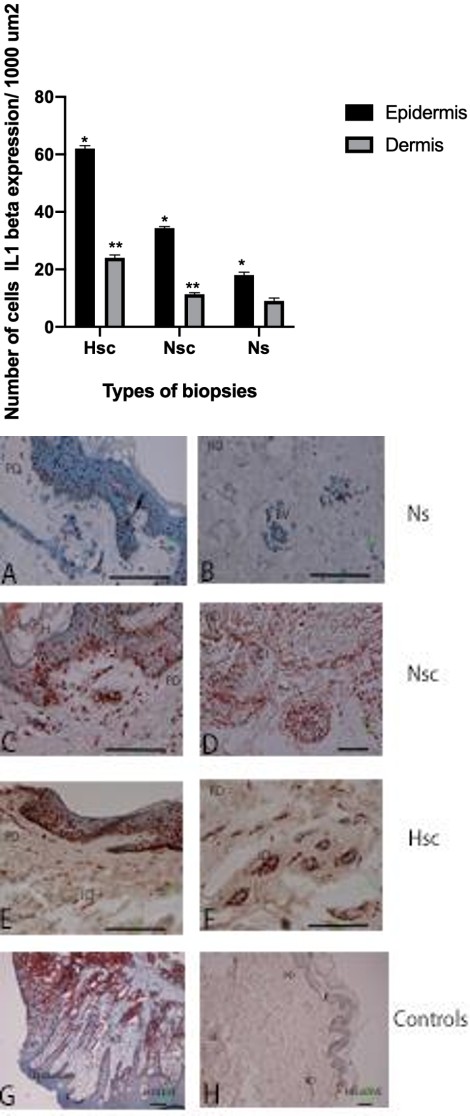
Figure 7A-H: Expression of IL-1 β mRNA in three types biopsies 7 A-B. Expression of IL-1β in keratinocytes (K) and reticular dermis (RD) around of blood vessels (BV) of Ns. 7 C-D. The epidermal layers no showing significatives modifications, are visible: B, basal; M, malpighian; G, granular; C, horny layer. Showing ICI in papillar or superficial dermis (PD) and reticular or deeper dermis (RD). Too existed expression of IL-1β in epidermis and immune cell infiltrate (ICI), reticular dermis and dispersed cells in Nsc. 7 E-F. Expression de IL-1β en epidermis layers and immune cells infiltrate in dermis of Hsc. 7 G. Tissue control positive was gingival tissue with probes oligo dT in the epithelium and the connective tissue and infiltrate cells. 7H. In the negative controls no showing detectable expression. Detection by transcripts was visualized with aminoethylcarbazole (AEC, red coloration) Bars 100μm.
As for positive cell distribution pattern, all the epidermal layers showed the presence of positive cells (mostly keratinocytes), while in the dermis, only a few inflammatory infiltrate cells were positive, mainly those surrounding blood vessels, in the perivascular zones (Figure 7A-H).
Discussion
This study analyzed TNF-α and IL-1β mRNA expression and localization in the post-burn Hsc; these two cytokines are considered pro inflammatory and profibrogenic [17]. Histopathological analysis revealed low levels of inflammatory infiltrate in Hsc that was very similar to that in Nsc and Ns. These findings differ from results obtained by Castagnoli, et al. [13] who determined that Hsc involved a chronic inflammatory process in which immune system cells were found in large quantities, expressing proinflammatory and profibrogenic cytokines responsible for the process and its chronic nature. And we belived this difference might be explained by the possible existence of different Hsc types [12].
We observed reduced expression of TNF-α mRNA in post-burn Hsc. This finding corresponds to previous studies by Peruccio, et al. [30] and Zhang, et al. [31], who also detected reduced expression of TNF-α mRNA in Hsc. No prior data on IL-1β gene expression exist to date, though IL-1β is known to have biological properties similar to TNF-α [24], and the two cytokines have a synergistic effect in degradation of the extracellular matrix in fibrotic processes [32, 33]. Interestingly, we found that IL-1β mRNA is also reduced in post-burn Hsc. This reduced expression of both cytokines in post-burn Hsc may explain the alterations to the extracellular matrix observed in this type of scar.
In situ hybridization by TNF-α mRNA showed higher porcentage of cells positives in the dermis in Nsc, with a constant level of expression intensity. Thus Hsc could be associated with lower TNF-α expression, since the cells are present at constant expression levels, in contrast to Nsc, which has more dermal cells at the same rate of expression than Hsc. Or maybe the Hsc could be associated with higher porcentage of positives TNF-α keratinocytes. Nevertheless the date of percentage of cells not presents statistically significant differences.
In the case of IL1-β, we observed a reduction in mRNA expression intensity by Hsc (these date present statistically significant differences), with higher positive keratinocytes cells present more than Nsc and Ns.
However these last dates of porcentage of cells not present statistically significant differences.
This leads us to conclude that the formation of hypertrophic sequelae may be due to the fact that the keratinocytes express a lower quantity of IL-1β. Our results agree with prior work by Niessen, et al. [34], which assigned a predominant role to the epidermis in the physiopathogenesis of skin hypertrophy, although they associated a higher quantity of Langerhans cells with the Hsc; in contrast, here we found an increase in the keratinocytes that make up the epidermis.
It is known that TNF-α regulates the scarring process, participating in the proper degradation and remodeling of the collagen fibers [35], and that IL1-β participates primarily in the first phase of scarring [36]. This information leads to the conclusion that cytokine liberation must be regulated in a controlled fashion during the entire tissue repair process. Our data, showing a reduction in both TNF-α and IL1-β gene expression imply a change in the regulation of these cytokines.
We believe that it is necessary to evaluate at the systemic level the production of these cytokines, either in serum or in peripheral blood cells, and to monitor the patients as the scars mature, in order to determine if in fact these cytokines intervene in the normal repair process. Likewise, patient variability in the production of cytokines (transcription, post-transcriptional regulation, proteasomal degradation, processing by converting enzymes, receptor regulation, soluble receptors, accessory receptors, natural antagonists) will enable determination of their functional availability and their major effects in biological systems. It is also necessary to determine if the IL-1β and TNF-α gene promoter regions present polymorphisms that affect their levels of expression in order to establish whether or not the etiopathogenesis of Hsc is due to a transcriptional alteration.
The results of this study suggest that there is differential expression of TNF-α and IL-1β in the epidermis and dermis of post-burn Hsc, relative to non- hypertrophic tissues, with probable keratinocyte participation.
Conflicts of Interest
None of the authors have conflicts of interest related to this article.
Acknowledgment
The authors wish to thank Dr. Diego Francisco Hernández López, Instituto Nacional de Nutrición. Salvador Zubirán for his help and assistance with the Nanodrop®; Drs. Jorge González Merchand and Sandra Rivera Gutiérrez, Escuela Nacional de Ciencias Biológicas, Instituto Politécnico Nacional for their help with the Bioanalizer® (Agilent Technologies). Dr. Héctor Durán, president and Dr. Marco Marín, coordinator of extramural surgery, Mexican Burn Association (Asociación Mexicana de Quemaduras) for their help in the collection of biopsies, without which our experiments could not have been carried out And finally wish to thank the Orna Wiseman and Wrigth Science Right by Editing work.
References
-
Linares HA (1996) From wound to scar. Burns 22(5): 339-352.
-
Muir IFK (1990) On the nature of keloid and hypertrophic scars. Br J Plast Surg 43(1): 61-69.
-
Magliacani G, Stella M, Castagnoli C (1999) Classification of Pathological Burn Scars. Annals of Burns and Fire Disasters 12(1).
-
Castagnoli C, Trombotto C, Ondei S, Stella M, Calcagni M, et al. (1997) Characterization of T-cell subsets infiltrating post-burn hypertrophic scar tissues. Burns 23(7-8): 565-572.
-
Castagnoli C, Stella M, Magliacani G, Teich Alasia S, Richiardi P (1990) Anomalous expression of HLA class II molecules on keratinocytes and fibroblasts in hypertrophic scars consequent to thermal injury. Clin Exp Immunol 82: 350-354.
-
Castagnoli C, Stella M, Magliacani G, Ferrone S, Richiardi PM (1994) Similar ectopic expression of ICAM-1 and HLA Class II molecules in hypertrophic scars following thermal injury. Bums 20(5): 430-433.
-
Castagnoli C, Trombotto C, Stella M, Calcagni M, Magliacani G (1996) Expression of functional IL-2 receptor in post-burn hypertrophic scars. Ann Med Burns Club 9(4): 216-221.
-
Alessio M, Gruarin P, Castagnoli C, Trombotto C, Stella M (1998) Primary ex vivo culture of keratinocytes isolated from hypertrophic scars as means for antigenic characterization of CD36. Int J Clin Lab Res 28(1): 47-54.
-
Castagnoli C (1995) CD36 expression in hypertrophic scars. Ann Med Burns Club 8: 214-218.
-
Castagnoli C (1995) Interferon gamma and Interferon gamma receptor in post-bum hypertrophic scars: it is a remission marker?. Abstracts of VI Congress of European Burns Associations 52.
-
Stella M (1998) Interrelationship between immunocompetent and structural cells in post-burn scars. Eur J Hast Surg 21: 8-13.
-
Santucci M, Borgognoni L, Umberto M. Reali, Gabbiani G (2001) Keloids and hypertrophic scars of Caucasians show distinctive morphologic and immunophenotypic profiles. Virchows Arch 438(5): 457-463.
-
Castagnoli C, Stella M, Berhod C, Magliacani G, Richiardi MP (1993) TNF production in hypertrophic scarring. Cell Immunol 147(1): 51-54.
-
Castagnoli C, Stella M, Magliacani G, Richiardi P (1995) The role of TNF alpha and beta cytokines in scar hypertrophy in burn patients: an immunohistochemical study. Ann Med Burns Club 8(1): 23-27.
-
Kovacs EJ (1991) Fibrogenic cytokines: the role of immune mediators in the development of fibrosis. Immunol Today 12: 17-23.
-
Sporn MB, Roberts AB (1988) Peptide growth factors are multifunctional. Nature 332(6161): 217-219.
-
Kovacs, EJ, DiPietro LA (1994) Fibrogenic cytokines and connective tissue production. FASEB J 8: 854- 861.
-
Georgopoulos S, Plows D, Kollias G (1996) Transmembrane TNF is sufficient to induce localized tissue toxicity and chronic inflammatory arthritis in transgenic mice. J Inflamm 46(2): 86-97.
-
Rothe J, Gehr G, Loetscher H, Lesslauer W (1992) Tumor necrosis factor receptors structure and function. Immunol Res 11(2): 81-90.
-
Liu ZG, Hsu H, Goeddel DV, Karin M (1996) Dissection of TNF receptor 1 effector functions: JNK activation is not linked to apoptosis while NF-kappa B activation prevents cell death. Cell 87: 565-576.
-
Oppenheim JJ, Kovacs EJ, Matsushima K, Durum SK (1986) There is no more than one interleukin 1_._ Immunol Today 7(2): 45-56.
-
Dinarello CA (1996) Biologic basis for interleukin-1 in disease. Blood 87(6): 2095-2147.
-
O’Neill SA, Dinarello CA (2000) The IL-1 receptor/toll-like receptor superfamily: crucial receptors for inflammation and host defense. Immunol Today 21: 206-209.
-
Le J, Vilcek J (1987) Tumor necrosis factor and interleukin 1: cytokines with multiple overlapping biological activities. Lab Invest 56: 234-248.
-
Dinarello CA (1994) The biological properties of interleukin-1. Eur Cytokine Netw 5(6): 517-531.
-
Solis Herruzo JA (1988) Bases moleculares de la fibrosis hepática. Gastroent y Hepatol 11: 463-483.
-
Kanitakis J, Petruzzo P, Jullien D, Badet L, Dezza MC, et al. (2005) Pathological score for the evaluation of allograft rejection in human hand (composite tissue) allotransplantation. Eur J Dermatol 15 (4): 235-238.
-
Darby IA, Hewitson TD (2006) In Situ Hybridization Protocols. 3rd (Edn.) pp: 280.
-
Smith MD, Triantafillou S, Parker A, Coleman M (1997) A nonradioactive method of _in_ _situ_ hybridization which utilizes riboprobes and paraffin embedded tissue. Diagnostic Mol Pathol 6: 34-41.
-
Peruccio D, Castagnoli C, Stella M, D'Alfonso S, Momigliano PR, et al. (1994) Altered biosynthesis of tumour necrosis factor (TNF) alpha is involved in post-burn hypertrophic scars. Burns 20(2): 118-121.
-
Zhang J, Lin ZH, Jiang H, Yuan XB, Zhao YZ, et al. (2004) The dynamic expression of TNF-alpha mRNA of hypertrophic scars and its role. Zhonghua Zheng Xing Wai Ke Za Zhi 20(1): 57-59.
-
Borunda AJ, Katayama, Seyer DM (1992) Transcriptional mechanisms of type 1 collagen gene expression are differentially regulated by interleukin- 1β, tumor necrosis factor α and transforming growth factor β in Ito cells. J Biol Chem 267(20): 14316- 14321.
-
Tredget EE, Yang L, Delehanty M, Shankowskiy H, Scott PG (2006) Polarized Th2 cytokine production in patients with hypertrophic scars following thermal injury. J Interferon Cytokine Res 26(3): 179-189.
-
Niessen BF, Schalkwijk J, Vos H, Timens W (2004) Hypertrophic scar formation is associated with an increased number of epidermal Langerhans cells. J Pathol 202(1): 121-129.
-
Hernandez Rodriguez J, Segarra M, Vilardell C, Sanchez M, Garcia Martinez A, et al. (2004) Tissue production of pro-inflammatory cytokines (IL-1β, TNF-α and IL-6) correlates with intensity of the systemic inflammatory response and with corticosteroid requirements in giant-cell arteritis. Rheumatology 43(3): 294-301.
-
Phillips R, Horsfield C, Mangan J, Laing K, Etuaful S, et al. (2006) Cytokine mRNA expression in Mycobacterium ulcerans-infected human skin and correlation with local inflammatory response. Infection and Immunity 74 (5): 2917-2924.
- Research Progress of Induced Pluripotent Stem Cells and Their Clinical Application Prospects
- Nishan Al-Kamal is the Starting Point of A Feminist Scientist
- Current Concepts and Future Perspectives of Stem Cell Therapy in Peripheral Arterial Disease
- Stem Cell and Oxidative Stress-Inflammation Cycle
- Adipose Derived Mesenchymal Stem Cells Origin, Characteristics and Promises
- Mitochondria Targeted Antioxidants can Improve In Vitro Embryo Production in Buffalo