Correlation between Cephalometric and Facial Photographic Measurements of Craniofacial Form-A Cross Sectional Study
Aim: This study aims at evaluating relationship between craniofacial measurements obtained from cephalometric radiographs and analogous measurements from standardized facial photographs. Material Method: Lateral cephalograms and standardized profile photographs were obtained from 60 subjects (age 18 – 30 years). Digital cephalograms were analyzed with software NemoCeph and photographs were analyzed using adobe Photoshop. The following vertical measurements were studied Ar-Go-Me, FMA, OPA, AFH (N-Me), LAFH (ANS-Me), PFH(S-Go), LPFH (ArGo) and Sagittal assessment include Wits, ANB, FNP, N-ANS-Pog. Result: There was no significant difference seen in N-Sn-Pog’ on photographic analysis p=0.511, OPA’, p=0.054. Measurements. Other measurements showed significant differences (p<0.0001). Moderately positive and good significant correlation were found for ANB and Wits (r.>0.6, p<0.05). Conclusion: The reliability of using photographs is established indicating that the facial landmarks can be located consistently on a photograph. ANB’ and Wits’ measurements were the photographic variables that moderately explained the variability of its analogous cephalometric measurement.
Introduction
Photographs have been used as an adjunct in anthropometric research and orthodontic clinical practice. Cephalometric plays a major role in most of the studies dealing with growth changes; it is indispensable in clinical practice, where it is employed to aid in treatment planning, in careful monitoring of therapeutic procedures and the final evaluation of results [1].
Thesis
A further non-invasive method for facial morphology evaluation involves a 3-dimensional anthropometry, which includes using complex devices (conventional anthropometry) or relying on infrared photogrammetry (computerized anthropometry) [2].
Although cephalometric is an essential diagnostic aid for treatment planning of an orthodontic case, it also has two basic disadvantages:
1. It requires a radiation source and a cephalostat which is not easily available everywhere.
2. Patients are exposed to radiation.
Unnecessary irradiation of patients may be avoided, as there is no threshold dose below which biologic damage does not occur at all. In recent studies use of video images and photographs has been investigated as an alternative to lateral cephalograms for soft-tissue outline digitization. Still, the question remains whether the profile outline always accurately reflects the underlying skeletal structures [2].
The two important aspects of soft tissue assessment include the relationship between soft tissue and dentoskeletal variables in normal occlusion and changes in soft tissue associated with therapeutic changes in the underlying dentoskeletal structures [3]. Comparisons involving cephalometric and photographic measurements have seldom been performed, and conflicting results have been found [4]. Today, with rising concerns about radiation exposure, unnecessary irradiation should always be avoided since there is no threshold dose below which biologic damage does not occur [5].
Cephalometric is the standard for characterizing skeletal and dental craniofacial morphology in clinical practice but it might not be practical for large-scale epidemiologic studies. Also, patients who have cephalograms taken absorb small amounts of radiation. Many studies have been performed on the concerned topic however no study has been conducted on the population of Navi Mumbai. This study should help clinicians in the future to make a diagnosis and develop an appropriate treatment plan based on lateral photographs. The study aims to assess the agreement between measurements taken from the photographic image and a lateral cephalograms of the same patient. The emphasis was on the objective assessment of cephalometric radiographs, leaving a subjective role for lateral photographs radiation source and a head holder to make this technique accurate [6].
Materials and Methods
Study population- Lateral cephalograms and standardized profile photographs were obtained from subjects (age 18 – 30 years) mean 24 years. According to statistical guideline a sample size of 60 was selected from subjects who reported to the outpatient Department of Orthodontics and Dentofacial orthopaedics for treatment of malocclusion. Parents or legal guardians were previously informed about the procedures and a written consent was taken for the investigation. The study was presented and approved by the by Research Ethical board committee.
Inclusion Criteria
- No previous orthodontic or surgical treatment.
- All six anterior teeth present.
- Patient should not have excessive facial hair.
Exclusion Criteria
- Patient with craniofacial trauma.
- Patient with congenital anomalies.
- Patient with neurologic disturbances.
Materials
Cephalostat, Standardized Lateral cephalograms (soft copy), Digital SLR camera (Canon EOS 1300D) mounted with the lens (100mm MACRO lens), NemoCeph software (version 10), for digital cephalometric tracing, Standardized photographs (soft copy), Scale, mirror, adhesive stickers, thread, plaster and Fox plane, Adobe Photoshop CC 2019 Version 20.0.0 (Adobe System, Inc. Sant Jose, CA ,USA).
Method
Photographic Procedure: The photographic setup was standardized. Spectacles were asked to be removed and hair piled high on head to ensure that patients forehead, neck and ears are clearly visible.
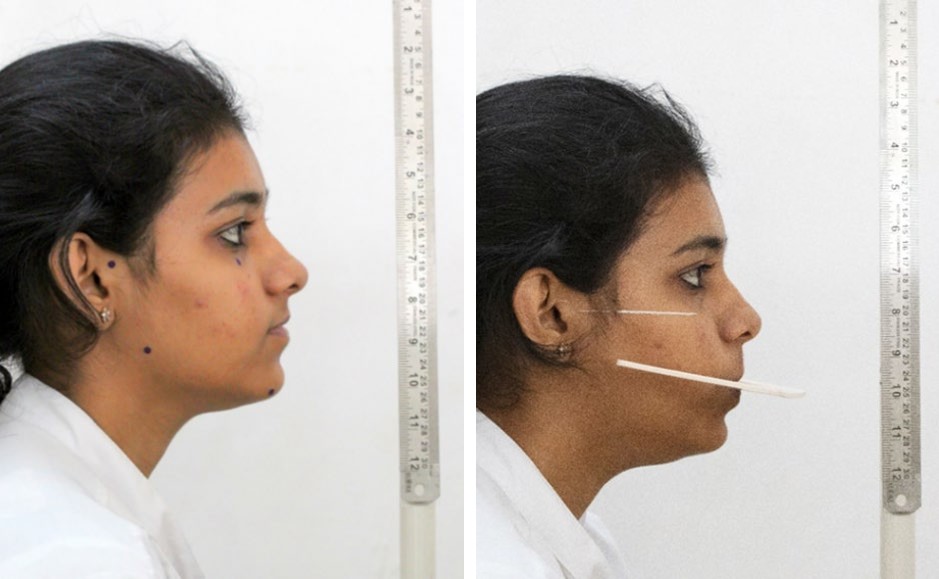
- This plane was maintained parallel to the floor and at right angles to the scale on the midsagittal axis [7]. Standardized right profile photographs were taken in the Natural Head Position (NHP) with maximum intercuspation and lips at repose [7].
- To obtain NHP, a mirror was placed in front of the patients at a distance of 1.2m, and they were instructed to tilt their head up and down with decreasing amplitude until they feel relaxed [8].
- Another photograph with the patient biting on the Fox Plane to mark the occlusal plane extra orally was also taken [7].
- A protractor was placed on tip of nose and the soft tissue pogonion, and a plumb line recorded the NHP angle.
- The same digital camera (canon 1300D) with the same lens (100MM MACRO lens) was used for all the photographic records.
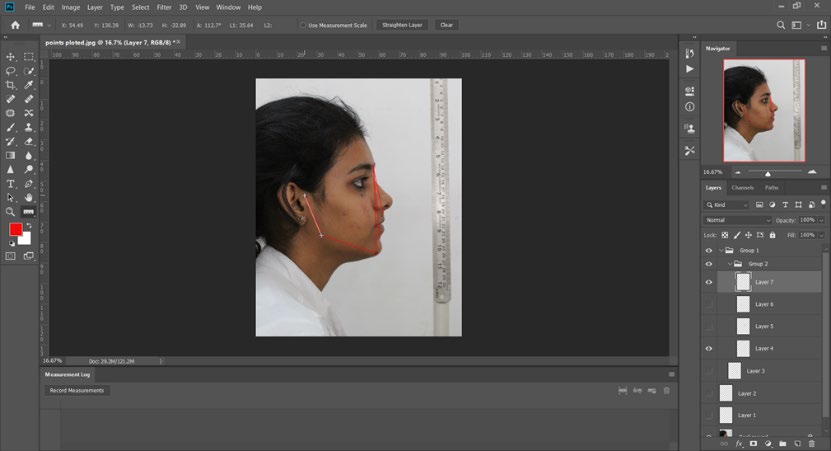
- The images obtained were transferred to the computer. Grids in Adobe Photoshop were used to confirm the parallelism of the FH plane [7].
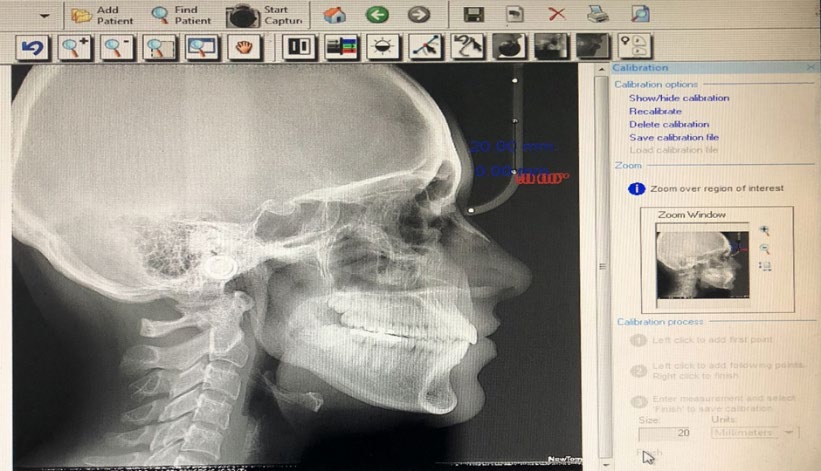
Radiographic Procedure: Digital lateral skull radiographs were taken with Cephalostat NewTom (Verona, Italy). Same exposure parameters and magnification were applied for all the lateral cephalograms (KvP - 80, mA-10 exposure time 0.5 sec). This radiographic system used a charged couple device sensor chip as an image receptor. Cephalometric radiographs were taken with maximum intercuspation and lips at rest. Patient was made to stand in natural head position and the red laser line of the cephalostat marking the Frankfort Horizontal (FH) plane on the patient’s face was made parallel to the floor [7].
The following facial landmarks were identified on each photographs (Figure2)- Soft tissue nasion (N’), Soft tissue orbitale (Or’), Tragion (Tr), Soft tissue B point (B’) Soft tissue menton (Me’), Subnasale (Sn’), Soft tissue gonion (Go’), Soft tissue pogonion (Pog’) [9] .
![Figure 2: a. Photographic landmarks = N’, indicates soft tissue nasion; Tr’, tragion; Or’, Soft tissue orbitale; A’, Soft tissue subspinale; B’, soft tissue supramentale; Go’, soft tissue gonion; Pog’, soft tissue pogonion; Me’, soft tissue menton; Sn’,subnasale;Adhesive dots were placed on Tr’, Or’and Go’. The Me’ point was marked with an adhesive sticker to allow better visibility by the camera. b. Cephalometric landmarks= N, indicates nasion; Ar, articulare ; Or, orbitale; A ,point A, ; B, point B; Go, gonion; Pog, pogonion; Me, menton; S’,midpoint of sella; Po, porion, ANS, anterior nasal spine The following points were marked on each lateral cephalograms: • Nasion (N), Orbitale (Or) Porion (P) Point A (A) Point B (B) Menton (Me) Anterior nasal spine (ANS) Gonion (Go) Pogonion (Pog) Digital cephalograms were analyzed with software NemoCeph and photographs were analysed using Adobe Photoshop CC 2019 Version 20.0.0 (Adobe Systems, Inc., San Jose, CA, USA) [10]. The images were opened in the nemoceph software and calibration was done after plotting the points on the cephalograms the software automatically calculated all the measurements. The image was also opened in Adobe Photoshop CC 2019 Version 20.0.0 (Adobe Systems, Inc., San Jose, CA, USA) and was adjusted by using the ruler option in the frame. In Adobe Photoshop, the measurements were taken by drawing a line with the ruler tool, angle and linear measurements was recorded in the measurement log panel. A computerized analysis of facial morphology through radiographs and photographs was performed by the same operator in blind design.](/fulltextimages/5978/fig_2.jpeg)
Figure 2: a. Photographic landmarks = N’, indicates soft tissue nasion; Tr’, tragion; Or’, Soft tissue orbitale; A’, Soft tissue subspinale; B’, soft tissue supramentale; Go’, soft tissue gonion; Pog’, soft tissue pogonion; Me’, soft tissue menton; Sn’,subnasale;Adhesive dots were placed on Tr’, Or’and Go’. The Me’ point was marked with an adhesive sticker to allow better visibility by the camera. b. Cephalometric landmarks= N, indicates nasion; Ar, articulare ; Or, orbitale; A ,point A, ; B, point B; Go, gonion; Pog, pogonion; Me, menton; S’,midpoint of sella; Po, porion, ANS, anterior nasal spine The following points were marked on each lateral cephalograms: • Nasion (N), Orbitale (Or) Porion (P) Point A (A) Point B (B) Menton (Me) Anterior nasal spine (ANS) Gonion (Go) Pogonion (Pog) Digital cephalograms were analyzed with software NemoCeph and photographs were analysed using Adobe Photoshop CC 2019 Version 20.0.0 (Adobe Systems, Inc., San Jose, CA, USA) [10]. The images were opened in the nemoceph software and calibration was done after plotting the points on the cephalograms the software automatically calculated all the measurements. The image was also opened in Adobe Photoshop CC 2019 Version 20.0.0 (Adobe Systems, Inc., San Jose, CA, USA) and was adjusted by using the ruler option in the frame. In Adobe Photoshop, the measurements were taken by drawing a line with the ruler tool, angle and linear measurements was recorded in the measurement log panel. A computerized analysis of facial morphology through radiographs and photographs was performed by the same operator in blind design.
| Sagittal assessment | |
|---|---|
| 1.Ar-Go-Me, Gonial angle | 1.Wits, maxillomandibular linear discrepancy |
| 2.FMA, Frankfurt to Mandibular plane angle | 2.ANB, maxillomandibular angular discrepancy |
| 3.OPA, Frankfurt to occlusal plane angle | 3.FNP, facial angle (angle between FH plane and NPog) |
| 4.AFH(N-Me), anterior facial height | 4.N-ANS-Pog, angle of facial convexity |
| 5.LAFH (ANS-Me), lower anterior facial height | |
| 6.PFH(S-Go), posterior facial height | |
| 7.LPFH(Ar-Go) lower posterior facial height |
Table 1: Measurements.
Method Error: 1. Repeatability analysis was carried out on a sample of 20 subjects randomly selected. After a 1-week interval, the anatomical landmarks were established again, the adhesive dots were replaced and a new photograph was taken.
Reproducibility analysis was conducted on a sample of 20 subjects randomly selected. Hence, a second rate was used to repeat the landmarks location by palpation and replace the adhesive dots before taking the picture.
Results
Data Analysis Tools
All data were entered into a Microsoft Office Excel (version 2016) in a spread sheet which was prepared and validated for the data form. Data analysis was done using windows based ‘MedCalc Statistical Software’ version 19.0.1. Data expression: Measurement data for the measurements are expressed as means with standard deviation (SD). Data analysis: Data normality was tested using the Shapiro-Wilk test. The correlation was analysed for data of photographs and lateral cephalograms using the Pearson’s correlation (parametric). Measurement was compared between males and females using the paired t-test assuming unequal variances. Linear regression was used for measuring the degree of association between the data for photographs and lateral cephalograms.
All testing was done using two-sided tests at alpha 0.05. Thus, the criteria for rejecting the null hypothesis was ‘p’ value of <0.05. To identify method error with photographic and cephalometric measurements, repeatability and reproducibility test was carried out. Intra examiner reliability and reproducibility coefficients ranged from 0.975 to 0.988.
Comparison of Photograph Vs Lateral Cephalogram values
| Photograph | Lat. Cephalogram | Paired t-test | |||
|---|---|---|---|---|---|
| Mean (SD) | Mean (SD) | Mean diff. (95% C.I.) | ‘t’ | ‘p’ | |
| AFH (N-Me) | 94.34 (11.22) | 102.02 (6.58) | -7.68 (-11.00 to -4.36) | -5.285 | <0.0001 |
| LAFH (Sn-Me) | 51.68 (7.78) | 59.33 (5.97) | -7.66 (-10.16 to -5.15) | -7.774 | <0.0001 |
| PFH (Tr-Go) | 48.20 (7.53) | 69.57 (6.45) | -21.37 (-23.90 to -18.83) | -21.632 | <0.0001 |
| ANB | 4.73 (2.28) | 2.63 (2.54) | 2.10 (1.23 to 2.97) | 7.758 | <0.0001 |
| FNP | 85.77 (5.18) | 87.05 (2.88) | -1.28 (-2.79 to 0.24) | -2.100 | 0.04 |
| N-Sn-Pog | 161.13 (5.15) | 161.62 (5.68) | -0.49 (-2.45 to 1.47) | -0.661 | 0.511 |
| Tr-Go-Me | 117.80 (5.58) | 124.75 (6.61) | -6.95 (-9.16 to -4.74) | -6.704 | <0.0001 |
| FMA | 21.65 (4.52) | 26.38 (6.17) | -4.73 (-6.69 to -2.77) | -6.690 | <0.0001 |
| OPA | 9.78 (3.40) | 8.97 (2.71) | 0.81 (-0.30 to 1.92) | 1.969 | 0.054 |
| Wits | 3.22 (2.00) | 1.18 (2.94) | 2.05 (1.14 to 2.96) | 6.914 | <0.0001 |
| LAFH/AFH | 0.548 (0.053) | 0.581 (0.038) | -0.03 (-0.05 to -0.02) | -5.072 | <0.0001 |
| PFH/AFH | 0.512 (0.061) | 0.682 (0.053) | -0.17 (-0.19 to -0.15) | -20.680 | <0.0001 |
| PFH/LAFH | 0.938 (0.105) | 0.743 (0.091) | 0.20 (0.16 to 0.23) | 16.078 | <0.0001 |
Table 2: Correlation coefficients between cephalometric and photographic.
There was no significant difference seen in N-Sn- Pog’ on photographic analysis p=0.511, OPA’, p=0.054. Measurements. Other measurements showed significant differences (p<0.0001) (Table 2).
Correlation (Pearson’s) of Photograph Vs Lateral Cephalograms values
| N | ‘r’ | ‘p’ | |
|---|---|---|---|
| AFH (N-Me) | 60 | 0.288 | 0.026 |
| LAFH (Sn-Me) | 60 | 0.409 | 0.001 |
| PFH (Tr-Go) | 60 | 0.410 | 0.001 |
| ANB | 60 | 0.627 | <0.0001 |
| FNP | 60 | 0.432 | 0.001 |
| N-Sn-Pog | 60 | 0.450 | <0.0001 |
| Tr-Go-Me | 60 | 0.139 | 0.291 |
| FMA | 60 | 0.511 | <0.0001 |
| OPA | 60 | 0.472 | <0.0001 |
| Wits | 60 | 0.630 | <0.0001 |
| LAFH/AFH | 60 | 0.429 | 0.001 |
| PFH/AFH | 60 | 0.388 | 0.002 |
| PFH/LAFH | 60 | 0.547 | <0.0001 |
Table 3: Correlation (Pearson’s) of Photograph Vs Lateral Cephalograms values.
Moderately positive and good significant correlation were found for ANB and Wits (r.>0.6, p<0.05). Weakly positive but significant correlation were found for AFH(N-Me) to AFH’(N’-Me’) and Ar-Go-Me to Tr-GO-Me’ (r<0.3, p<0.05). Moderately positive and significant correlation were found for LAFH(ANS-Me) to LAFH’(Sn-Me), PFH to PFH’, FNP to FNP’, N-ANS-Pog to N-Sn-Pog’, OPA to OPA’, LAFH/AFH to LAFH/AFH’,PFH/AFH to PFH/AFH’, PFH/LAFH to LAFH/ LAFH’ ( 0.3<r<0.6, p<0.05) (Table 3).
Linear regression analysis for Photograph Vs Lateral Cephalogram
| Intercept (a) | Slope Coefficient (b) | SE of estimate | Coefficient of determination (r²) | Sig. (p) | |
|---|---|---|---|---|---|
| AFH (N-Me) | 86.095 | 0.169 | 0.074 | 0.288 | 0.026 |
| LAFH (Sn-Me) | 43.128 | 0.314 | 0.092 | 0.167 | 0.001 |
| PFH (Tr-Go) | 52.645 | 0.351 | 0.103 | 0.168 | 0.001 |
| ANB | -0.682 | 0.700 | 0.114 | 0.393 | <0.0001 |
| FNP | 66.442 | 0.240 | 0.066 | 0.187 | 0.001 |
| N-Sn-Pog | 81.623 | 0.496 | 0.129 | 0.203 | <0.0001 |
| Tr-Go-Me | 105.406 | 0.164 | 54.000 | 0.019 | 0.291 |
| FMA | 11.255 | 0.699 | 0.154 | 0.262 | <0.0001 |
| OPA | 5.294 | 0.376 | 0.092 | 0.223 | <0.0001 |
| Wits | -1.805 | 0.925 | 0.150 | 0.397 | <0.0001 |
| LAFH/AFH | 0.409 | 0.313 | 0.087 | 0.184 | 0.001 |
| PFH/AFH | 0.510 | 0.336 | 0.105 | 0.150 | 0.002 |
| PFH/LAFH | 0.301 | 0.471 | 0.095 | 0.299 | <0.0001 |
Table 4: Linear regression analysis for Photograph Vs Lateral Cephalogram.
For the variable Tr-Go-Me the p value is not significant (p=0.291) hence regression cannot be applied to it. For all other variables p value was found to be significant p<o. oo5 and following equation is established Y=a+bx+c. The regression coefficients and relevant standard errors are listed in Table 4, whereas the slope and intercept of each regression equation (Y=a+bx+c, where Y is the estimated cephalometric variable and X is the soft-tissue measured variable) together with the relevant standard errors.
Discussion
The study was conducted with an aim to compare standardized facial photography with cephalometric radiography which can be used as a method for characterizing craniofacial morphology. In the current study it was observed that facial landmarks can be located consistently as the reliability test was excellent, which makes it possible to use photography for craniofacial assessment on large groups of people as in epidemiologic studies. Our study also suggests that facial photography is as reliable as cephalometric. Therefore, to avoid the invasive effects of radiography, photography might be a logical alternative.
The photographic assessment is also considered as a great diagnostic tool for epidemiologic studies as it is cost- effective and does not expose the patient to potentially harmful radiation [8]. Also measurements can be taken repeatedly and stored permanently, making longitudinal follow up possible. In the current study natural head position is important as all photographs and cephalograms need to be standardized.
One potential source of error using this method is the head posture. It should be ensured that the head posture remains the same during the radiographic and photographic recording procedure [2]. Head posture, jaw opening along with lip straining by mentalis muscle constriction are also another source of error concerns [11]. As angular variables were most used, it partially overcomes the problem of magnification [11]. Results of this study also show that method of reproducibility was satisfactory. The technique used was also reproducible. Similar finding was found in a study done by Gomes et al. [8]. Good sensitivity (90.5%) and specificity (81.0%) were found for detection of skeletal Class III by the soft-tissue angle ANB’ on the photograph [2].
Highly significant correlations (P<=0.001) were found between analogous cephalometric and photographic measurements for most sagittal and vertical diagnostic variables. However, Pearson correlation coefficients ranged from weak to moderate (0.139 <= r <= 0.63). Similar like our finding Zhang et al. in previous study, reported only low to moderate correlations (0.36 <= r <= 0.64), whereas Gomes L.C et al. reported low to strong correlations(0.39<=r<=0.89) [6, 8].
Staudt and Kiliaridis2 found that several soft tissue measurements gave a reliable description of the underlying sagittal jaw relationship. A correlation coefficient of r = 0.80 was reported when comparing analogous photographic and cephalometric ANB angles. Our results largely showed a moderate and good correlation for ANB variable with r=0.62. Supporting our finding Bittner C, Pancherz H have found moderate correlations regarding such variables (r =
0.63) [12]. Patel D in their study found weakly positive but significant correlation (r<0.3, p<0.05) for ANB and ANB’ [9].
Christine et al., in their study on skeletal class 3 subjects found strong correlation for ANB [2]. In a study by Pogulwar S, et al. the photographic variable ANB’ best explained the variability of its analogous cephalometric measurement ANB (r=0.86) [4]. In another study done by Mehta. P et al., found good relationship with analogous photographic measurements for ANB variable (p<0.05) [7]. Weakly positive significant Correlation was found in the correlation between ANB and A’N’B’, where the Correlation coefficient value is 0.472 in the study performed by Dr Banerjee S et al.
on Bengalese population [10]. The position of A and B points on the facial skeleton is closely correlated with the position of the corresponding points on the integument soft tissues [13].
In the current study the correlation between Wits was r=0.63. This showed moderate correlation between the two methods. Ferrario VF, et al. noticed that the soft tissue Wits was significantly correlated to the photographic analysis (r=0.73) [14]. Camper Wits was also assessed an entirely external method for quantitative evaluation of jaw discrepancies. However, only a moderate relationship was found with the conventional cephalometric Wits appraisal (r= 0.53).
On comparing the angular and photographic variables it was found that all other variables have a good relationship with analogous photographic measurements except gonial angle(r=0.139) and AFH(r=0.288) (P<0.05). Mehta P. found positive correlation for gonial angle and facial angle with r values of 0.78 and 0.91 respectively [7]. The gonial angle and facial angle showed a mean difference -1.11 and -1.22 respectively which lies outside significant mean difference range [7]. This difference could be attributed to the variability in the soft tissue chin as shown in a study by Bitter C and Pancherz [12]. The comparison of these angular cephalometric and photographic parameters was in conjunction with Gomes LDCR et al. and Patel DP et al., Hence the photographic parameters including FMA, MP-OP, OP angle, gonial angle, convexity (in degree) could be used as a substitute to the analogous cephalometric parameter [7, 8, 9].
Dr Suranjan Banerjee et al., found strong and highly significant Correlation between ArGoMe and TrGo’Me’, where the correlation value is 0.816 [10]. In a study done by Pogulwar S et al., significant differences were found for FNP’ variable, while FNP showed highest correlation between the two techniques (85.9) [4]. Whereas the average FNP did not differ significantly between the photographic and cephalometric technique with p>0.05. In contrast to our study highest coefficient was found for FNP (r=0.97) [4]. In a study done by Dr. Suranjan Banerjee, et al. positive correlations were found between FNP and that was statistically significant [10].
When comparing FMA’ with the cephalometric variable, a weak correlation coefficient (r=0.42) was found [6]. In contrast, strong correlations were observed between the cephalometric and photographic FMA analogous angles in the study by Bittner and Pancherz (r=0.93) and in the current study (r=0.51) [12]. Such difference might be related to the inclination of intracranial SN line, which has shown individual variations [14].
Moderate but good correlation were found for the lower anterior facial height LAFH (Ans-Me) r= 40. Comparatively weak correlation was seen with anterior facial height AFH (N-Me), r=0.288. Similar findings were found by Zhang, et al. Christine, Bittner in their study [2, 6, 12]. The reason may be because the landmarks N’, Sn’, Me’ used to measure facial heights are not influenced by excessive soft tissue thickness. This states that facial heights can be stated reliably from facial photographs.
In a study done by Oliveira, low correlation was established for angle of facial convexity. In our study N-ANS-Pog showed moderate correlation of r=0.45. this could be attributed to the thickness variability in the soft tissue. It should be also noted that the observed thickness in the soft tissue tracing of radiographs showed great discrepancy between the regions of point N, A, Pog, so mistaken measurements were projected onto photographs [15]. Similarly, a thick soft-tissue integument in the sub nasal area is partly responsible for the lower correlations between cephalograms and photographs [6]. Pooja Mehta, et al. in their study showed that on comparing the angular cephalometric and photographic variables for skeletal class 2 subjects found that convexity in degrees had a good relationship with analogous photographic measurements (p>0.05) [7]. This angular measurement even showed a significant mean difference (-1<Mean <1). In another study by Gomes et al., showed correlation which was moderate with r=0.68 [8].
Gomes, et al. in their study found that the photographic variable that best explained the variability of its analogous cephalometric measurement was ANB’ angle (r2=0.68) [8]. Along with it the photographic variable FMA’ which is used for vertical assessment showed the best results with r2=0.65. Pogulwar S, et al. observed that among the parameters used for vertical assessment, FMA’ and FNP’ showed the best results (r2=0.098, r2=0.94) [4]. In contrast to this finding, in our study the variables FMA’ and FNP’ showed r2=0.26 and r2=0.187 respectively [16, 17, 18, 19, 20, 21, 22, 23, 24, 25].
Linear regression analysis showed that photographic
variables that moderately explained the variability of its analogous cephalometric measurement in the current study was ANB angle (r2=0.393) and Wits with (r2=0.397). This means that at least 39% of the variance of the cephalometric assessment can be explained by such photographic measurements given the total sample. In another study done by Gomes et al.,10 by Linear regression analysis the photographic variable that best explained the variability of its analogous cephalometric measurement was the A’N’B’ angle (r2= 0.68). Higher the value of r2 higher is the agreement between two techniques. This study provides regression models that may predict the cephalometric variables by means of analogous photographic measurements with a limited error of the estimate and a satisfactory predictive power. Also, with this study, further studies on Indian population must be performed to establish the diagnostic accuracy of such model [26, 27, 28, 29, 30, 31, 32, 33, 34].
In the current study it may not be feasible to locate soft tissue points like Go’, Me’, Pog in bearded individuals or patients with excessive facial hair. This shortcoming is considered as one of the limitation of this study.
Conclusion
In the current study, for most sagittal and vertical diagnostic variables significant correlation between analogous photographic and cephalometric measurements were found (p<0.05). The ANB’ and Wits’ measurements were the photographic variables that moderately explained the variability of its analogous cephalometric measurement.
Also with increasing awareness and advances in field of orthodontics there is a paradigm shift towards soft tissue analysis as an important part in orthodontic treatment planning. Mainly in pregnant females and patients in which radiation exposure is contraindicated, photography stands an important diagnostic tool for orthodontic treatment planning. Also when epidemiological studies, screening, initial consultations have to be conducted, photography can be reliably used as a diagnostic tool.
The photographic method stands to be a repeatable, reproducible, low cost and non-invasive diagnostic tool and an alternative for epidemiologic study, provided a standardized protocol for recording cephalograms and photographs is followed. Furthermore, studies need to be done to test the diagnostic accuracy of the predictive models obtained on Indian population.
References
-
Ferrario V, Sforza C, Miani A, Tartaglla G (1993) Craniofacial morphometry by photographic evaluations. Am J Orthod Dentofacial Orthop 103(4): 327-337.
-
Staudta CB, Kiliaridis S (2009) A nonradiographic approach to detect Class III skeletal discrepancies. Am J Orthod Dentofacial Orthop 136(1): 52-58.
-
Saxby PJ, Freer TJ (1985) Dentoskeletal determinants of soft tissue morphology. Angle Orthod 55(2): 147-154.
-
Pogulwar S, Gautam R, Kaila A, Hegde A, Ahmad E (2014) Photographic Assessment of Cephalometric Measurements. IJOCR 2(5): 21-26.
-
Mehta P, Sagarkar R, Mathew S (2017) Photographic assessment of skeletal class II cases: A Comparative study. JCDR 11(6): 60-64.
-
Hasana M, Durranib O, Khanc K, Khurshid AR, Imran TS, et al. (2016) Can photographs replace lateral cephalograms? An evaluation of orthodontic clinician’s ability to assess selected cephalometric readings from extra-oral photographs. POJ 8(1): 2-6.
-
Zhang X, Hans MG, Graham G, Kirechner HL, Redline S (2007) Correlations between cephalometric and facial photographic measurements of craniofacfial form. Am J Orthod Dentofacial Orthop 131(1): 67-71.
-
Patel D, Trivedi R (2013) Photography versus lateral cephalogram: Role in facial diagnosis. Indian J Dent Res 24(5): 587-592.
-
Banerjee S, Ray S, Narayan SV, Seth S, Jana D (2019) Comparative Study of Photographic and Cephalometric Measurements in Adult Female Bengalee Population. IOSR Journal of Dental and Medical Sciences 18(5): 33- 39.
-
Gomes LCR, Horta KOC, Luiz GG Jr, Goncalves M, Goncalves JR (2013) Photographic assessment of cephalometric measurements. Angle Orthod 83(6): 1049-1058.
-
Ozdemir ST, Sigirli D, Ercan I, Cankur NS (2009) Photographic facial soft tissue analysis of healthy Turkish young adults: anthropometric measurements. Aesthetic plast Surg 33(2): 175-184.
-
Verma SK, Maheshwari S, Gautam SN, Prabhat K, Kumar S (2012) Natural head position: key position for radiographic and photographic analysis and research of craniofacial complex. J Oral Biol Craniofac Res 2(1): 46- 49.
-
Bishara SE, Jorgensen GJ, Jakobsen JR (1995) Changes in facial dimensions assessed from lateral and frontal photographs. Part I—Methodology. Am J Orthod Dentofacial Orthop 108(4): 389-393.
-
Oliveria, MT, Candemil, A (2013) Assessment of the correlation between cephalometric and facial analysis. Journal of Research in Dentistry 1(1): 34-40.
-
Bittner C, Pancherz H (1990) Facial morphology and malocclusions. Am J Orthod Dentofacial Orthop 97(4): 308-315.
-
Farishta S, Varma DPK, Reddy KS, Chandra S, Nanda Z (2011) Cephalometric Evaluation-based on Steiner’s Analysis on Young Adults of Chhattisgarh, India. J Contemp Dent Pract 12(3): 174-178.
-
Wasserstein A, Shpack N, Yoseph Y, Geron S, Davidovitch M, et al. (2015) Comparison of lateral photographic and radiographic sagittal analysis in relation to Angle’s classification. J Orofac Orthop 76(4): 294-304.
-
David PB (2016) Variations in the Soft Tissue Profile and Their Relevance to the Clinical Assessment of Skeletal Pattern. British Journal of Orthodontics 2(4): 235-238.
-
Ferrario VF, Serrao G, Ciusa V, Morini M, Sforza C (2002) Cephalometric and in vivo measurements of maxillomandibular anteroposterior Discrepancies: A Preliminary Regression Study. Angle Orthod 72(6): 579- 584.
-
Bishara SE, Jorgensen GJ, Jakobsen JR (1995) Changes in facial dimensions assessed from lateral and frontal photographs. Part I—Methodology. Am J Orthod Dentofacial Orthop 108(4): 389-393.
-
Schaaf H, Wilbrand JF, Boedeker RH, Howaldt HP (2010) Accuracy of photographic assessment compared with standard anthropometric measurements in nonsynostotic cranial deformities. Cleft Palate Craniofac J 47(5): 447-453.
-
Lee MS, Chung DH, Lee JW, Cha KS (2010) Assessing soft-tissue characteristics of facial asymmetry with photographs. Am J Orthod Dentofacial Orthop 138(1): 23-31.
-
Dvortsin DP, Ye Q, Pruim GJ, Dijkstra PU, Ren Y (2011) Reliability of the integrated radiograph-photograph method to obtain natural head position in cephalometric diagnosis. Angle Orthod 81(5): 889-894.
-
Oh HS, Korn EL, Zhang X, Liu Y, Xu T, et al. (2009) Correlations between cephalometric and photographic measurements of facial attractiveness in Chinese and US patients after orthodontic treatment. Am J Orthod Dentofacial Orthop 136(6): 762e1-14.
-
Negi G, Ponnada S, Aravind NKS, Chitra P (2017) Photogrammetric Correlation of Face with Frontal Radiographs and Direct Measurements. J Clin Diagn Res 11(5): ZC79-ZC83.
-
Chitraa P, Prakash (2017) A Photogrammetry as a tool to aid orthodontic diagnosis and treatment assessment. Journal of Contemporary Orthodontics 1(2): 50-55.
-
Power G, Breckon J, Sherriff M, McDonald F (2005) Dolphin Imaging Software: An analysis of the accuracy of cephalometric digitization and orthognathic prediction. Int J Oral Maxillofac Surg 34(6): 619-626.
-
Lalakiya H, Baswaraj, Agrawal C, Patel U, Ramani A, et al. (2016) The Comparison of Computer Aided Digital Cephalometric Radiograph with Manual Tracing. IJAR 4(1): 621-626.
-
Ramegowda S, Reddy B, P Kumar S, Patel C (2015) Photographic And Cephalometric Evaluation And Comparision Of Craniofacial Features In Siblings - A Clinical Study. Indian Journal of Dental Sciences 7(3): 22-25.
-
Paixão MB, Sobral MC, Vogel CJ, de Araujo TM (2010) Comparative study between manual and digital cephalometric tracing using Dolphin Imaging software with lateral radiographs. Dental Press J Orthod 15(6): 123-130.
-
Durão AR, Pittayapat P, Rockenbach M, Raphael O, Suk N, et al. (2013) Validity of 2D lateral cephalometry in orthodontics: a systematic review. Prog Orthod 14(31): 1-11.
-
Di Blasio A, Blasio C, Pedrazzi G, Cassi D, Magnifico M, et al. (2017) Combined photographic and ultrasonographic measurement of the ANB angle: a pilot study. Oral Radiol 33(3): 212-218.
-
David DF (1974) The value of PM reference line for estimating natural head position. Angle Orthod 44(3): 189-193.
-
Zeisse C (1951) Photography and cephalometry in daily orthodontic practice. Am J Orthod Dentofacial Orthop 37(12): 929-945.
- Psychogenic Erectile Dysfunction in Late Adulthood: A Case Report on Clinical Intervention and Intimacy Restoration
- Clinical Trials on COVID-19 in 2025: A New Chapter in Global Health Research
- Innovations and Challenges in Contemporary Medical Clinical Trials: An Editorial Perspective
- Innovations and Challenges in Contemporary Medical Clinical Trials: A Critical Perspective
- Reimagining Clinical Trials: The Power of Continuous Feedback from Medical Reports
- Factors Influencing Brain Drain: Perspectives from a Medical School in Turkey