MEG and Pico-Tesla-TMS in Patients with Atrophy with a Double Blind Experimental Designs
We used a whole-head 122 channel MEG system in a magnetically shielded room and a double-blind experimental design to 5 male patients with cerebral atrophy with age ranging from 19-25 years. The pT-TMS was applied to the above patients with magnetic field amplitude (1-7.5pT) and frequency (8-13Hz). Each patient had two separate recording sessions consisting of 3 runs in which we gave real or sham pT-TMS. We then tried to predict the real and sham stimulation sessions based on the changes in the mean peak frequency difference in the 2-7Hz band observed in the patients' brain. After unblinding, there was an increase of frequencies in the range of 2-7 Hz across the subjects followed by a normalization of their MEG. We observed that the results in 4 out of 5 patients were statistically significant (80%). Although our results are preliminary only, they encourage more studies to be conducted.
Introduction
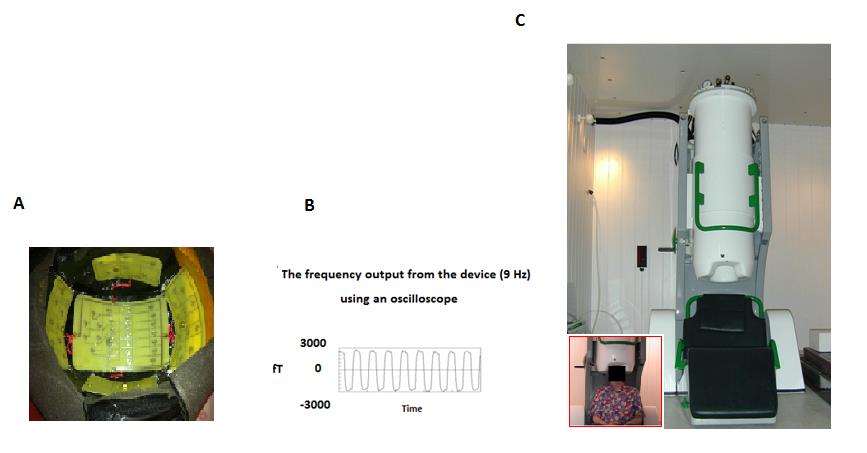
Transcranial Magnetic stimulation (TMS) is a method for diagnostic and therapeutic uses in a lot of neurological conditions. It is secure, non-invasive and was developed as a substitute to transcranial electrical stimulation [1]. Magnetoencephalography (MEG) is considered as a non- invasive method for recording the magnetic fields produced by the neuronal brain activity. The MEG exhibits extremely high temporal resolution (better than 1 ms) and complements other brain activity mapping techniques, such as electroencephalography (EEG), positron emission tomography (PET), and functional magnetic resonance imaging (fMRI). Compared MEG to EEG is characterized by better spatial resolution because magnetic fields are less distorted by the skull and scalp than electric fields. MEG detects only the tangential components of a current source, in contrast to the EEG which is sensitive to both tangential and radial components. The EEG can detect activity both in the sulci and at the top of the cortical gyri, whereas MEG is most sensitive to activity originating in sulci. Finally, MEG is reference-free, while EEG relies on a reference [2]. Professors Anninos & Tsagas [3] invented an electronic device that can increase the (2-7Hz) abnormal MEG brain frequencies towards frequencies of less or equal to their alpha frequencies (8-13Hz). The electronic device consists of one generator that produces alternative low voltage of frequencies from 2-7Hz, and supplies a number of selected coils of one group which consists of alike rows of coils, or a plurality of groups of similar coils arranged in rows. The pico-Tesla (pT)(1pT=10exp(-12)T)-TMS electronic device is a modified helmet enclosing up to 122 coils that cover the 7 brain regions: Frontal, Vertex, Occipital, right-left Temporal and right-left Parietal (Figure 1A). It produces modulations of magnetic flux (intensity: 1-7.5pT) in the alpha frequency range (8- 13Hz) for each patient (Figures 1B, 1C) [4, 5, 6, 7, 8, 9, 10, 11, 12].
2Hz and intensity of 7.5pT for 6 minute period, resulted in a rapid and dramatic attenuation of PD disability and in an almost complete resolution of the dyskinesias. Finally, Spagnolo, et al. [15] suggested that high frequency repetitive deep TMS might be a safe treatment for PD motor symptoms
Methods
In our lab, using a whole-head 122 channel gradiometer device (Neuromag-122, Neuromag Ltd, Helsinki, Finland, Figure 1C) we performed MEG recordings in a magnetically shielded room for 5 male Atrophy patients with their age ranging from 19-25 years as is explained in (Table 1) [4, 5, 6, 7, 8, 9, 10, 11, 12]. Our MEG records were taking with sampling frequency rate of 256Hz and associated Nyquist frequency of 128Hz, which was well above the constituent frequency components of interest and avoid aliasing artifacts. The MEG filtered with cut-off frequencies at 0.3 and 40Hz. The research protocol were approved by the Research Committee of our Democritus
University of Thrace. Funding for this work was provided by our collaboration of General Secretariat of Research and Technology, GR and the ERGO AEBE,INC,GR under research program (Grant Number:80623).
| Number of | Patients' Original Diseases | Age | ||
|---|---|---|---|---|
| Patients | ||||
| 1 | Epilepsy | 22 | ||
| 2 | Tetraplegia | 19 | ||
| 3 | Epilepsy | 25 | ||
| 4 | Instability | 25 | ||
| 5 | Epilepsy | 19 |
Table 1: This table is shown the ages for each patient and their original diseases. A software program was developed in our lab i
Table 1: This table is shown the ages for each patient and their original diseases. A software program was developed in our lab in order to detect the amplitude of the primary dominant frequency of the power spectra of the MEG obtained from each Atrophy patient and channel after the application of Fast Fourier Transform (FFT). Then we looked for interest at (alpha: 8-13Hz) for calibration of the electronic device and (2-7Hz) for the analysis at the primary dominant frequency of the power spectra of the MEG records obtained from each Atrophy patient and channel after the FFT application. Every Atrophy patient was scanned in two sessions. The first session consisted of 2-minute resting state MEG scan and the data were used to establish the subject’s alpha frequency (8-13Hz) for calibration of the pT-TMS electronic device. In the second session the pT-TMS electronic device was set to real or sham stimulation by a third party. Neither the researcher nor the participant were aware of the state of the device. Then, 2 minutes of pre-stimulus baseline MEG data were recorded (run1).Next, 2-minutes of real or sham pT-TMS stimulation were administered with the patient sitting comfortably just outside the scanner room. Following these 2-minutes of stimulation, a further 2-minutes of resting state MEG was acquired (run 2). This was followed by another 2-minutes of stimulation, but in this case the device was switched from sham to real or vice versa by the third party, and 2 more minutes of MEG scanning data was recorded (run 3). The task is to identify where the sham stimulation was delivered (before recording run2 or before recording run3). Based on the frequency differences across all channel groups it was possible to make a prediction of the likely stage (run2 sham or run3 sham) of the pT-TMS in each of the 5 recordings MEG Atrophy patients. In our experimental procedure for the run1, run2, run3 and for the stimulation were done immediately one after another in order to see the effect of the stimulation. In order to blindly identify real from sham stimulation it was necessary to predict the frequency increase due to pT- TMS from all recorded MEG channels for each Atrophy patient. This can be accomplished by calculating the increase in primary dominant frequency from sham to real stimulation under two conditions. Having this in mind, then it can be estimated either the average frequency difference from each brain channel by calculating the differences between each average frequency of (run1+run3)/2 from the run2 if the run3 is the sham and run2 is the real stimulation or the average frequency differences of (run1+run2)/2 from the run3 if the run2 is the sham and run3 is the real stimulation for the same Atrophy patient for each brain channel, where run1 is the baseline MEG recordings for both calculations. If after all these calculation we have a mean peak frequency difference (MPFD) to be greater for a particular Atrophy patient then run2 will be the real stimulation and run3 the sham stimulation in the first consideration or if the MPDF is greater in the second consideration then run3 will be the real stimulation and the run2 will be the sham stimulation.
Results
Table 2 shows the brain regions and the corresponding channels in each brain region. We have attempted to determine the order of stimulation (run2 sham or run3 sham) based on the MPFD as is shown in Table 3. On each of the 5 Atrophy patients we based our predictions on any order gave rise to the largest change in the MPFD from all MEG recorded channels. In Table 2, based on the knowledge of the true stimulation sequence, we can show the true effect of pT-TMS. Based on the binomial test, the probability for correctly selecting 4 or more events, each with probability of 0.5, from the 5 patients is highly statistical significant or at chance level (80%).In order to determine the maximum effect of stimulation for each of the 7 brain regions we based our results to the maximum on the MPFD for all patients.
| Brain Regions | Channels | ||||
|---|---|---|---|---|---|
| Right Temporal | 1-14 ,111-120 | ||||
| Left Temporal | 43-50,55-62,67-74 | ||||
| Right Parietal | 5-6,11-16,97-100,109,110 ,115- 122 | ||||
| Left Parietal | 47-52,59-64,71-74,79,80,87-90 | ||||
| Frontal | 17-42 | ||||
| Occipital | 75-86,91-96, 101-110 | ||||
| Vertex | 13-16,49-54,61- 66,73,74,89,90,99,100, 117-122 |
Table 2: This table shows the brain regions and the corresponding channels in each brain region. In Table 3 is shown the maximum
Table 2: This table shows the brain regions and the corresponding channels in each brain region. In Table 3 is shown the maximum effect of the MPFD in real and sham stimulations for each of the 5 patients for each of the 7 brain regions. Table 4 shows the statistical analysis for the 5 patients. The results were statistically significant at the level of 0.05. We observed that the results 4 out of 5 patients were statistically significant (80%).
| P | RT | RT | 2 | LT | LT | RP | RP | LP | LP | S | F | F | V Run3 Sham | V Run2 Sham | O | O | ||||||||||||||||||||||||
|---|---|---|---|---|---|---|---|---|---|---|---|---|---|---|---|---|---|---|---|---|---|---|---|---|---|---|---|---|---|---|---|---|---|---|---|---|---|---|---|---|
| Run3 | Run | Run3 | Run2 | Run3 | Run2 | Run3 | Run2 | Run3 | Run2 | Run3 | Run2 | |||||||||||||||||||||||||||||
| Sham | Real | Sham | Real | Sham | Real | Sham | Real | ham | Real | Sham | Sham | |||||||||||||||||||||||||||||
| 1 | 1.69 | 5.1 | 2.44 | 5.31 | 3.88 | 5.56 | 5.69 | 5.31 | 4.69 | 4.81 | 2.88 | 5.44 | 5.68 | 5.63 | ||||||||||||||||||||||||||
| 2 | 3.06 | 4.41 | 4.41 | 5.44 | 3.31 | 4.41 | 4.4 | 4 | 4.56 | 3.44 | 4 | 4.41 | 3.31 | 3.91 | ||||||||||||||||||||||||||
| 3 | 0.28 | 2 | 1.91 | 2.94 | 0.28 | 2.88 | 1.91 | 5.63 | 0.84 | 3.94 | 0.78 | 5.63 | 2.06 | 4.13 | ||||||||||||||||||||||||||
| 4 | 2.31 | 4.25 | 2.38 | 2.38 | 1.81 | 4.25 | 1.75 | 5.13 | 2.75 | 2.88 | 1.13 | 4.06 | 1.94 | 5.13 | ||||||||||||||||||||||||||
| 5 | 0.31 | 5.34 | 4 | 5.31 | 2.81 | 4.5 | 3.72 | 3.22 | 1 | 3.88 | 3.72 | 4.5 | 1.84 | 5.34 |
Table 3: Statistical analysis for 5 patients of Table 2. The results are statistical significant at the level of 0.05 (marked bol
- Table 3: This table shows the maximum effect of the MPFD in real and sham stimulations for each patient according to the order of stimulation (run2 sham or run3 sham). (P: the patient number, RT right temporal, LT: left temporal, RP: right parietal, LP: left parietal, F: frontal, V: vertex, O: occipital).
- Patients
- RUN2(REAL) Mean±SD
- RUN3(SHAM) Mean±SD t-test P values
- 1
- 5.3±0.28
- 3.85±1.58
- 0.033
- 2
- 4.29±0.62
- 3.87±0.63
- 0.229
- 3
- 3.88±1.39
- 1.15±0.79
- 0.0007
- 4
- 4.011±1.05
- 2.01±0.53
- 0.0007
- 5
- 4.58±0.82
- 2.49±1.46
- 0.0062
Table 4: Statistical analysis for 5 patients of Table 2. The results are statistical significant at the level of 0.05 (marked
Discussion
In this study was set out to reproduce the effects of the increased abnormal dominant frequencies of 2-7Hz band
References
-
Barker AT, Jalinous R, Freeston IL (1985) Non - invasive magnetic stimulation of human motor cortex. Lancet 1(8437): 1106-1107.
-
Sheridan CJ, Matuz T, Draganova R, Eswaran H, Preissl H (2010) Fetal Magnetoencephalography - Achievements and Challenges in the Study of Prenatal and Early Postnatal Brain Responses: A Review. Infant Child Dev 19(1): 80-93.
-
Anninos PA, Tsagas N (1995) Electronic apparatus for treating epileptic individuals. US patent 5453072.
-
Anninos P, Adamopoulos A, Kotini A, Tsagas N (2016) MEG evaluation of pico-Tesla external TMS on multiple sclerosis patients. Mult Scler Relat Disord 8: 45-53.
-
Anninos P, Adamopoulos A, Kotini A, Tsagas N (2016) Combined MEG and pT-TMS study in Parkinson's disease. J Integr Neurosci 15(2): 145-162.
-
Anninos P, Kotini A, Anninou N, Adamopoulos A, Papastergiou A, et al. (2008) MEG recordings of patients with CNS disorders before and after external magnetic stimulation. J Integr Neurosci 7(1): 17-27.
-
Anninos P, Adamopoulos A, Kotini A, Tsagas N, Tamiolakis D, et al. (2007) MEG evaluation of Parkinson's diseased patients after external magnetic stimulation. Acta Neurol Belg 107(1): 5-10.
-
Anninos P, Kotini A, Adamopoulos A, Tsagas N (2003) Magnetic stimulation can modulate seizures in epileptic patients. Brain Topogr 16(1): 57-64.
-
Anninos PA, Tsagas N, Jacobson JI, Kotini A (1999) The biological effects of magnetic stimulation in epileptic patients. Panminerva Med 41(3): 207-215.
-
Anninos PA, Tsaga N, Sandyk R, Derpapas K (1991) Magnetic stimulation in the treatment of partial seizures. Int J Neurosci 60(3-4): 141-171.
-
Anninos P, Adamopoulos A, Kotini A, Tsagas N (2000) Nonlinear analysis of brain activity in magnetic influenced Parkinson patients. Brain Topogr 13(2): 135-144.
-
Moisello C, Blanco D, Fontanesi C, Lin J, Biagioni M, et al. (2015) TMS enhances retention of a motor skill in Parkinson’s disease. Brain Stimul 8(2): 224-230.
-
Rothwell JC (1997) Techniques and mechanisms of action of transcranial magnetic stimulation of human cortex. J Neurosci Methods 74(2): 113-122.
-
Sandyk R, Anninos PA, Tsagas N, Derpapas K (1992) Magnetic fields in the treatment of Parkinson’s disease. Int J Neurosci 63(1-2): 141-150.
-
Spagnolo F, Volonté MA, Fichera M, Chieffo R, Houdayer E, et al. (2014) Excitatory deep repetitive transcranial magnetic stimulation with H-coil as add- on treatment of motor symptoms in Parkinson’s disease: an open label, pilot study. Brain Stimul 7(2): 297-300.
- A Review of Gene Therapy for Parkinson's Disease to Control Dopaminergic Neurons
- Late-Onset Myasthenia Gravis in a Patient with Recurrent Breast Cancer: A Case Report
- Covid-Induced Dystonia and Opsoclonus: A Case Report
- Generalized Tonic-Clonic Seizure in a Pediatric Patient with Sunflower Syndrome: A Case Report
- Comparison of Doppler Guided Seldinger Technique Versus Classic Palpatory Seldinger Technique for Radial Artery Cannulation-an Open Label Randomized Controlled Trial
- Brown Sequard Syndrome: Understanding the Complexities of Spinal Cord Injury