Diurnal Response of CO2 Radiative Cooling to September 7-9, 2017 Storm
The solar and magnetospheric energy deposition into Earth’s high latitude region modulates the magnetosphere-ionospherethermosphere system during geomagnetic storm periods. One of the impacts of geomagnetic storm is the significant thermosphere temperature increment. This temperature increase is regulated by radiative cooling emissions via CO2 at 15 μm and NO 5.3 μm. We utilized CO2 15 μm radiative emissions observations by SABER (Sounding of the Atmosphere using Broadband Emission Radiometry) instrument onboard NASA’s TIMED (Thermosphere Ionosphere Mesosphere Energetics Dynamics) satellite, to investigate the diurnal response during September 7-9, 2017 storm. The volume emission rate of CO2 emission, in the altitude of 100-140 km, is integrated vertically to estimate cooling flux. The geomagnetic storm induced a significant enhancement in CO2 emission across all latitudes and altitudes considered. While the storm typically has stronger impacts on high latitudes, the response in CO2 emission was notably stronger in mid and low latitude regions both during day and night. The nighttime value is generally lower, with a faster response time, as compared to the day time counterpart. Further a strong hemispheric asymmetry is observed both during day and night. This study highlights a complex interplay of solar and magnetospheric influences on the diurnal variation of Earth's upper atmosphere.
Abbreviations
NO: Nitric Oxide; CME: Coronal Mass Ejection; SABER: Sounding of the Atmosphere using Broadband Emission Radiometry; VER: Volume Emission Rate; IMF: Interplanetary Magnetic Field; TIMED: Thermosphere Ionosphere Mesosphere Energetics Dynamics; SZA: Solar Zenith Angle.
Introduction
The interaction between solar wind and magnetosphere deposits huge amount of solar and magnetospheric energy into Earth’s high latitude region. It perturbs the whole magnetosphere-ionosphere-thermosphere system including Joule heating rate, wind circulation patterns etc. The increased Joule heating rate creates a composition bulge and upwelling of depleted O/N2 ratio (mean molecular mass) which propagates into mid and low latitude regions by the storm-induced meridional wind [1, 2, 3]. The flow of equatorward storm-induced meridional wind strongly depends on the longitude, season, local time and solar-driven circulation patterns [1, 4, 5]. It has higher preference towards the region with magnetic pole and summer hemisphere [5]. The former is due to the combined effect of geometrically aligned convection pattern and magnitude of anti-sunward wind. The latter is related to the directional preferences of the prevailing background wind and horizontal advection [2]. In addition to the chemical changes, the energy deposition, during geomagnetic storm, increases the thermospheric temperature by hundreds of degree kelvin. This thermospheric temperature variation is regulated effectively by well-know thermospheric cooling emission resulting from Nitric Oxide (NO) at 5.3 µm and CO2 at 15 µm [6]. NO emission is dominant above 110 km whereas that by CO2 plays important role in the altitude below 130 km. Although both emissions play decisive roles in the regulation of thermospheric temperature, the response of CO2 emission is relatively less explored ([7, 8, 9, 10, 11] and references therein). We, here, present the diurnal response of CO2 emission to the geomagnetic storm of September 7-9, 2017 by using the TIMED-SABER satellite measurements. We divide this study into four sections.
Section 2 describes the data acquisition and analysis methods. The diurnal response is discussed in section3. Finally, we conclude the paper with summary in sections 4.
Data Analysis
The SABER (Sounding of the Atmosphere using Broadband Emission Radiometry) instrument, onboard the TIMED (Thermosphere Ionosphere Mesosphere Energetics
Results and Discussion
Dynamics) satellite, is a limb sounder which measures radiance (W.cm-2.sr-1) from 1.27 to 16.9 m in 10 distinct spectral channels covering the altitude from hard surface to about 400 km and back [12, 13]. SABER has an asymmetric hemispheric coverage from about 53° in one hemisphere to 83° in the other that changes every 60-65days [12].
SABER measurements include two dominating thermospheric coolants namely NO and CO2 [13]. We present only CO2 emission in the present study. CO2 radiative cooling rate in Kelvin per day (Kd^{-1}) is calculated by applying the Curtis Matrix approach to the SABER-derived pressure and temperature under non-local thermodynamic equilibrium condition. Then, the vertical profile of the CO2 cooling rate (W.m-3) is estimated by using the first law of thermodynamics [14, 15]. The cooling rate (W.m-3) from 100 to 140 km is vertically integrated to get cooling flux (W.m-2). It has an uncertainty of about 15% [15].
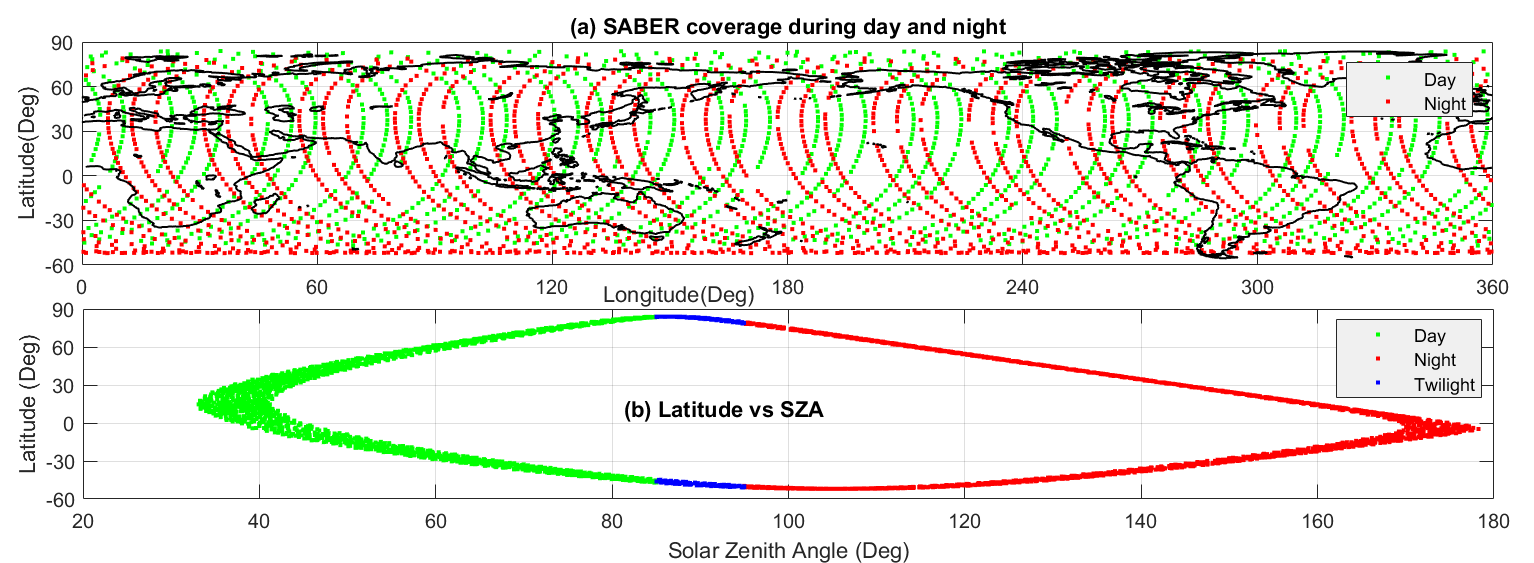
During the event presented here, SABER was on north-view mode and covered about -53°S to 83°N latitude (Figure 1). The CO2 volume emission rate (VER) data are separated into day and night by considering solar zenith angle (SZA); SZA less than 85o and greater than 95o are respectively, considered as day and nighttime. In the present study we have used SABER version 2.0 data obtained via https://saber.gats-inc. com/data_services.php. The data are then binned into 5°x20° latitude- longitude grid and 5°x2 latitude-time (hr) grid.
The solar and interplanetary data are obtained from the WIND spacecraft at L1 point (https://wind.nasa.gov/mfi). The SYM-H index is from SPDF OMNIWeb database (https:// omniweb.gsfc.nasa.gov).
The geomagnetic storm of September 7-9, 2017 resulted due to the coronal mass ejection (CME) associated with solar X-flares on September 6, 2017. The Bz component of interplanetary magnetic field (IMF) turned southward which led to an intense geomagnetic storm following day with strong increase in the solar and IMF parameters, and solar energy input into the magnetosphere (Figure 2). The minimum SYM-H index reached the value of about -146 nT with a longer recovery ([16] and references therein).
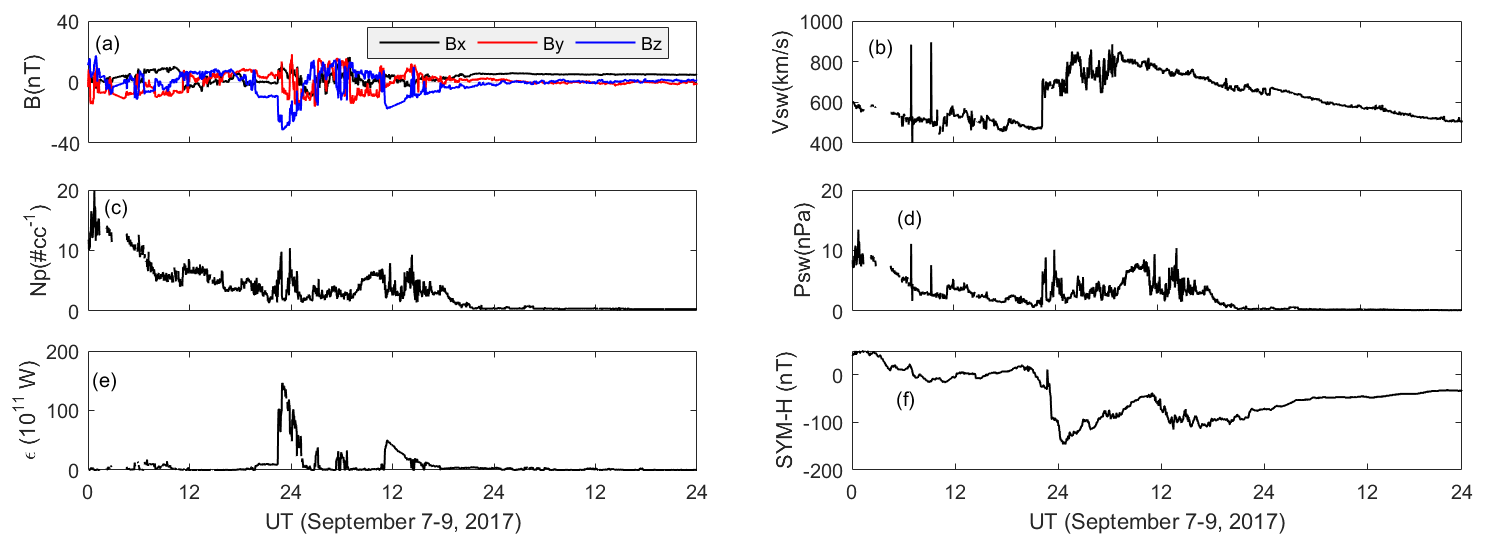
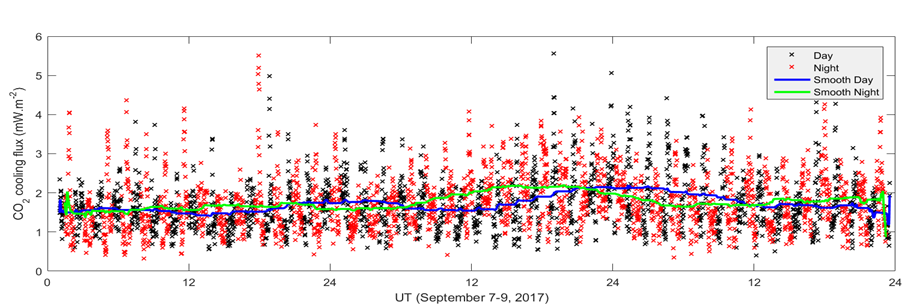
Figure 3 depicts the temporal variation of CO2 cooling flux during day and night along with respective smoothed values. A strong increase in the CO2 emission is noticed during geomagnetic storm period.
Although CO2 shows almost an identical variation both during day and night, it has a faster response during night.
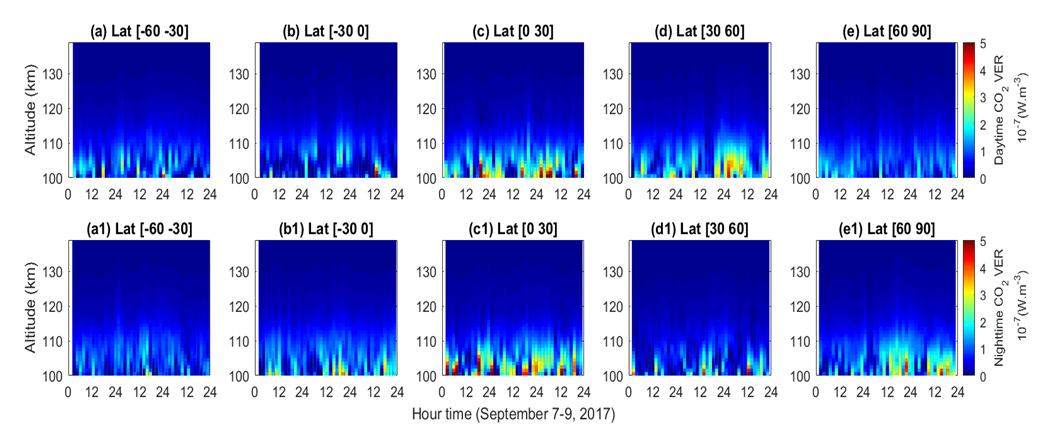
The time-altitude cross-sectional view of CO2 VER is shown in Figure 4. The CO2 VER increase over the altitudes during storm period with maximum cooling is observed below 120 km. It is well known that the solar and magnetospheric energy is deposited into the high latitude region which subsequently propagates into low and mid latitude regions by meridional wind.
Consequently, CO2 emission in the high latitude is expected to have a stronger response. However, it can be observed from Figure 4 that CO2 shows a stronger response in mid and low latitude region, although it increases all over the latitude sectors. Both during day and night, CO2 emission is strongest in the low latitude region (Figure 4c & c1). It shows an unusual behavior over mid-high latitudes in the northern hemisphere. The mid latitude shows a stronger enhancement during the recovery phase in daytime (Figure 4d), whereas, the nighttime emission is stronger in the high latitude during recovery phase (Figure 4e1).
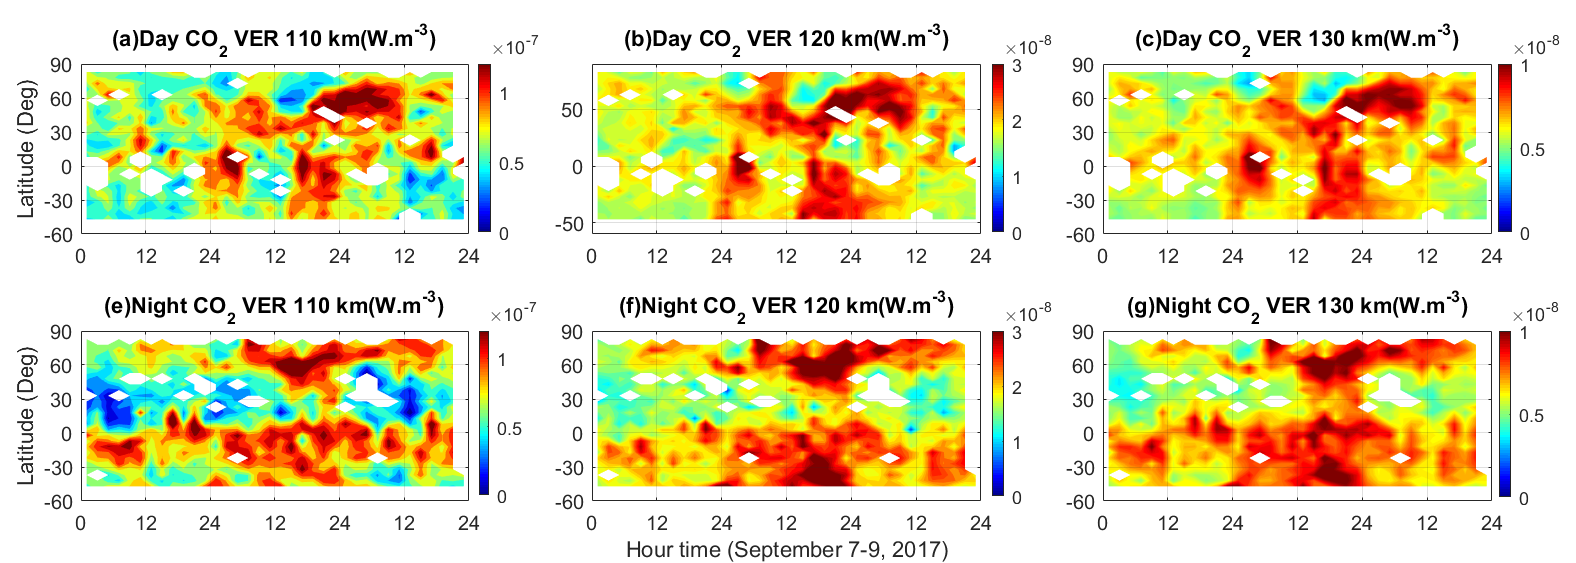
The latitude-time cross-sectional view of CO2 VER at three different altitudes are depicted in Figure 5. The CO2 VER decreases with increasing altitude. Both the daytime and nighttime VERs have enhancements all over the considered altitude as the storm commenced. However, a strong difference can be noticed in the altitudinal variation of cooling emission during day and night; relatively higher daytime value than night.
Both during day and night, abundance of CO2 emission is mainly located in the mid and low latitude sectors in both hemispheres. It is more pronounced during night time. As the storm intensifies, the region of maximum CO2 emission spreads towards high latitude region. This latitudinal coverage increases with increase in the altitude. An inter- hemispheric propagation is also clearly noticed above 120 km altitude (Figure 5c & g).
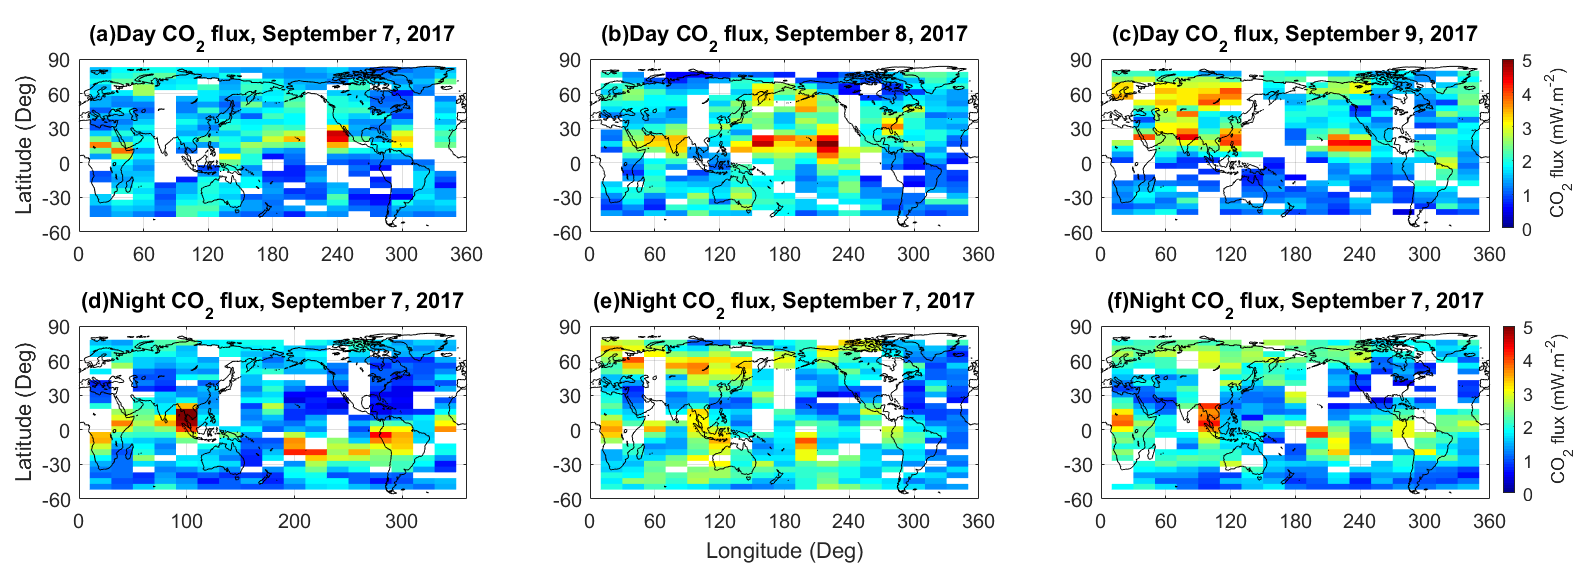
The global variation of diurnal CO2 cooling flux during September 7-9, 2017 storm is depicted in Figure 6. A strong diurnal variation is noticed over the globe. The daytime CO2 flux is higher during September 8, 2017 (Figure 6b). It is primarily located in 120-240°E longitude region over northern hemisphere. During the recovery phase on September 9, 2017, stronger CO2 flux is observed in northern hemisphere over the eastern longitude sector. On the contrary, the nighttime CO2 flux is stronger in the southern low latitude (0 to -30°S) during September 7, and eastern longitude of northern hemispheric high latitude (>50°N) region during September 8. A large increase with strong hemispheric asymmetry can be observed both during day and night. In addition, the nighttime CO2 undergoes stronger change as compared to the daytime value. Similar strong storm-time hemispheric asymmetry has been reported earlier in NO cooling flux [7, 8, 9].
Summary
We present the diurnal variation of CO2 cooling emission during the geomagnetic storm of September 7-9, 2017. The CO2 cooling flux, calculated by using the TIMED/SABER satellite observations, shows a significant enhancement globally. The salient features of this study are as follows, (I) CO2 volume emission rate (VER) rises during storm period, (II) CO2 cooling flux increases significantly during geomagnetic storms, with a faster nighttime response as compared to daytime, (III) CO2 emission is stronger in low latitude regions during both day and night, with unusual mid-high latitude behavior in the northern hemisphere during the recovery phase, (IV) Over all CO2 cooling flux shows strong diurnal variation and hemispheric asymmetry.
Acknowledgments
The author thanks TIMED/SABER science team, WIND and OMNIweb for providing the data used in this study.
References
-
Fuller-Rowell TJ, Codrescu MV, Moffett RJ, Quegan S (1994) Response of the thermosphere and ionosphere to geomagnetic storms. J Geophys Res 99(A3): 3893-3914.
-
Fuller-Rowell TJ, Codrescu MV, Moffett RJ, Quegan S (1996) On the seasonal response of the thermosphere and ionosphere to geomagnetic storms. J Geophys Res 101(A2): 2343-2353.
-
Fuller-Rowell TJ, Codrescu MV, Millward GH, Richmond AD (2002) Storm time changes in the upper atmosphere at low latitude. J Atmos Sol Terr Phys 64(12-14): 1383- 1391.
-
Cravens TE (1981) The Global Distribution of Nitric Oxide at 200 km. J Geophys Res 86(A7): 5710-5714.
-
Cravens TE, Killen TL (1988) Longitudinally asymmetric transport of Nitric Oxide in the E-region. Planet Space Sci 36(1): 11-19.
-
Kockarts G (1980) Nitric oxide cooling in the terrestrial atmosphere. Geophys Res Lett 7(2): 137-140.
-
Bag T (2018) Diurnal Variation of Height Distributed Nitric Oxide Radiative Emission During November 2004 Super-Storm. J Geophys Res Space Phys 123(8): 6727- 6736.
-
Bag T (2018) Local-time hemispheric asymmetry in Nitric Oxide radiative emission during geomagnetic activity. J Geophys Res Space Phys 123(11): 9669-9681.
-
Bag T, Z Li, Rout D (2020) SABER observation of storm-time hemispheric asymmetry in nitric oxide radiative emission. J Geophys Res Space Phys 126(4): e2020JA028849.
-
Bag T, Rout D, Ogawa Y, Singh V (2023) Distinctive response of thermospheric cooling to ICME and CIR- driven geomagnetic storms. Front Astr Space Sci 10: 1-9.
-
Bag T, Ogawa Y (2024) Enhanced response of thermospheric cooling emission to negative pressure pulse. Sci Rep 14: 9647.
-
Russell III JM, Mlynczak MG, Gordley LL, Tansock JJ (1999) An overview of the SABER experiment and preliminary calibration results. SPIE Conference on Optical Spectroscopic Techniques and Instrumentation for Atmospheric and Space Research III. SPIE, USA 3756.
-
Yee J, Talaat ER, Christensen AB, Killeen TL, Russell JM, et al. (2003) TIMED Instruments. Johns Hopkins APL Technical Digest, 24(2): 156-163.
-
Mlynczak M, Martin-Torres FJ, Russell J, Beaumont K, Jacobson S, et al. (2003) The natural thermostat of nitric oxide emission at 5.3 µm in the thermosphere observed during the solar storms of April 2002. Geophys Res Lett 30(21): 2100.
-
Mlynczak MG, Hunt LA, Martin-Torres FJ, Marshall BT, Mertens CJ, et al. (2010) Observations of infrared radiative cooling in the thermosphere on daily to multiyear timescales from the TIMED/SABER instrument. J Geophys Res 115(A3): A03309.
-
Habarulema JB, Katamzi-Joseph ZT, Buresova D, Nndanganeni R, Matamba T, et al. (2020) Ionospheric response at conjugate locations during the 7–8 September 2017 geomagnetic storm over the Europe- African longitude sector. J Geophys Res Space Physics 125(10): e2020JA028307.
- Early Universe: Hadronic Crystals Coherent Micro Gravitational Wave Emitters PHYSICS Part II
- The Solar System Constraint Maze: A Scientific Dead-End Revealing the Interuniversal Machine
- Assessment of Radiofrequency Radiation from 2G and 3G Mobile Phone Handsets
- Early Universe Magneto-Gravitational Coupling Genesis Physics: Part I
- Falsifiability of the Classical Law of Gravitation and Unveiling the Time-temperature Entanglement of the Universe
- Origin of Ancient Civilisations The Southern Hemisphere’ Scenario