Multifocal ERG Changes as an Indicator for Short-Term Outcome after Intravitreal Injection of Ranibizumab in Treatment of Diabetic Macular Oedema
Background: compared to laser photocoagulation, intra vitreal injection of anti-vascular endothelial growth factors (Anti VEGFs) have more desirable results and fewer complications. Study of this issue by multifocal electroretinogram (mf-ERG) revealed significant improvement in macular function associated with decreased retinal thickness using optical coherence tomography (OCT) and improvement of best corrected visual acuity (BCVA). Purpose: To study the role of multifocal Electroretinogram in the follow up of diabetic macular edema after intravitreal injection Ranibizumab and study its correlation to visual acuity and optical coherence tomography changes. Methods: A non-randomized prospective study was carried out from February 2018 to August 2018 on 32 eyes of patients with diffuse or focal DME without macular ischemia. The patients were selected from the outpatient ophthalmology clinic of Al-Hussein University hospital. The patients were injected intravitreally by Ranibizumab 0.5mg/0.05mL at baseline, 1 and 3 months. In this study we assessed pre and post-injection BCVA, IOP measurement by applanation tonometer, OCT and multifocal ERG changes over 3 months. Results: log MAR BCVA improved from (0.88±0.12) preoperatively to (0.53±0.18) at the end of the 3rd month, with P-value
Introduction
Diabetic retinopathy (DR) is one of the leading reasons of blindness throughout the world, and diabetic macular edema (DME) is a major complication of DR which leads to visual acuity loss [1]. The Early Treatment Diabetic Retinopathy Study (ETDRS) pointed out that laser treatment was a significant therapy in clinically significant macular edema (CSME), and it has been identified as the gold standard for the treatment of DME [2].
However, it carries risks in many cases, and efficient laser treatment may still not prevent the progression of diffuse macula edema in the long term. Vascular endothelial growth factor (VEGF) is considered to be the main stimulus generation of diabetic macular edema, and pharmacologic therapies that inhibit VEGF may directly target the main cause of the pathology [3]. Studies in this field have been conducted using different anti-VEGF agents such as pegaptanib sodium, bevacizumab, and ranibizumab [4].
Ranibizumab is a human anti-VEGF monoclonal antibody, which can be used in combination with all VEGF-A active Isomers. A small phase I clinical trial of the intravitreal injection of ranibizumab for treatment of DME showed that the patients’ condition improved, and there were no ocular or systemic adverse reactions reported at the end of the treatment [5].
High-resolution optical coherence tomography (OCT) can be used to identify the changes in central retinal microstructure. Previously, retinal morphological changes in DME could only be observed by time domain OCT scans. The current spectral domain optical coherence tomography (OCT) can give accurate analysis and provide precise data for the central retinal thickness. Advances in OCT technology have the ability to provide enhancement tools for clinicians to explain the cause of poor visual acuity (VA) in the treatment of DME. It determines the changes in the structure of the central retina, which may be related to subjective visual performance measurements, such as visual acuity and visual field [6]. With the development of multifocal electroretinogram (mf-ERG), we can use it to study central retina area more accurately, so as to objectively assess the macular dysfunction degree. It is an important objective test identifying functional changes in the retina in early phases of DR [7].
Aim of the Work
The aim of this work is to study the role of multifocal Electroretinogram (mf-ERG) in the follow up of diabetic macular edema after intravitreal injection of Ranibizumab and study its correlation to visual acuity and optical coherence tomography changes.
Patients and Methods
This non-randomized prospective study included 32 eyes of patients suffering from diffuse or focal DME without macular ischemia at Al-Hussein University Hospital from February 2018 to August 2018. The study protocol was adhered to the tenets of the declaration of Helsinki and was approved by the ethical board of Al-Azhar University. All patients informed about the details & the risk of the procedure and signed a written informed consent. The patients were injected intravitreally by (Ranibizumab 0.5mg/0.05mL) at baseline, 1 and 3months. In this study we assessed pre and post-injection BCVA, IOP measurement by applanation tonometer, OCT and multifocal ERG changes over 3 months.
Patient’s Selection
Inclusion criteria included age of 40-70 years, Patients with type II diabetes mellitus with non-proliferative diabetic retinopathy (NPDR) and significant focal or diffuse DME confirmed by FFA and OCT, and in addition, fair Glycosylated hemoglobin (HBA1c) level was recommended. Exclusion criteria included Media opacity that preclude adequate OCT, Patients with glaucoma, Patients with vitro-retinal pathology such as epiretinal membrane or vitro-macular traction, Patients with diffuse or central retinal degeneration that may affect multifocal ERG recording, and Patients with history of laser photocoagulation.
Methods
History taking included age, duration of diabetes, any systemic disease and drug intake, type, duration, and onset of diminution of vision, as well as previous ocular surgery or interventions. All visual acuity results were transformed to the common logarithm of the minimum angle of resolution (Log MAR). Intraocular pressure (IOP) measurement: using Goldman’s applanation tonometry.
FFA and Macular OCT were done prior to intervention then serially after injection at the end of 1st and 3rd postoperative months. Macular OCT was done to detect the presence of retinal thickening, cystoid macula edema, hard exudates and vitreoretinal interface. Baseline central retinal characteristics were analyzed by OCT through a dilated pupil. Line scans: vertical and horizontal 6 mm line scan passing through the central fovea. The line scan comprises 1024 axial scans. Sixteen scans for 16384 total data points averaged to single scan image.
Multifocal ERG was done using Ronald Consult RETI- port gamma plus2. It was recorded using skin electrodes, after 10 minutes of light adaptation and pupil dilation with tropicamide. The stimulus consisted of 61 hexagons, covering 25-30° of visual field and presented on a 20-inch monitor at a viewing distance of 28cm.
Data Output
The P1 amplitude and implicit time of the first order kernel of the mf-ERG from two concentric rings centered on the fovea were averaged and the mean from each ring summation was analyzed.
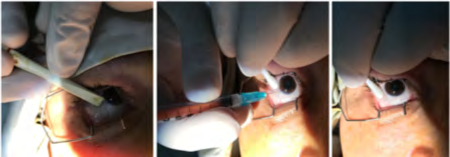
Operative Technique
Intravitreal injection was given at the operating theatre using aseptic technique (Figure 1). All patients received 3 injections at baseline, 1 and 2 months under topical anesthesia by Benoxinate HCL 0.4% eye drops. Ranibizumab (Lucentis) 0.5mg/0.05mL was injected through pars plana with a 28-gauge needle 4mm behind the limbus in phakic patients and 3.5mm in pseudophakic patients.
Post-Operative
The patients were monitored for potential injection related complications by measurement of BCVA, IOP, anterior segment and posterior segment evaluation at 1, 3 and 7 days after injection. The anatomical and functional responses to treatment were followed up at 1 and 3 months after baseline injection.
Statistical Analysis
For statistical analysis of the data, SPSS (Statistical package for social science) version 19 was used. Quantitative data were expressed as mean ± standard deviation (mean ± SD). Shapiro–Wilk test was used to assess the normality of the analyzed parameters’ distribution (normally distributed data & data not follow a normal distribution).
In the statistical comparison between the different groups, the significance of difference was tested using one of the following tests:
- Paired t-Test: One of the parametric tests was used to compare samples of normally distributed data.
- Wilcoxon Test: One of the non-parametric tests was used if the data not follow a normal distribution.
Correlation among data was assessed using Pearson coefficient. The confidence interval was set to 95% and the margin of error accepted was set to 5%. So, the probability value (P-value) was considered significant as the following: P-value≤ 0.05 was considered significant. P-value ≤0.001 was considered as highly significant. P-value > 0.05 was considered insignificant.
Results
Thirty-two eyes of twenty-five patients were selected. They were 12 females and 13 males. The average age was 56.86 ± 5years. The average duration of diabetes in patients was 14.93±3.06 years. FFA showed 25 eyes with diffuse DME and 7 eyes with focal DME. The average Log MAR BCVA was 0.88± 0.12. The average central subfield thickness 1mm was 408.73±79.4 µm. The average para & Peri-foveal thickness was 402±46.52µm. The average P1 amplitude in ring 1 was 33.08±10.95nv/deg2 and in ring 2 was 18.82±5.01nv/deg2. The average P1 implicit time in ring 1 was 78.65±12.37ms and in ring 2 were 48.81±6.44ms (Table 1).
| Thirty Eyes | Percentage | ||
|---|---|---|---|
| Males | 13 | 52% | |
| Females | 12 | 48% | |
| Right | 18 | 56.25% | |
| Left | 14 | 43.75% | |
| Age | 56.86 ± 5 years | ||
| Duration of Diabetes | 14.93±3.06 years | ||
| Hypertension | Present | 5 | 20% |
| Hypertension | Absent | 20 | 80% |
| FFA | Diffuse DME | 25 | 78.13% |
| FFA | Focal DME | 7 | 21.88% |
| Log MAR BCVA | 0.88±0.12 | ||
| Central Subfield Thickness 1 mm | 408.73±79.4 μm | ||
| Para & Peri-foveal thickness | 402±46.52 μm | ||
| P1 Amplitude in Ring 1 | 33.08±10.95 nv/deg² | ||
| P1 Amplitude in Ring 2 | 18.82±5.01 nv/deg² | ||
| P1 Implicit Time in Ring 1 | 78.65±12.37 ms | ||
| P1 Implicit Time in Ring 2 | 48.81±6.44 ms |
Table 1: Preoperative demographic data and clinical characteristics.
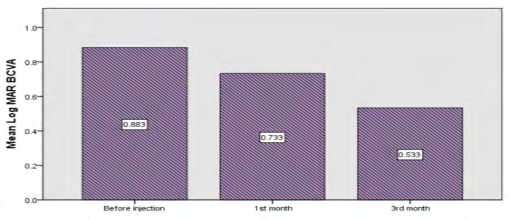
After Injection: Log MAR BCVA improved from (0.88±0.12) preoperatively to (0.53±0.18) at the end of the 3rd month, using Paired T test with P-value <0.001 indicating highly significant statistical difference (Table 2 & Figure 2).
| Mean ± SD | P value | Central Subfield Thickness 1mm | Mean ± SD | P value | |
|---|---|---|---|---|---|
| Before injection | 0.88±0.12 | Before injection | 408.73±79.40μm | ||
| 1st month | 0.73±0.16 | <0.001 | 1st month | 326.53±76.17μm | <0.001 |
| 3rd month | 0.53±0.18 | <0.001 | 3rd month | 224.33±32.49μm | <0.001 |
Table 2: Differences between preoperative and postoperative Log MAR BCVA.
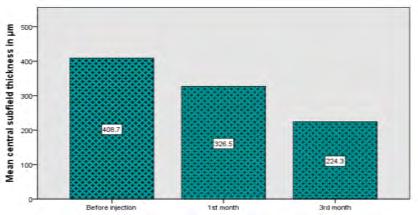
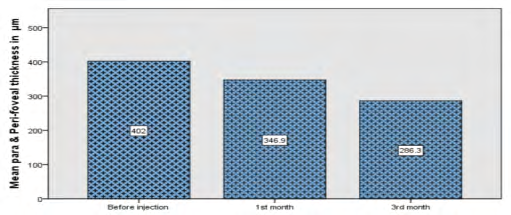
Measurement of macular thickness using OCT showed highly significant statistical difference (P <0.001) using Wilcoxon test. Central subfield thickness 1 mm improved from (408.73±79.40µm) preoperatively to (224.33±32.49µm) at the end of the 3rd month, while para and peri-foveal thickness improved from (402±46.52µm) preoperatively to (286.30±32.67µm) at the end of the 3rd month (Tables 3 & 4, Figures 3 & 4).
| Mean ± SD | P value | Mean ± SD | P value | |
|---|---|---|---|---|
| Before injection | 0.88±0.12 | 408.73±79.40μm | ||
| 1st month | 0.73±0.16 | <0.001 | 326.53±76.17μm | <0.001 |
| 3rd month | 0.53±0.18 | <0.001 | 224.33±32.49μm | <0.001 |
Table 3: Differences between preoperative and postoperative central subfield thickness 1 mm.
| Mean ± SD | P value | |
|---|---|---|
| Before injection | 402±46.52μm | |
| 1st month | 346.93±31.55μm | <0.001 |
| 3rd month | 286.30±32.67μm | <0.001 |
Table 4: Differences between preoperative and postoperative para and peri-foveal thickness.
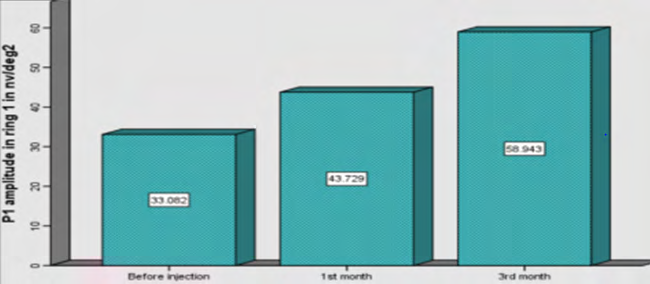
P1 amplitude in ring 1 using MF-ERG improved from (33.08±10.59 nv/deg2) preoperatively to (58.30±32.67 nv/ deg2) at the end of the 3rd month, using paired T test with P-value <0.001 indicating highly significant statistical difference (Table 5 & Figure 5).
| Mean ± SD | P value | |
|---|---|---|
| Before injection | 33.08±10.59nv/deg2 | |
| 1st month | 43.72±8.01nv/deg2 | <0.001 |
| 3rd month | 58.30±32.67nv/deg2 | <0.001 |
Table 6: Differences between preoperative and postoperative P1 amplitude in ring 1.
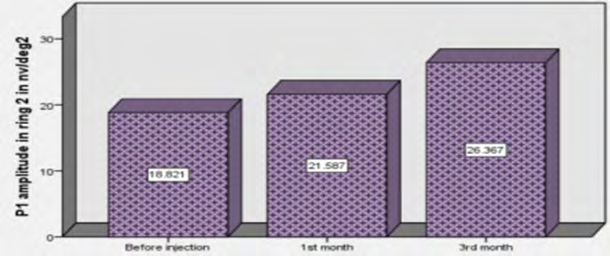
P1 amplitude in ring 2 using MF-ERG improved from (18.82±5.01 nv/deg2) preoperatively to (26.36±3.006 nv/ deg2) at the end of the 3rd month, using paired T test with P-value in the 1st month <0.05 indicating statistically significant difference, while in the 3rd month <0.001 indicating highly significant statistical difference (Table 6 & Figure 6).
| Mean ± SD | P value | |
|---|---|---|
| Before injection | 18.82±5.01nv/deg2 | |
| 1st month | 21.58±4.14nv/deg2 | 0.014 |
| 3rd month | 26.36±3.006nv/deg2 | <0.001 |
Table 5: Differences between preoperative and postoperative P1 amplitude in ring 2.
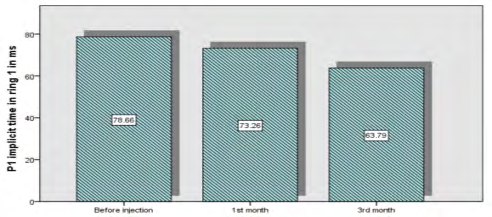
P1 implicit time in ring 1 using MF-ERG improved from (78.65±12.37 ms) preoperatively to (63.78±15.73 ms) at the end of the 3rd month, using paired T test with P-value in the 1st month <0.05 indicating statistically significant difference, while in the 3rd month <0.001 indicating highly significant statistical difference (Table 7 & Figure 7).
| Mean ± SD | P value | |
|---|---|---|
| Before injection | 78.65±12.37 | |
| 1st month | 73.25±14.47 | 0.035 |
| 3rd month | 63.78±15.73 | <0.001 |
Table 7: Differences between preoperative and postoperative P1 implicit time in ring 1.
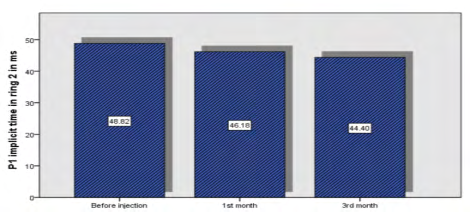
P1 implicit time in ring 2 using MF-ERG improved from (48.81±6.44ms) to (44.39±4.06ms) at the end of the 3rd month, using paired T test with P-value in the 1st and 3rd months <0.05 indicating statistically significant difference (Table 8 & Figure 8).
| Mean ± SD | P value | |
|---|---|---|
| Before injection | 48.81±6.44 | |
| 1st month | 46.18±7.59 | 0.007 |
| 3rd month | 44.39±4.06 | 0.002 |
Table 8: Differences between preoperative and postoperative P1 implicit time in ring 2.
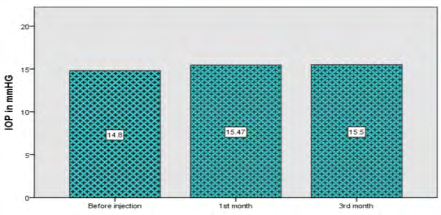
Measuring IOP using Goldman’s applanation tonometer showed that, there is a little rise of IOP at 1st and 3rd months with insignificant difference in P-value > 0.05 (Table 9 & Figure 9).
| Mean ± SD | P value | |
|---|---|---|
| Before injection | 14.8±1.7mmHG | |
| 1stmonth | 15.4±2.01mmHG | 0.113 |
| 3rdmonth | 15.5±1.25mmHG | 0.063 |
Table 9: Differences between preoperative and postoperative IOP.
Complications during follow up of patients especially 1 week after injection were relatively uncommon, including mild subconjunctival haemorrhage in 1 eye (3.3%) and transient increase of IOP in 4 eyes (13.33%).
Discussion
DME is a complicated process associated with many factors; the pathogenesis is thought to be due to altered permeability of the blood–retinal barrier, which results in fluid accumulation at the macula [7]. The previous treatment standard of DME was laser photocoagulation, but there are different degrees of complication, including lack of an obvious increase in visual acuity and intraocular pressure elevation. A quantity of randomized multicenter researches have proven that repeated intravitreal anti-VEGF injections have superior outcomes on patients with DME when compared to laser treatment alone [8].
Compared with laser photocoagulation, anti-VEGF therapy can achieve better corrected visual acuity and less visual field defect; the lower incidence of center involving macular edema and vitreous hemorrhage reported in the anti-VEGF group than laser photocoagulation group [9].
Nguyen QD, et al. [10] proposed that anti-VEGF treatment by Ranibizumab should be the first-line treatment for DME. Nepomuceno A, et al. [11] studied 63 eyes with center involving DME and were randomly assigned to receive 1.5 mg bevacizumab or 0.5 mg ranibizumab at baseline and repeated monthly if the central sub-foveal thickness was greater than 275 µm. They observed a significant improvement in BCVA in both groups at all study visits (P <0.05); significantly greater in the IV Ranibizumab group compared with IV Bevacizumab group at weeks 8 (P = 0.032) and 32 (P = 0.042). A significant reduction in mean central sub-foveal thickness was observed in both groups at all study visits compared with baseline (P< 0.05), with no significant difference in the magnitude of macular thickness reduction between groups. They concluded that IVB and IVR are associated with similar effects in central sub-foveal thickness in patients with DME through I year of follow up. IVR was associated with greater improvement in BCVA at some study visits, and the mean number of injections were higher in IVB group (9.84) than in the IVR group (7.67).
In this study, we observed that intravitreal anti VEGF injection significantly improved BCVA from (0.88±0.12) preoperatively to (0.53±0.18) at the end of the 3rd month, with P-value < 0.001. Also, foveal thickness improved significantly from (408.73±79.40 µm) preoperatively to (224.33±32.49 µm) at the end of the 3rd month, with P-value < 0.001.
Browning DJ, et al. [12] mentioned that although correlation between BCVA and CFT, there was a great change in visual acuity at any given retinal thickness, and OCT measurement solely may not be a nice replacement for visual acuity as a main result in researches on DME. OCT can only record the degree of edema; the duration of edema and the damage to cells cannot be evaluated. In contrast, mf-ERG is a technique that through simultaneous stimulation of different regions of the retina, retinal function can be mapped in the posterior pole. It has been used for recording local electrophysiological responses of different retinal regions [13].
Yamamoto S, et al. [14] showed that mf-ERG readings from the macular area were a good objective indicator of macular function in patients with DME and were strongly correlated with morphologic changes in the macula. Abdollahi A, et al. [15] studied 64 eyes of 32 patients with bilateral symmetric CSME. Macular photocoagulation (MPC) was done in all eyes. After 7 days, 1.25 mg of Bevacizumab was randomly injected in one eye of each patient and the other eye assigned for sham injection. MF-ERG was repeated 8 weeks after injection, and changes in visual acuity and MF-ERG were compared in the two groups. The mean BCVA at baseline was 0.55 in IVB group and 0.51 in the control group. At the 8th week BCVA were 0.41 and 0.53 respectively, also the amplitude and implicit time showed significant improvement in MF-ERG compared with the sham group. They concluded that IVB can augment the effect of macular photocoagulation in DME and can be used as an adjunctive treatment in these cases.
Soriano MT, et al. [16] treated thirty-one eyes of thirty patients with intravitreal injection of 2.5 mg Bevacizumab. MF-ERG testing was performed at baseline and after the initial IVB treatment at 1 month and found that subjects undergoing MF-ERG testing had no statistically significant changes in electrophysiological responses 1 month after IVB and that MF-ERG testing doesn’t demonstrate any short-term cone photoreceptor toxicity after intravitreal bevacizumab.
Enany H, et al. [17] evaluated MF-ERG changes in 60 eyes of 45 patients with CSME after treatment with IVB with or without steroids. The patients were divided into three groups and each group included 20 eyes. The first group was treated with IVB alone, the second group was treated with IVB and triamcinolone injection, and the third group was treated with IVB and dexamethasone injection. The follow up was carried out up to three months. Results showed that the mean foveal thickness was reduced in the three groups. As regard MF-ERG P1 amplitude increased and P1 implicit time was reduced in the three groups and they concluded that DME can be treated with bevacizumab alone, as the use of adjunct steroids has many complications.
Yu-Dong Fu, et al. [18] evaluated MF-ERG changes in 27 eyes of 27 patients with DME after treatment with intravitreal ranibizumab in three consecutive monthly injections and as needed thereafter. The clinical parameters of best-corrected visual acuity (BCVA), central foveal thickness (CFT) and mf- ERG were monitored before and after IVR. The findings at baseline, 1, 3 and 6 months were analyzed. IVR significantly improved visual acuity from the beginning of the treatment (P <0.05). There were significant decreases in the CFT compared with the baseline after IVR (P< 0.05). The mean amplitude of P1 in the central ring at all examinations increased significantly compared with the baseline (P< 0.05). The mean P1 implicit time in the central ring was shortened, but not significantly (P>0.05). There were significant correlations of BCVA with CFT and P1 amplitude in the central retina (P< 0.05). They concluded that, in addition to the improvement in BCVA and the reduction in CFT, IVR improved macular retinal function, as assessed by mf-ERG, in diabetic eyes. The combination of OCT and mf-ERG for macular evaluation may better assess DME.
Baget-Bernaldiz M, et al. [19] evaluated MF-ERG changes at 1-year follow-up in a cohort of diabetic macular edema patients treated with ranibizumab according to Pro re nata protocol. 35 eyes of 35 patients treated with 3 injections of ranibizumab and as needed thereafter, Eyes with cystic and spongiform DME showed better P1 amplitude with respect to the serous type (p < 0.001) at baseline. Similarly, an eye with high IS/OS and ELM preservation rates showed higher initial P1 amplitude compared to the others (p < 0.001). Eyes with moderate DR had better P1 amplitude compared to those with severe and proliferative DR (p = 0.001). At the beginning of the study, those eyes with proliferative and severe DR showed longer implicit times with respect to those with moderate DR (p = 0.04). The P1 amplitude significantly increased in eyes that anatomically restored the IS/OS and the ELM after being treated with RNBZ (both p < 0.001). Similarly, eyes with spongiform DME further improved the P1 amplitude with respect to those with cystic and serous DME (p < 0.001). On the contrary, eyes with hard exudates showed less improvement in their P1 amplitude at the end of the study (p < 0.001). We observed a significant relationship between BCVA and P1 amplitude achieved at the end of the study (p = 0.012). Eyes with severe and proliferative DR significantly shortened implicit time compared to those with moderate DR (p = 0.04).
Our study focused on P1 amplitude and implicit time in ring 1 and 2. Ring 1 (0-2.3°) corresponds roughly to the fovea and ring 2 (2.3-7.4°) to the parafovea and partially to the perifovea. The results have shown that, in addition to improvement in BCVA and reduction in CFT, intravitreal injections of ranibizumab improved macular function. P1 amplitude in ring 1 improved significantly from (33.08±10.59nv/deg2) preoperatively to (58.30±32.67nv/ deg2) at the end of the 3rd month, with P value <0.001. P1 amplitude in ring 2 improved from (18.82±5.01nv/deg2) preoperatively to (26.36±3.006nv/deg2) at the end of the 3rd month, with P-value <0.05. P1 implicit time in ring 1 improved from (78.65±12.37ms) preoperatively to (63.78±15.73ms) at the end of the 3rd month, with P-value in the 1st month <0.05 and <0.001 in the 3rd month. P1 implicit time in ring 2 improved from (48.81±6.44ms) to (44.39±4.06ms) at the end of the 3rd month, with P-value in the 1st and 3rd month <0.05.
Hood DC, et al. [20] reported that P1 was generated by Muller and bipolar cells, so a decrease in P1 amplitude mainly reflects functional damage to the inner retina. This study found that, the amplitude of P1 decreased significantly in patients with DME. Through the observations made during a short period of 3 months after intravitreal anti- VEGF treatment, the amplitude of P1 was most closely related to the BCVA and with the decrease in the CFT. This showed that Intravitreal anti-VEGF injection is not only able to reduce macular edema, but also can aid in the recovery of inner retinal cell function. Significant correlations between BCVA and mfERG amplitude have been reported in previous studies of maculopathies [21].
We also found a significant correlation of BCVA, as a dependent variable, with P1 amplitude in the central ring before injection and after 3 months of treatment. Previous studies reported that implicit times were just increased reasonably or still within normal ranges, in spite of diminished amplitudes and severe visual loss, implying that the decrease in visual acuity is not necessarily related to the change in implicit time. Our results were consistent with this report, and the correlation of P1 implicit times with BCVA was not significant.
Holm K, et al. [22] found that BCVA and CFT were improved after intravitreal antiVEGF treatment, but there was no difference in mf-ERG results when compared with baseline; this may be related to the frequency of intravitreal injection of ranibizumab [23]. Most researchers believe that the injection project of 3 + PRN is the best scheme for intravitreal anti-VEGFs [23].
DME can be divided into three types by results of OCT: diffuse retinal thickening (DRT), cystoid macular edema (CME) and serous retinal detachment (SRD) [24]. After patients with the three different OCT types of DME had received Intravitreal anti-VEGF, differences in macular edema and visual acuity were obvious, and the effect on DRT type was the best [25].
We believe that, although other the studies have used the same treatment process, the mf-ERG results were obviously different, and this may be related to the different proportion of the different OCT types among the patients with DME. Therefore, use of OCT for DME typing before evaluating the mf-ERG findings may give more reliable results.
In summary, Eyes with DME have significantly abnormal mf-ERG responses. Visual acuity was closely correlated with P1 amplitude in the central ring, based on mf-ERG. It is important to improve our understanding of DME in order to produce more elaborate suggestions regarding when to begin therapy and when not. These findings indicate that functional changes in the retina of patients with diabetes mellitus assessed by mf-ERG can complement OCT findings. Long-term researches and bigger sample sizes are required for more substantial documentation.
Conclusion
Intravitreal injection of Anti-VEGFs especially Ranibizumab resulted in improvement of macular function in study patients with diabetic macular edema. Postoperative improvement in visual acuity was accompanied by decreased retinal thickness measured by OCT and improvement of P1 amplitude in the central ring measured by MF-ERG.
References
-
Klein R, Knudtson MD, Lee KE, Gangnon R, Klein KEB (2008) The Wisconsin Epidemiologic Study of Diabetic Retinopathy: XXII the twenty-five-year progression of retinopathy in persons with type 1 diabetes. Ophthalmology 115(11): 1859-1868.
-
(1985) Early Treatment Diabetic Retinopathy Study report number 1: Photocoagulation for diabetic macular edema. Early Treatment Diabetic Retinopathy Study research group. Arch Ophthalmol 103(12): 1796-1806.
-
Ferrara N (2004) Vascular endothelial growth factor: basic science and clinical progress. Endocr Rev 25(4): 581-611.
-
Soheilian M, Ramezani A, Obudi A, Bijanzadeh B, Salehipour M, et al. (2009) Randomized trial of intravitreal bevacizumab alone or combined with triamcinolone versus macular photocoagulation in diabetic macular edema. Ophthalmology 116(6): 1142- 1150.
-
Nguyen QD, Tatlipinar S, Shah SM, Haller AJ, Quinlan E, et al. (2006) Vascular endothelial growth factor is a critical stimulus for diabetic macular edema. Am J Ophthalmol 142(6): 961-969.
-
Bachmann A, Leitgeb R, Lasser T (2006) Heterodyne Fourier domain optical coherence tomography for full range probing with high axial resolution. Opt Express 14(4): 1487-1496.
-
Hood DC, Bach M, Brigell M, Keating D, Kondo M, et al. (2012) ISCEV Standards, ISCEV standard for clinical multifocal electroretinography (Mf-ERG) (2011 Edition). Doc Ophthalmol 124(1): 1-13.
-
Mitchell P, Bandello F, Schmidt Erfurth U, Lang EG, Massin P, et al. (2011) Ranibizumab monotherapy or combined with laser versus laser monotherapy for diabetic macular edema. Ophthalmology 118(4): 615-625.
-
Sivaprasad S, Prevost AT, Vasconcelos JC, Riddell A, Murphy C, et al. (2017) CLARITY Study Group Clinical efficacy of intravitreal aflibercept versus panretinal photocoagulation for best corrected visual acuity in patients with proliferative diabetic retinopathy at 52 weeks (CLARITY): a multicentre, single-blinded, randomised, controlled, phase 2b, non-inferiority trial. Lancet 389(10085): 2193-2203.
-
Nguyen QD, Brown DM, Marcus DM, Rubio GR, Ehrlich SJ, et al. (2012) Ride Research Group Ranibizumab for diabetic macular edema: results from 2 phase III randomized trials: RISE and RIDE. Ophthalmology 119(4): 789-801.
-
Nepomuceno A, Takaki E, Almeida F, Peroni R, Cardillo AJ, et al. (2013) A Prospective randomized trial of intravitreal bevacizumab versus ranibizumab for the management of diabetic macular edema. Am J Ophthal 156(3): 502-510.
-
Browning DJ, Glassman AR, Aiello LP, Beck WR, Brown M, et al. (2007) Relationship between optical coherence tomography-measured central retinal thickness and visual acuity in diabetic macular edema. Ophthalmology 114(3): 525-536.
-
Sutter EE, Tran D (1992) The field topography of ERG components in man--I. The photopic luminance response. Vis Res 32(3): 433-446.
-
Yamamoto S, Yamamoto T, Hayashi M, Takeuchi S (2001) Morphological and functional analyses of diabetic macular edema by optical coherence tomography and multifocal electroretinograms. Graefes Arch Clin Exp Ophthalmol 239(2): 96-101.
-
Abdollahi A, Movassat M, Nili Ahmadabadi M, Abdollahi M, Bashiri A (2010) Multifocal electroretinography assisted comparison of macular photocoagulation versus macular photocoagulation and intravitreal bevacizumab injection in diabetic macular edema. Iranian Journal of Ophthalmology 22(3): 23-28.
-
Torres Soriano M, Lorenzo V, Aguirre G, Hernandez Rojas M, Kon Jara V, et al. (2012) Multifocal electrophysiologic findings after intravitreal bevacizumab (Avastin) treatment. The Journal of Retinal and Vitreous Diseases 32(5): 972-976.
-
Enany H (2015) Evaluation of intravitreal corticosteroids as an adjuvant to bevacizumab for diabetic macular edema using electroretinogram. Delta Journal of Ophthalmology 16(1): 27-31.
-
YuDong F, Ping Wang, XuXia Meng, Du Z, Wang D (2017) Structural and functional assessment after intravitreal injection of ranibizumab in diabetic macular edema. Doc Ophthalmol 135(3): 165-173.
-
Baget Bernaldiz M, Romero Aroca P, Bautista-Perez A, Mercado J (2017) Multifocal electroretinography changes at the 1-year follow-up in a cohort of diabetic macular edema patients treated with ranibizumab. Doc Ophthalmol 135(2): 85-96.
-
Hood DC, Odel JG, Chen CS, Winn JB (2003) The multifocal electroretinogram. J Neuroophthalmol 23(3): 225-235.
-
Hvarfner C, Andreasson S, Larsson J (2006) Multifocal electroretinography and fluorescein angiography in retinal vein occlusion. Retina 26(3): 292-296.
-
Holm K, Schroeder M, Lovestam AM (2015) Peripheral retinal function assessed with 30-Hz flicker seems to improve after treatment with Lucentis in patients with diabetic macular oedema. Doc Ophthalmol 131(1): 43- 51.
-
Campochiaro PA, Brown DM, Awh CC, Lee SY, Gray S, et al. (2011) Sustained benefits from ranibizumab for macular edema following central retinal vein occlusion: twelve- month outcomes of a phase III study. Ophthalmology, 118(10): 2041-2049.
-
Shimura M, Yasuda K, Nakazawa T, Hirano Y, Sakamoto T, et al. (2011) Visual outcome after intravitreal triamcinolone acetonide depends on optical coherence tomographic patterns in patients with diffuse diabetic macular edema. Retina 31(4): 748-754.
-
Seo KH, Yu SY, Kim M, Kwak WH (2016) Visual and morphologic outcomes of intravitreal ranibizumab for diabetic macular edema based on optical coherence tomography patterns. Retina 36(3): 588-595.
- Screening of Hospital Staff During World Glaucoma Week in a Tertiary Eye Care Centre
- Angioid Streaks with Macular Neovascularization: Clinical Insights from Two Cases
- Giant Kissing Naevus: An Oculoplastic Challenge
- Why Freedom of Vision Should Not Cost the Freedom of Feeling - LASIK in the Climate of Change
- Asymmetric Optic Nerve with Small Disc and Large Cup: A Rare and Challenging Case of Unilateral Optic Nerve Hypoplasia
- Large Angle Exotropia in a Child: A Case Report