Prevalence of Increased Screen usage during Nationwide Lockdown for Containing COVID-19 and its Ocular Implications
Purpose: We aim to assess the prevalence of increased screen usage among Indians during lockdown due to COVID-19 pandemic and its associations with self-reported dry eye symptoms. Method: This cross-sectional study was conducted in April 2020 during the total lockdown period for containment of COVID-19 virus. 382 healthy participants facing home confinement due to lockdown were enrolled. Symptoms of dry eye and amount of screen time were assessed by means of an online questionnaire. The questionnaire was freely accessible and participants were recruited by sharing the questionnaire, prepared on Google Docs, on various social networking platforms. The survey was open for responses for 3 weeks. All valid responses were tabulated and analysed using Microsoft Excel spread sheets and licensed SPSS version 26. Result: We found that about 86% of surveyed candidates reported an increase in time spent on smartphones and other video display gadgets during the lockdown. Higher prevalence rates for symptomatic dry eye were observed in individuals who reported increased daily exposure to smartphones during the lockdown as compared to those who did not (23.03% vs 9.61%; OR 2.914, 95% CI: 2.682-2.976; p<0.05). Longer daily smartphone use (>4 hours) was associated with a higher mean number of ocular symptoms (4-6 symptoms in 32.08% vs 26.06%), need of voluntary abstinence from screen (p<0.05) and the need of eye drops to feel better (p<0.05). Internal consistency was moderate (Cronbach's alpha = 0.674), indicating some variability in reporting. Conclusion: COVID-19 containing lockdown has seen society pivot from real world interactions to the online space. Recognising the collateral effects of the lockdown on screen usage and its implications on ocular health is imperative to alert the general public about such hazards.
Introduction
In the beginning of year 2020, the world was exposed to one of the worst pandemics ever. With rapidly escalating COVID-19 cases, the entire human race faced confinement and restrictions on mobility in the form of partial or total lockdowns imposed by government agencies. As case numbers surged in India, in the end of March 2020, the Government of India ordered a nationwide lockdown for 21 days, limiting the movement of the entire 1.3 billion population of India as a preventive measure against the 2020 coronavirus pandemic. A lockdown is basically an emergency protocol that prevents people or information from leaving an area. It means a ban on public transport systems, all non-essential services stand suspended and barring a few people, the entire population is restricted to their homes. As compliance, majority Indian states executed these rules soon thereafter starting from the 25th March 2020. Initial orders of 21 days, were followed by extension orders from 15th April onwards till the 17th of May 2020 pan India.
A major number of tech-professionals were working from homes and those who were not were mostly glued to their smartphones during this time. Studies have claimed an association of dry eye disease with the usage of video display terminal units. With 300 million smartphone users in India, the average age of smartphone use is reported to be 10.3 yrs. Smartphones have enabled various activities like web browsing, online book reading, group chats and other means of social networking. Long hours of smartphones and VDT use (laptops, desktops, tablets, television) however have been associated with a decreased rate of blinking and ocular fatigue, thus leading to dry eye symptoms [1, 2, 3].
Dry eye disease which was once considered a disease in elderly, of late has been a popular in young patients with the most likely attributable cause as the increasing use of video display screens. As Indians entered a phase of one month of confinement, their use of smartphones and other VDTs had increased as a general observation. With not much to do at home, they were resorting to their mobiles majority of the waking hours for communication with their friends and families, reading news and updates on coronavirus or many other recreational activities. The resultant rise in screen time was expected to be associated with dry eye symptoms. At the same time additive environmental influences contributing to dry eye were nullified as the majority of an individual’s time was spent in the comfort of their homes. While the lockdown was paramount in cutting down transmission of Covid-19 virus, it remains largely unknown how it affected the amount of screen time in the daily routines of individuals and its impact on the eyes. It is quite crucial to understand the implications of a total lockdown that the world has not seen before, on ocular health. In the present study, we investigated the effect of nationwide lockdown on the duration of screen use and its ocular consequences in the form of dry eye in healthy Indian subjects.
Methods
Ethics approval for this study was obtained from the Institutional Review Board of the organisation. We adhered to guidelines of the Declaration of Helsinki. The study was based on a 15-point web-based questionnaire derived from an amalgamation of OSDI questionnaire and questions on screen time. Before finalizing the questionnaire, it was administered to 30 people as a pilot and revised in response to their feedback. The questionnaire included multiple choice questions on a likert scale as well as yes-no questions in a forced choice format. The cronbach’s alpha of the questionnaire was 0.674 (0.734 for standardised items) which indicated moderate reliability and internal consistency.
The participants remained completely anonymous as the questionnaire did not require them to identify themselves with names. Information on the participants included only their age, gender, occupation and whether they were working from home or not. Questions from the standard ocular surface disease index questionnaire suggestive of dry eye complaints (burning sensation, foreign body sensation, pain, blurred vision) were incorporated in the questionnaire. The questionnaire in its original form was not used as our surveyed population was not exposed to a major number of activities like night driving and environmental triggers which are part of the full questionnaire. It was hence decided to use only individual symptom questions from the questionnaire. A major proportion of the pilot study participants felt that the above questions did not fall in their symptomatology and hence two additional symptoms (frequent blinking and frequent watering) were incorporated in the questionnaire based on the feedback. Further two indirect questions (need of voluntary abstinence, use of eye drops to feel better) were included.
All symptom questions were asked specifically for the lockdown period. Additionally questions on the candidates screen time during the lockdown were asked. The questionnaire was purposely put in simple language for people from all streams of professions to understand easily. The total number of questions were kept low to achieve form completion and enhance response rate.
The study population consisted of residents of India who were facing strict lockdown policies as implemented by the Government of India and were not leaving their houses for their work. They were required to be free of any pre-existing ocular disease or previous ocular surgeries. A mandatory requirement was to have a valid email Id. All medical/ health care professionals were excluded from the study as firstly essential services were continued during lockdown and secondarily to avoid any bias of under-reporting of symptoms known to medicos. The questionnaire was posted on a website meant for hosting surveys (https://docs.google. com/forms) and the link circulated on social networking websites along with an open invitation to participate in the anonymous survey. The questionnaire was not altered throughout the survey period. After receiving the desired number of responses as per sample size, the survey was closed and the data analyzed.
In calculating the sample size for the survey, we used an online sample size calculator (http://www.raosoft.com/ samplesize.html) [4] and assumed that 40% of candidates would be facing some kind of ocular symptoms in the lockdown. This was based on the prevalence of digital screen associated dry eye [5]. To achieve 95% confidence interval (CI) and 5% acceptable error margin, a minimum of 363 participants were required.
Data analysis was performed with statistical software SPSS 21.0 (SPSS Inc., Chicago, USA). For analysis “symptomatic dry eye” was defined as any of the six symptoms (sensitivity to light, foreign body sensation, painful/ sore eyes, blurred vision, frequent blinking, frequent watering) occurring for “most of the time” or “all of the time”. Categorical variables were presented in number and percentage (%) and continuous variables were presented as mean ± SD and median. Normality of data was tested by Kolmogorov-Smirnov test. If the normality was rejected then a non parametric test was used. Qualitative variables were associated using the Chi- Square test. Univariate and multivariate logistic regression was used to find out factors affecting outcome. A p value of <0.05 was considered statistically significant.
Results
Demographics
A total of 382 people participated in the survey (response rate 100%). All participants were citizens of India and did not have any travel history in the past 1 month or any positive history of COVID-19 related symptoms (dry cough, fever, anosmia etc). From April 12th to May 3rd, during the three weeks of the restrictive measures, 65.7% (251/382) of the participants had left home only for less than ½ an hour, 14.4% (55/382) had left their home for half to an hour per day, and 8.4% (32/382) had left their home for one to two hours. Table 1 presents the descriptive characteristics of the participants.
| Sociodemographic Characteristics | Frequency | Percentage | |||
|---|---|---|---|---|---|
| Age | |||||
| 20-40 yrs | 246 | 64.40% | |||
| >40 yrs | 136 | 35.60% | |||
| Mean ± Stdev | 37.94 ± 14.5 | ||||
| Median(IQR) | 33(25-50.75) | ||||
| Range | 20-70 | ||||
| Gender | |||||
| Male | 248 | 64.92% | |||
| female | 134 | 35.08% | |||
| Working professionals | |||||
| Yes | 286 | 74.90% | |||
| No | 96 | 25.10% | |||
| Profession | |||||
| IT Prof | 172 | 45.03% | |||
| Banking and allied | 14 | 3.66% | |||
| Govt service | 31 | 8.12% | |||
| Others | 165 | 43.19% | |||
| Work from home | |||||
| Yes | 215 | 56.30% | |||
| No | 167 | 43.70% | |||
| Left home during lockdown | |||||
| ½ hr or less | 251 | 65.70% | |||
| ½ to 1 hour | 55 | 14.40% | |||
| 1-2 hours | 32 | 8.40% | |||
| 2-4 hours | 22 | 5.70% | |||
| > 4 hours | 22 | 5.70% | |||
| Total hours of smart phone use | |||||
| Less than 4 hours | 142 | 37.20% | |||
| < 2 hrs | 44 | ||||
| 2-4 hrs | 98 | ||||
| More than or equal to 4 hours | 240 | 62.80% | |||
| 4-6 hrs | 104 | ||||
| 6-8 hrs | 74 | ||||
| >8 hrs | 62 | ||||
| Total number of Computers/Laptops use less than 4 hours | 204 | 53.40% | |||
| <2 hrs | 121 | ||||
| 2-4 hrs | 83 | ||||
| More than or equal to 4 hours | 178 | 46.50% | |||
| 4-6 hrs | 60 | ||||
| 6-8hrs | 46 | ||||
| >8hrs | 72 | ||||
| Increase in screen time during lockdown | |||||
| Yes | 330 | 86.40% | |||
| No | 52 | 13.60% | |||
| Hours of increase in screen time during lockdown | |||||
| <2 hrs | 53 | 16% | |||
| ≥ 2 hrs | 277 | 83.90% | |||
| Symptomatic dry eye | |||||
| No | 301 | 78.80% | |||
| Yes | 81 | 21.20% |
Table 1: Distribution of socio-demographic characteristics of study subjects (n=382).
Majority of our surveyed population fell in the age group of 20-40 years (246; 64.4%) and 35.6% were above the age of 40 years (mean = 37.9 years, SD = 14.5). At the time of the survey, 56.3% (215/382) were resorting to working from home and 43.7% (167) were not involved in work from home. In terms of hours of the day spent viewing smartphone screens, 37.2% (142/382) subjects reported using their smartphones for less than four hours per day, whereas 62.8% (240/382) said they were using their smartphones for more than or equal to 4 hours per day during the lockdown. Time spent on other video display units like laptop/computer and TV was reported more than or equal to 4 hours in
46.5% (178/382) participants. On analysing the change in the screen usage pattern of people during lockdown, 86.4% participants confirmed their screen usage (smartphone and other video display units) had increased during the lockdown. Of the people who reported an increased screen usage pattern during lockdown, 83.9% (277/330) said their increase was more than or equal to two hours.
Self Reported Ocular Symptoms
All participants were asked questions on ocular symptoms perceived specifically during the lockdown period. Sensitivity to light was experienced by 55.2% participants; painful or sore eyes were reported by 44.7%; and the least common symptom experienced by participants was foreign body sensation in the eyes by 30.7%. Table 2 describes specific frequencies of each symptom perceived as reported by participants.
| Eyes Sensitive to light | |
|---|---|
| Symptom absent (None of the time) | 171 (44.8%) |
| Symptom present | 211 (55.2%) |
| • Some of the time | 145 (68.7%) |
| • Half of the time | 24 (11.4%) |
| • Most of the time | 33 (15.6%) |
| • All of the time | 9 (4.2%) |
| Foreign Body Sensation in the Eyes | |
| Symptom absent (None of the time) | 266 (69.6%) |
| Symptom present | 116 (30.4%) |
| • Some of the time | 98 (84.5%) |
| • Half of the time | 7 (6.03%) |
| • Most of the time | 9 (7.7%) |
| • All of the time | 2 (1.7%) |
| Painful (or) Sore Eyes | |
| Symptom absent (None of the time) | 211 (55.2%) |
| Symptom present | 171 (44.7%) |
| • Some of the time | 120 (70.2%) |
| • Half of the time | 22 (12.8%) |
| • Most of the time | 26 (15.2%) |
| • All of the time | 3 (1.7%) |
| Blurred Vision | |
| Symptom absent (None of the time) | 251 (65.7%) |
| Symptom present | 131 (34.3%) |
| • Some of the time | 102 (77.8%) |
| • Half of the time | 12 (9.1%) |
| • Most of the time | 14 (10.7%) |
| • All of the time | 3 (2.3%) |
| Decreased Blinking | |
| Symptom absent (None of the time) | |
| Symptom present | 131 (34.3%) |
| • Some of the time | 91 (69.5%) |
| • Half of the time | 22 (16.8%) |
| • Most of the time | 14 (10.7%) |
| • All of the time | 4 (3.05%) |
| Frequent Watering | |
| Symptom absent (None of the time) | 218 (57.1%) |
| Symptom present | |
| • Some of the time | 164 (42.9%) |
| • Half of the time | 136 (82.9%) |
| • Most of the time | 13 (7.9%) |
| • All of the time | 15 (9.1%) |
| 0 (0%) | |
| Need of Voluntary Abstinence to Feel Better | |
| Yes | 188 (49.2%) |
| No | 194 (50.8%) |
| Need of Eye Drops to Feel Better | |
| Yes | 121 (31.7%) |
| No | 261 (68.3%) |
| Eye Specialist Consultation if there was no Lockdown | |
| Yes | 72 (18.8%) |
| No | 310 (81.2%) |
Table 2: Ocular Symptoms perceived by subjects during lockdown.
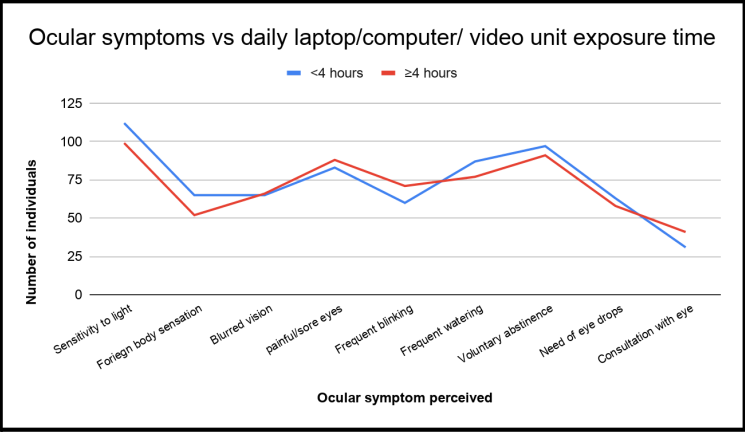
49.2% participants mentioned they needed voluntary abstinence for their eyes to feel better and 31.7% needed use of eye drops. 18.8% participants alleged their eye symptoms were severe enough to consult an eye specialist during the lockdown. On a likert scale, most participants felt their ocular symptoms “some of the time”. A comparison of individual symptom frequency in smartphones (Figure 1) and other video units usage (Figure 2) for less than four hours against more than four hours was done and has been depicted as a line diagram.
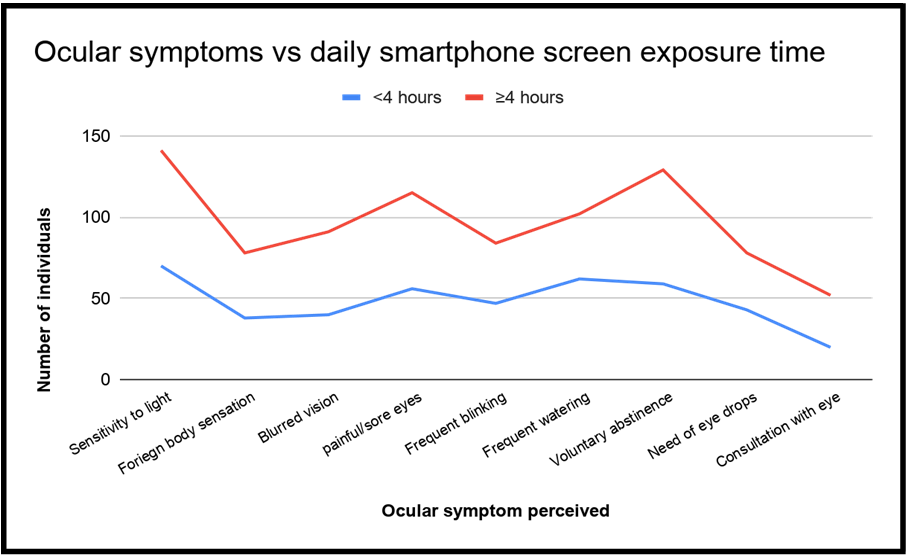
Symptomatic Dry Eye
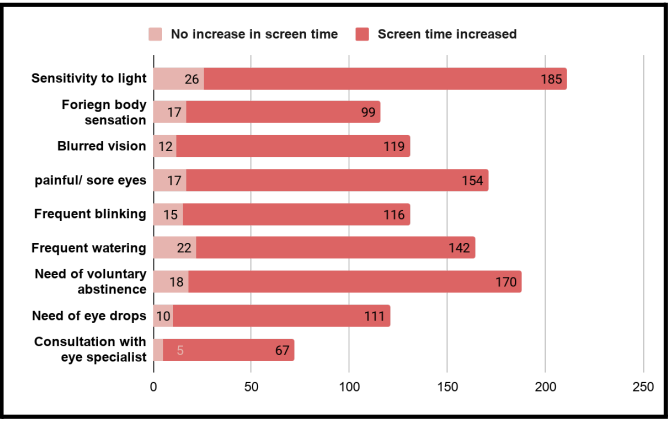
All ocular symptoms were found increasingly common in those who reported an increase in screen time during lockdown (Figure 3). Symptomatic dry eye as defined by the presence of any of the six ocular symptoms for “most of the time” or “all of the time” was found to be associated with more than 4 hours of phone usage.
Prevalence of symptomatic dry eye was more in the
20-40 age group (23.58% vs 16.91%), female gender (23.13% vs 20.16%) and those working from home (23.26 vs 18.56%) however statistical significance was not reached. Table 3 shows logistic regression analysis of the risk factors associated with the development of symptomatic dry eye. Significant odds of having a symptomatic dry eye were associated with more than 4 hours of smartphone usage and increased total screen time in lockdown. Need of voluntary abstinence from the screen to feel better correlated significantly with female gender, smartphone use more than 4 hours and increase in total screen time. Need of eye drops correlated only with increase in total screen time (P < 0.05, OR 2.056; 95% CI 1.002 to 4.22) (Tables 4-6) show multivariate regression analysis of need of voluntary abstinence from screen, the need of eye drops to feel better and need to visit an eye specialist respectively.
| Symptomatic Dry Eye | No (n=301) | Yes (n=81) | P-value | Unadjusted OR (95% CI) | |
|---|---|---|---|---|---|
| Age(years) | |||||
| 20-40 | 188 (76.42%) | 58 (23.58%) | 1 | ||
| >40 | 113 (83.09%) | 23 (16.91%) | 0.137 | 0.667 (0.391 to 1.138) | |
| Gender | |||||
| Female | 103 (76.87%) | 31 (23.13%) | 1 | ||
| Male | 198 (79.84%) | 50 (20.16%) | 0.488 | 0.836 (0.504 to 1.387) | |
| Occupation | |||||
| Banking and allied | 10 (71.43%) | 4 (28.57%) | 1 | ||
| Government service | 26 (83.87%) | 5 (16.13%) | 0.335 | 0.484 (0.111 to 2.118) | |
| IT Professional | 140 (81.40%) | 32 (18.60%) | 0.316 | 0.54 (0.162 to 1.802) | |
| Others | 124 (76.07%) | 39 (23.93%) | 0.623 | 0.74 (0.223 to 2.453) | |
| Retired | 1 (50%) | 1 (50%) | 0.579 | 2.335 (0.116 to | |
| 46.817) | |||||
| Work from home | |||||
| No | 136 (81.44%) | 31 (18.56%) | 1 | ||
| Yes | 165 (76.74%) | 50 (23.26%) | 0.274 | 1.322 (0.801 to 2.182) | |
| Hours of phone use | |||||
| <4 Hours | 121 (85.81%) | 21 (14.89%) | 1 | ||
| >4 hours | 180 (75%) | 60 (25%) | 0.018* | 1.694 (1.357 to 1.924) | |
| Hours of laptop use | |||||
| <4 Hours | 160 (78.43%) | 44 (21.57%) | 1 | ||
| >4 hours | 141 (79.21%) | 37 (20.79%) | 0.857 | 0.956 (0.585 to 1.562) | |
| Increase screen time | |||||
| No | 47 (90.32%) | 5 (9.61%) | 1 | ||
| Yes | 254 (76.96%) | 76 (23.03%) | 0.026* | 2.914 (2.682 to 2.976) | |
| Increase screen time duration | |||||
| <2 Hours | 39 (72.22%) | 15 (27.78%) | 1 | ||
| >2 Hours | 217 (78.62%) | 59 (21.38%) | 0.283 | 0.697 (0.361 to 1.347) | |
| Needed voluntary abstinence from screen use | No (n=194) | Yes (n=188) | P value | Unadjusted OR (95% CI) | Adjusted OR (95% CI) |
| Age(years) | |||||
| 20-40 | 124 | 122 (49.59%) | 1 | ||
| -50.41% | |||||
| >40 | 70 (51.47%) | 66 (48.53%) | 0.843 | 0.959 (0.631 to 1.458) | |
| Gender | |||||
| Female | 56 (41.79%) | 78 (58.21%) | 1 | 1 | |
| Male | 138 (55.65%) | 110 (44.35%) | 0.011* | 0.574 (0.375 to 0.878) | 0.594 (0.387 to 0.914) |
| Occupation | |||||
| Banking and allied | 6 (42.86%) | 8 (57.14%) | 1 | ||
| Government service | 18 (58.06%) | 13 (41.94%) | 0.37 | 0.558 (0.156 to 1.997) | |
| IT Professional | 89 (51.74%) | 83 (48.26%) | 0.547 | 0.713 (0.238 to 2.14) | |
| Others | 81 (49.69%) | 82 (50.31%) | 0.648 | 0.774 (0.257 to 2.327) | |
| Retired | 0 (0%) | 2 (100%) | 0.497 | 3.82 (0.08 to 182.218) | |
| Work from home | |||||
| No | 93 (55.69%) | 74 (44.31%) | 1 | ||
| Yes | 101 (46.98%) | 114 (53.02%) | 0.093 | 1.416 (0.943 to 2.125) | |
| Hours of phone use | |||||
| <4 Hours | 83 (58.45%) | 59 (41.55%) | 1 | 1 | |
| >4 Hours | 111 (46.25%) | 129 (53.75%) | 0.022* | 1.63 (1.072 to 2.479) | 1.521 (0.993 to 2.329) |
| Hours of laptop use | |||||
| <4 Hours | 107 (52.45%) | 97 (47.55%) | 1 | ||
| >4 Hours | 87 (48.88%) | 91 (51.12%) | 0.488 | 1.153 (0.771 to 1.724) | |
| Increase screen time | |||||
| No | 34 (65.38%) | 18 (34.62%) | 1 | 1 | |
| Yes | 160 (48.48%) | 170 (51.52%) | 0.028* | 1.981 (1.077 to 3.645) | 1.837 (0.99 to 3.409) |
| Increase screen time duration | |||||
| <2 Hours | 23 (42.59%) | 31 (57.41%) | 1 | ||
| >2 Hours | 136 (49.28%) | 140 (50.72%) | 0.379 | 0.768 (0.426 to 1.383) | |
| Need of eye drops | No (n=261) | Yes (n=121) | P value | Unadjusted OR(95% CI) | |
| Age(years) | |||||
| 20-40 | 172 (69.92%) | 74 (30.08%) | 1 | ||
| >40 | 89 (65.44%) | 47 (34.56%) | 0.365 | 1.229 (0.787 to 1.919) | |
| Gender | |||||
| Female | 89 (66.42%) | 45 (33.58%) | 1 | ||
| Male | 172 (69.35%) | 76 (30.65%) | 0.55 | 0.872 (0.557 to 1.366) | |
| Occupation | |||||
| Banking and allied | 9 (64.29%) | 5 (35.71%) | 1 | ||
| Government service | 22 (70.97%) | 9 (29.03%) | 0.642 | 0.729 (0.192 to 2.764) | |
| IT Professional | 125 (72.67%) | 47 (27.33%) | 0.464 | 0.654 (0.21 to 2.039) | |
| Others | 105 (64.42%) | 58 (35.58%) | 0.94 | 0.958 (0.308 to 2.975) | |
| Retired | 0 (0%) | 2 (100%) | 0.275 | 8.628 (0.179 to 414.936) | |
| Work from home | |||||
| No | 115 (68.86%) | 52 (31.14%) | 1 | ||
| Yes | 146 (67.91%) | 69 (32.09%) | 0.847 | 1.044 (0.676 to 1.612) | |
| Hours of phone use | |||||
| <4 hours | 99 (69.72%) | 43 (30.28%) | 1 | ||
| >4 hours | 162 (67.50%) | 78 (32.50%) | 0.662 | 1.105 (0.706 to 1.729) | |
| Hours of laptop use | |||||
| <4 hours | 141 (69.12%) | 63 (30.88%) | 1 | ||
| >4 hours | 120 (67.42%) | 58 (32.58%) | 0.721 | 1.082 (0.703 to 1.665) | |
| Increase screen time | |||||
| No | 42 (80.77%) | 10 (19.23%) | 1 | ||
| Yes | 219 (66.36%) | 111 (33.64%) | 0.049* | 2.056 (1.002 to 4.22) | |
| Increase screen time duration | |||||
| <2 hours | 37 (68.52%) | 17 (31.48%) | 1 | ||
| >2 hours | 182 (65.94%) | 94 (34.06%) | 0.744 | 1.11 (0.594 to 2.072) |
Table 3: Regression analysis of factors affecting symptomatic dry eye.
| Need to consult an eye specialist | No (n=310) | Yes (n=72) | P value | Unadjusted OR(95% CI) |
|---|---|---|---|---|
| Age(years) | ||||
| 20-40 | 203 (82.52%) | 43 (17.48%) | 1 | |
| >40 | 107 (78.68%) | 29 (21.32%) | 0.35 | 1.284 (0.76 to 2.168) |
| Gender | ||||
| Female | 103 (76.87%) | 31 (23.13%) | 1 | |
| Male | 207 (83.47%) | 41 (16.53%) | 0.114 | 0.657 (0.39 to 1.107) |
| Occupation | ||||
| Banking and allied | 11 (78.57%) | 3 (21.43%) | 1 | |
| Government service | 27 (87.10%) | 4 (12.90%) | 0.447 | 0.538 (0.109 to 2.662) |
| IT Professional | 140 (81.40%) | 32 (18.60%) | 0.678 | 0.76 (0.208 to 2.778) |
| Others | 131 (80.37%) | 32 (19.63%) | 0.753 | 0.812 (0.222 to 2.971) |
| Retired | 1 (50%) | 1 (50%) | 0.443 | 3.283 (0.158 to 68.36) |
| Work from home | ||||
| No | 145 (86.83%) | 22 (13.17%) | 1 | |
| Yes | 165 (76.74%) | 50 (23.26%) | 0.015* | 1.973 (1.143 to 3.406) |
| Hours of phone use | ||||
| <4 Hours | 122 (85.92%) | 20 (14.08%) | 1 | |
| >4 Hours | 188 (78.33%) | 52 (21.67%) | 0.075 | 1.664 (0.95 to |
| 2.915) | ||||
| Hours of laptop use | ||||
| <4 Hours | 173 (84.80%) | 31 (15.20%) | 1 | |
| >4 Hours | 137 (76.97%) | 41 (23.03%) | 0.053 | 1.662 (0.993 to 2.784) |
| Increase screen time | ||||
| No | 47 (90.38%) | 5 (9.62%) | 1 | |
| Yes | 263 (79.70%) | 67 (20.30%) | 0.094 | 2.212 (0.872 to 5.611) |
| Increase screen time duration | ||||
| <2 Hours | 41 (75.93%) | 13 (24.07%) | 1 | |
| >2 Hours | 222 (80.43%) | 54 (19.57%) | 0.418 | 0.753 (0.379 to 1.497) |
Table 4: Univariate analysis of factors affecting need to consult an eye specialist.
Discussion
Although strict restrictive measures in India showed success in containing the surge of COVID-19 after a month, there has been little research on how it affected the daily lives of people in the community. The central objective of lockdown i.e. social movement under government direction is to forbid two people from different families or nearby inhabitants to come in close contact with each other [6]. The spike in smartphone use appears to stem from social distancing measures put in place by countries around the world aiming to contain the outbreak. Unable to leave their homes to socialise with friends and family, physical social distancing seems to have led to a phenomenal growth in virtual social togetherness.
A global media report showed a spike in the weekly phone usage hours of Indians by the end of March 2020 as compared to January 20 [7]. The prevalence of dry eye disease is multifactorial, being contributed by geographic location, climate, and lifestyle of the people and ranges from 5% to 35% [8]. There are several plausible pathways linking long duration of screen time to ocular surface symptoms. Asthenopia and ocular surface dryness symptoms have been defined more commonly in context of computer vision syndrome [9, 10, 11, 12]. Recently as the use of smartphones has highly replaced ones need of laptops/computers, there is a surge in literature quoting increased ocular surface disease symptoms with long hours of smartphone usage [13]. In a routine scenario about 50% or more of ophthalmic opd would comprise of dry eye patients, but due to the lockdown measures and the fear of contracting disease a lot of people would rather neglect their dry eye symptoms. Thus there’s a growing need of self reporting symptom surveys like these.
Consenting with the global trends our study also documented an increase in total time spent using screens (smartphone or other video display units) in Indian population under lockdown. The overall prevalence of symptomatic dry eye in our study was 21.2% with a skew towards females (23.13% vs 20.16%). An update from international DEWS stated that the global prevalence of dry eye is about 17% while several other studies show a higher prevalence of approximately 30% in people of Asian descent [14]. We found an increased prevalence in the 20-40 year age group viz a viz more than 40 years. Numerous dry eye studies have assessed age groups more than 40 years only owing to ageing being an independent risk factor for dry eye symptoms. Hence an underestimation of symptomatology in younger ages cannot be ruled out. Moreover, particularly in context of screen display associated dry eyes, younger population will stand a greater risk.
Our surveyed population consisted of 45.03% IT professionals who are mostly spending a major proportion of their time on visual display units. Although all jobs saw a break in their work patterns during the lockdown, IT sector workers were still involved in working from home. We found the prevalence of symptomatic dry eye to be 18.60% in this population. Other Indian studies on dry eyes in IT professionals have also reported a similar prevalence [15]. This emphasizes a need for creating awareness amongst them to take proper preventive measures during work.
We found that all symptoms were reported in the frequency of “some of the time” by about 30-55% participants exposed to long screen hours. Portello JK, et al. [16] also documented that each symptom had been experienced by over 50% of respondents at least ‘some of the time’ during computer use in their study.
We observed a strong association between smartphone usage for more than 4 hours and symptomatic dry eye. Longer phone usage has been linked to decreased blinking frequencies much more than in other video display units, thereby leading to surface dryness symptoms [13]. Similar to our study, Titiyal JS, et al. [17] found a large portion of those using video display terminals (including television, smartphones, tablets, laptops etc.) for more than 4 hours had severe dry eye as per OSDI scores [17]. Our study however did not find any significant difference between symptomatic dry eye in laptop/computer or other video display unit usage more than four hours. Our results were consistent with. who did not find any association between duration of computer use and ocular symptoms [5]. This could be attributed to variability in the type of work and duration of continuous usage which was not analysed in our study. The possibility of taking breaks from laptop/computer screen use increases when at home which could have been a contributing factor to the non-association so found. Also the viewing distance and viewing angle were not taken into account.
We saw a strong correlation between self-reported increased total daily screen duration and symptomatic dry eye (23.03% vs 9.06%). The COVID containment lockdown was an unprecedented event and no prior studies on dry eye have been undertaken in this period. In our view home confinement probably obviated the external environmental triggers which confounded and added to the prevalence of dry eye. Thus an unbiased analysis only of effect of screen could be seen in our study. We tried to assess if a particular number of hours of increased screen usage places an individual at a greater risk, but we failed to find significant results.
Additionally our study also found a positive association between increased total screen time and smartphone usage more than four hours with the need of voluntary abstinence from screen to feel better. Screen abstinence has been spoken about in context of smartphone addiction [18]. Voluntary abstinence necessarily reflects a self-behavioural modification to reduce the side effects of a particular entity. So far no studies have explored the prevalence of a voluntary abstaining behavior among screen users. We believe that the intensity grade of a symptom reduces with voluntary abstinence. Hence its association with increasing hours of screen usage could act as a protective factor against severe dry eye.
A limitation of this study was the absence of being able to objectively test the participants for dry eye due to the lockdown. A dry eye study may be deemed incomplete without objective testing. While there are numerous disease definitions described in various studies, which confound comparisons, prevalence based on symptom reporting have been found to be more consistent than those including signs. Also we did not assess the impact of symptomatic dry eye in our patients on activities of daily living as standard daily routine was not being practiced by most. Further few studies have linked emotional stressors to dry eye [19]. COVID pandemic and the associated lockdown was a stressful period for many individuals and thus the confounding factor cannot be rejected.
To the best of our knowledge this is the first study describing symptomatic dry eye in population under lockdown with an increased total screen viewing time.
References
-
Moon JH, Kim KW, Moon NJ (2016) Smartphone use is a risk factor for pediatric dry eye disease according to region and age: a case control study. BMC Ophthalmol 16(1): 188.
-
Moon JH, Lee MY, Moon NJ (2014) Association between video display terminal use and dry eye disease in school children. J Pediatr Ophthalmol Strabismus 51: 87-92.
-
Bergqvist UO, Knave BG (1994) Eye discomfort and work with visual display terminals. Scand J Work Environ Health 20(1): 27-33.
-
(2017) Sample Size Calculator.
-
Bhanderi DJ, Choudhary S, Doshi VG (2008) A community- based study of asthenopia in computer operators. Indian J Ophthalmol 56(1): 51‐55.
-
Paital B, Das K, Parida SK (2020) Inter nation social lockdown versus medical care against COVID-19, a mild environmental insight with special reference to India. Sci Total Environ 728: 138914.
-
https://economictimes.indiatimes.com/industry/ media/entertainment/media/covid-19-impact- tv-mobile-consumption-witness-major-spike/ articleshow/74848508.cms
-
(2007) The epidemiology of dry eye disease: Report of the Epidemiology Subcommittee of the International Dry Eye Workshop. Ocul Surf 5(2): 93-107.
-
Maducdoc MM, Haider A, Nalbandian A, Julie HY, Payam VM et al. (2017) Visual consequences of electronic reader use: a pilot study. Int Ophthalmol 37: 433-439.
-
Long J, Cheung R, Duong S, Rosemary P, Lisa A, et al. (2017) Viewing distance and eyestrain symptoms with prolonged viewing of smart- phones. Clin Exp Optom 100(2): 133-137.
-
Kim J, Hwang Y, Kang S, Minhye K, Tae SK, et al. (2016) Association between exposure to smartphones and ocular health in adoles- cents. Ophthalmic Epidemiol 23(4): 269-276.
-
Park JS, Choi MJ, Ma JE, Moon JH, Moon HJ (2014) Influence of cellular phone videos and games on dry eye syndrome in university students. J Korean Acad Nurs 25(1): 12-23.
-
Choi JH, Li Y, Kim SH, Jin R, Kim YH, et al. (2018) The influences of smartphone use on the status of the tear film and ocular surface. PLoS ONE 13(10): e0206541.
-
Dieckow J (2011) 6th International Conference on the Tear Film & Ocular Surface: Basic science and clinical relevance (Florence, Italy, September 2010). Ocul Surf 9(1): 3-12.
-
Brindha AK, Murthy S, Trout K, Singh AK, Surapaneni KM, et al. (2015) Dry eyes among information technology professionals in India. Int Eye Sci 15(8): 1303-1308.
-
Portello JK, Rosenfield M, Bababekova Y, Estrada JM, Leaon A (2012) Computer-related visual symptoms in office workers. Ophthalmic and Physiological Optics 32(5): 375-382.
-
Titiyal JS, Falera RC, Kaur M, Sharma V, Sharma N (2018) Prevalence and risk factors of dry eye disease in North India: Ocular surface disease index-based cross-sectional hospital study. Indian J Ophthalmol 66(2): 207-211.
-
Wilcockson TDW, Osborne AM, Ellis DA (2020) Digital detox: The effect of smartphone abstinence on mood, anxiety, and craving, Addict Behav 99: 106013.
-
Yilmaz U, Gokler ME, Unsal A (2015) Dry eye disease and depression-anxiety-stress: A hospital-based case control study in Turkey. Pak J Med Sci 31(3): 626‐631.
- Screening of Hospital Staff During World Glaucoma Week in a Tertiary Eye Care Centre
- Angioid Streaks with Macular Neovascularization: Clinical Insights from Two Cases
- Giant Kissing Naevus: An Oculoplastic Challenge
- Why Freedom of Vision Should Not Cost the Freedom of Feeling - LASIK in the Climate of Change
- Asymmetric Optic Nerve with Small Disc and Large Cup: A Rare and Challenging Case of Unilateral Optic Nerve Hypoplasia
- Large Angle Exotropia in a Child: A Case Report