Low Dose of Sevelamer is Enough to Prevent Coronary Artery Calcification Progression in Prevalent Hemodialysis Patients
Objective: Our objective is to study the possible role of low dose sevelamer hydrochloride on the rate of progression of coronary artery calcification among prevalent hemodialysis (HD) patients. Methods: Eighty HD patients were selected to this study. These patients were receiving oral calcium carbonate (CaCO3) as 200mg of elemental calcium with each meal (total of 1500 mg/day). They were randomized into two equal groups. The first group was administered sevelamer hydrochloride as 800 mg with each meal (2400 mg/day) instead of CaCO3 [Group I], while the oral CaCO3 was maintained as 200mg of elemental calcium with each meal in the 2nd group [Group II]. Coronary artery calcification score (CCs) was assessed before stating and at the end of the trial. In addition, serum fibroblast growth factor 23 (FGF23), calcium, phosphorus, lipids and intact parathyroid hormone (PTH) were estimated in these two events. Results: The baseline CCs and serum FGF23 were comparable in the 2 groups (200 ± 98.45 vs. 198 ± 69.68 A and 4669.5 ± 3540.9 vs. 4737 ± 2578.2 pg/ml, P=0.75 and 0.34 for CCs and serum FGF23 in group I vs. group II respectively). On the other hand, CCs and serum FGF23 were significantly lower in group I compared to group II by the end of the trial (203 ± 97.95 vs. 292 ± 100.16 A and 3011.8 ± 1853.7 vs. 7071.5 ± 2650.4 pg/ml, p= 0.012 and
Introduction
HD patients are at increased risk of all-cause and cardiovascular mortality. Arterial calcification affects almost all HD patients and shows steady progression. This calcification contributes significantly to the increased cardiovascular morbidity and mortality among HD patients [1, 2]. FGF23 is one hundred to one thousand times higher among prevalent HD patients compared to normal personnel [3]. FGF23 is significantly and positively correlating with vascular calcifications (VC) in prevalent HD patients [4, 5]. The high level of FGF 23 in these patients is multifactorial. Deficiency of Klotho, the co- receptor of FGF 23 is an important cause of high FGF23 levels [6]. Sevelamer compounds are resin-based binders that can prevent or muffle VC. However, it failed to improve mortality rate among prevalent HD patients when compared to calcium-based binders [7]. Sevelamer is more expensive compared to calcium-based phosphate binders [8]. The number of tablets is another obstacle for patient adherence [9]. In this trial, we assessed the effect of low dose of sevelamer hydrochloride in comparison to the already prescribed low dose of CaCO3in our unit on the rate of progression of CCs and serum FGF23 level among prevalent HD patients. We also looked for correlations between CCs on one hand and any of the other studied parameters on the other.
Patients and Methods
All patients were on regular thrice weekly HD using low flux biocompatible dialyzers and bicarbonate dialysate containing 3.5m.Eq/L calcium. For this reason, all patients were using CaCO3 500mg thrice daily (200mg of elemental calcium in each dose). Before being recruited to this study. HD patients of either sex maintained on this treatment for one year or more were included. Diabetic patients, patient with history of coronary heart disease, with active liver disease or patients treated with statins, oral anticoagulants cinacalcet, or hemodiafiltration were excluded. Patients who underwent parathyroidectomy or parathyroid ablation, those with sensitivity to either of the two phosphate binders used in this trial and those maintained on higher dose of CaCO3 were also excluded.
After randomization, the patients of group I was administered 800mg of sevelamer HCl with each of the three daily meals while group II patients were maintained on the same dose of CaCO3 that was prescribed before recruitment in the present study (500 mg with each meal). This treatment regimen was kept all through the trial period. Baseline laboratory study was done before randomization. Levels of serum FGF23, creatinine, blood urea, serum Calcium, Phosphorus, iPTH, cholesterol, LDL, HDL, and albumin, were measured. CCS was measured using multislice computer tomography [10]. By the time of the trial conclusion, all the performed tests done initially were repeated. The data were statistically analyzed using the Microsoft statistics program. Data were summarized as median. We used the t-test for analyzing two quantitative parameters. Pearson’s correlation was considered weak for r < 0.25, mild for 0.5 > r ≥ 0.25, moderate for 0.75 > r ≥ 0.5, and strong for r ≥ 0.75. P-values < 0.05 were considered significant.
Results
Results are summarized in Figures 1-5. FGF23 significantly decreased in group I (4669.5 ± 3540.9 vs. 3011.8 ± 1853.7 pg/ml at onset vsat the final assessment in group I, p=0.013) while it showed significant increase in group II (4737 ± 2578.2 vs. 7071.5 ± 2650.4 pg/ml at onset vsat the final assessment in group II, p=0.009).
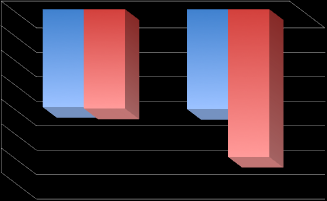
98.45 vs. 203 ± 97.5 and 198 ± 69.68 vs. 292 ± 100.16 at the onset vs. at the final assessment in the 2 groups, p=0.86 and 0.001 respectively). CaxP product significantly decreased in group I and did not show an appreciable change in group II (66.03 ± 7.93 vs. 53.7 ± 6.5 and 63.74 ± 7.84 vs. 65.3 ± 5.55 at the onset vs. by the end of the study in the 2 groups, p<0.001 and =0.86 respectively). CCS had significant positive correlation with FGF 23, but we failed to find similar significant correlation with all other studied parameters in either of the two groups.
7000 P=0.07 P=0.013
Figure2: Serum FGF23 level in the 2 groups at onset & end of study
500
| r= | 07 | 67, | P<0 | .00 | 1 | |||||||||||||||||||||||||||||
450 $$ \mathrm {E} = \mathrm {E} _ {1} + \mathrm {E} _ {2} + \dots + \mathrm {E} _ {n} $$ $$ + $$
400 $$ \mathrm {E} = \frac {1}{2} \mathrm {A} ^ {2} + \mathrm {B} ^ {2} $$
$$ + $$
350 $$ \mathrm {E} = \frac {1}{2} \mathrm {A} ^ {2} + \mathrm {B} ^ {2} $$
$$ + $$ $$ \mathrm {E} = \frac {1}{2} \mathrm {A} ^ {2} + \mathrm {B} ^ {2} $$
$$ \mathrm {E} = \frac {1}{2} \mathrm {A} ^ {2} + \mathrm {B} ^ {2} $$
$$ + $$ $$ + $$
$$ \mathrm {E} = \frac {1}{2} \mathrm {A} ^ {2} + \frac {1}{2} \mathrm {B} ^ {2} $$ $$ \mathrm {E} = \frac {1}{2} \mathrm {A} ^ {2} + \mathrm {B} ^ {2} $$ $$ + $$ $$ \mathrm {E} = \frac {1}{2} \mathrm {A} ^ {2} + \mathrm {B} ^ {2} $$ $$ + $$
300 $$ + $$ CCS
$$ \mathrm {E} = \mathrm {E} _ {1} + \mathrm {E} _ {2} + \dots + \mathrm {E} _ {n} $$ $$ + $$
250 $$ \mathrm {E} = \mathrm {E} _ {1} + \mathrm {E} _ {2} + \dots + \mathrm {E} _ {n} $$ $$ + $$ $$ \mathrm {E} = \frac {1}{2} \mathrm {A} ^ {2} + \mathrm {B} ^ {2} $$ $$ + $$ $$ \mathrm {E} = \frac {1}{2} \mathrm {A} ^ {2} + \mathrm {B} ^ {2} $$ $$ \mathrm {E} = \frac {1}{2} \mathrm {A} ^ {2} + \mathrm {B} ^ {2} $$ $$ + $$ $$ + $$ $$ \mathrm {E} = \frac {1}{2} \mathrm {A} ^ {2} + \mathrm {B} ^ {2} $$ $$ \mathrm {E} = \mathrm {E} _ {1} + \mathrm {E} _ {2} + \dots + \mathrm {E} _ {n} $$ $$ \mathrm {E} = \mathrm {E} _ {1} + \mathrm {E} _ {2} + \dots + \mathrm {E} _ {n} $$
200 $$ + $$ $$ + $$
$$ + $$ $$ \mathrm {E} = \mathrm {E} _ {1} + \mathrm {E} _ {2} + \dots + \mathrm {E} _ {n} $$ $$ + $$ $$ \mathrm {E} = \frac {1}{2} \mathrm {A} ^ {2} + \mathrm {B} ^ {2} $$ $$ + $$ $$ \mathrm {E} = \frac {1}{2} \mathrm {A} ^ {2} + \mathrm {B} ^ {2} $$ $$ \mathrm {E} = \frac {1}{2} \mathrm {A} ^ {2} + \mathrm {B} ^ {2} $$ $$ + $$ $$ + $$ $$ \mathrm {E} = \mathrm {E} _ {1} + \mathrm {E} _ {2} + \dots + \mathrm {E} _ {n} $$ $$ \mathrm {E} = \mathrm {E} _ {1} + \mathrm {E} _ {2} + \dots + \mathrm {E} _ {n} $$ $$ + $$ $$ + $$
150 $$ \mathrm {E} = \mathrm {E} _ {1} + \mathrm {E} _ {2} + \dots + \mathrm {E} _ {n} $$ $$ + $$ $$ \mathrm {E} = \frac {1}{2} \mathrm {A} ^ {2} + \mathrm {B} ^ {2} $$ $$ + $$ $$ \mathrm {E} = \frac {1}{2} \mathrm {A} ^ {2} + \mathrm {B} ^ {2} $$ $$ + $$ $$ \mathrm {E} = \mathrm {E} _ {1} + \mathrm {E} _ {2} + \dots + \mathrm {E} _ {n} $$ $$ \mathrm {E} = \frac {1}{2} \mathrm {A} ^ {2} + \mathrm {B} ^ {2} $$ $$ \mathrm {E} = \frac {1}{2} \mathrm {A} ^ {2} + \mathrm {B} ^ {2} $$ $$ \mathrm {E} = \frac {1}{2} \mathrm {A} ^ {2} + \mathrm {B} ^ {2} $$ $$ \mathrm {E} = \mathrm {E} _ {1} + \mathrm {E} _ {2} + \dots + \mathrm {E} _ {n} $$ $$ + $$ $$ + $$ $$ + $$ $$ + $$ $$ + $$
Figure3: Correlation between FGF23 & CCS at study onset in both groups.
600
| r= | 0.66 | , P< | 0.0 | 01 | |||||||||||||||||||||||||
500 $$ \mathrm {E} = \frac {1}{2} \mathrm {A} ^ {2} + \mathrm {B} ^ {2} $$
$$ + $$ $$ \mathrm {E} = \mathrm {E} _ {1} + \mathrm {E} _ {2} + \dots + \mathrm {E} _ {n} $$ $$ \mathrm {E} = \mathrm {E} _ {1} + \mathrm {E} _ {2} + \dots + \mathrm {E} _ {n} $$ $$ + $$ $$ + $$
400 $$ \mathrm {E} = \mathrm {E} _ {1} + \mathrm {E} _ {2} + \dots + \mathrm {E} _ {n} $$ $$ + $$ $$ \mathrm {E} = \frac {1}{2} \mathrm {A} ^ {2} + \mathrm {B} ^ {2} $$ $$ + $$ CCS $$ \mathrm {E} = \frac {1}{2} \mathrm {A} ^ {2} + \mathrm {B} ^ {2} $$ $$ + $$ $$ \mathrm {E} = \frac {1}{2} \mathrm {A} ^ {2} + \mathrm {B} ^ {2} $$ $$ \mathrm {E} = \frac {1}{2} \mathrm {A} ^ {2} + \mathrm {B} ^ {2} $$ $$ \mathrm {E} = \mathrm {E} _ {1} + \mathrm {E} _ {2} + \dots + \mathrm {E} _ {n} $$ $$ + $$ $$ + $$ $$ + $$ $$ \mathrm {E} = \frac {1}{2} \mathrm {A} ^ {2} + \mathrm {B} ^ {2} $$ $$ \mathrm {E} = \mathrm {E} _ {1} + \mathrm {E} _ {2} + \dots + \mathrm {E} _ {n} $$ $$ + $$
300 $$ + $$ $$ \mathrm {E} = \mathrm {E} _ {1} + \mathrm {E} _ {2} + \dots + \mathrm {E} _ {n} $$ $$ + $$ $$ \mathrm {E} = \frac {1}{2} \mathrm {A} ^ {2} + \mathrm {B} ^ {2} $$ $$ + $$ $$ \mathrm {E} = \frac {1}{2} \mathrm {A} ^ {2} + \mathrm {B} ^ {2} $$ $$ + $$ $$ \mathrm {E} = \mathrm {E} _ {1} + \mathrm {E} _ {2} + \dots + \mathrm {E} _ {n} $$ $$ \mathrm {E} = \frac {1}{2} \mathrm {A} ^ {2} + \mathrm {B} ^ {2} $$ $$ \mathrm {E} = \frac {1}{2} \mathrm {A} ^ {2} + \mathrm {B} ^ {2} $$ $$ + $$ $$ \mathrm {E} = \frac {1}{2} \mathrm {A} ^ {2} + \mathrm {B} ^ {2} $$ $$ + $$ $$ + $$ $$ \mathrm {E} = \frac {1}{2} \mathrm {A} ^ {2} + \mathrm {B} ^ {2} $$ $$ + $$ $$ + $$
200 $$ \mathrm {E} = \frac {1}{2} \mathrm {A} ^ {2} + \mathrm {B} ^ {2} $$
$$ + $$ $$ \mathrm {E} = \frac {1}{2} \mathrm {A} ^ {2} + \mathrm {B} ^ {2} $$
$$ \mathrm {E} = \frac {1}{2} \mathrm {A} ^ {2} + \mathrm {B} ^ {2} $$
$$ + $$ $$ + $$
$$ \mathrm {E} = \frac {1}{2} \mathrm {A} ^ {2} + \mathrm {B} ^ {2} $$
$$ + $$ $$ \mathrm {E} = \frac {1}{2} \mathrm {A} ^ {2} + \mathrm {B} ^ {2} $$
$$ \mathrm {E} = \frac {1}{2} \mathrm {A} ^ {2} + \mathrm {B} ^ {2} $$
$$ + $$ $$ + $$
$$ \mathrm {E} = \frac {1}{2} \mathrm {A} ^ {2} + \mathrm {B} ^ {2} $$
$$ + $$ $$ \mathrm {E} = \frac {1}{2} \mathrm {A} ^ {2} + \mathrm {B} ^ {2} $$
$$ \mathrm {E} = \frac {1}{2} \mathrm {A} ^ {2} + \mathrm {B} ^ {2} $$
$$ \mathrm {E} = \frac {1}{2} \mathrm {A} ^ {2} + \mathrm {B} ^ {2} $$
$$ + $$ $$ \mathrm {E} = \frac {1}{2} \mathrm {A} ^ {2} + \mathrm {B} ^ {2} $$
$$ + $$ $$ + $$
$$ + $$
Figure4: Correlation between FGF23& CCS at end of study in both groups.
600
| r= | 0.6 | 34, | p<0 | 00 | 1 | |||||||||||||||||||||||||
500 $$ \mathrm {E} = \frac {1}{2} \mathrm {A} ^ {2} + \mathrm {B} ^ {2} $$
$$ \mathrm {E} = \frac {1}{2} \mathrm {A} ^ {2} + \mathrm {B} ^ {2} $$
$$ + $$ $$ + $$
$$ \mathrm {E} = \frac {1}{2} \mathrm {A} ^ {2} + \mathrm {B} ^ {2} $$
$$ \mathrm {E} = \frac {1}{2} \mathrm {A} ^ {2} + \mathrm {B} ^ {2} $$
$$ \mathrm {E} = \frac {1}{2} \mathrm {A} ^ {2} + \mathrm {B} ^ {2} $$
$$ + $$ $$ + $$
$$ + $$ $$ \mathrm {E} = \frac {1}{2} \mathrm {A} ^ {2} + \mathrm {B} ^ {2} $$
$$ + $$
400 $$ \mathrm {E} = \frac {1}{2} \mathrm {A} ^ {2} + \mathrm {B} ^ {2} $$
$$ \mathrm {E} = \mathrm {E} _ {1} + \mathrm {E} _ {2} + \dots + \mathrm {E} _ {n} $$ $$ + $$ $$ + $$ $$ \mathrm {E} = \frac {1}{2} \mathrm {A} ^ {2} + \mathrm {B} ^ {2} $$ $$ \mathrm {E} = \frac {1}{2} \mathrm {A} ^ {2} + \mathrm {B} ^ {2} $$ $$ + $$ $$ + $$ CCS $$ \mathrm {E} = \mathrm {E} _ {1} + \mathrm {E} _ {2} + \dots + \mathrm {E} _ {n} $$ $$ \mathrm {E} = \frac {1}{2} \mathrm {A} ^ {2} + \mathrm {B} ^ {2} $$ $$ + $$ $$ + $$ $$ \mathrm {E} = \mathrm {E} _ {1} + \mathrm {E} _ {2} + \dots + \mathrm {E} _ {n} $$ $$ \mathrm {E} = \frac {1}{2} \mathrm {A} ^ {2} + \mathrm {B} ^ {2} $$ $$ \mathrm {E} = \frac {1}{2} \mathrm {A} ^ {2} + \mathrm {B} ^ {2} $$ $$ \mathrm {E} = \mathrm {E} _ {1} + \mathrm {E} _ {2} + \dots + \mathrm {E} _ {n} $$ $$ \mathrm {E} = \mathrm {E} _ {1} + \mathrm {E} _ {2} + \dots + \mathrm {E} _ {n} $$ $$ \mathrm {E} = \mathrm {E} _ {1} + \mathrm {E} _ {2} + \dots + \mathrm {E} _ {n} $$ $$ + $$ $$ + $$ $$ + $$ $$ \mathrm {E} = \frac {1}{2} \mathrm {A} ^ {2} + \mathrm {B} ^ {2} $$ $$ \mathrm {E} = \frac {1}{2} \mathrm {A} ^ {2} + \mathrm {B} ^ {2} $$ $$ + $$ $$ + $$ $$ + $$ $$ \mathrm {E} = \frac {1}{2} \mathrm {A} ^ {2} + \mathrm {B} ^ {2} $$ $$ \mathrm {E} = \frac {1}{2} \mathrm {A} ^ {2} + \mathrm {B} ^ {2} $$ $$ \mathrm {E} = \mathrm {E} _ {1} + \mathrm {E} _ {2} + \dots + \mathrm {E} _ {n} $$ $$ + $$ $$ + $$ $$ \mathrm {E} = \frac {1}{2} \mathrm {A} ^ {2} + \mathrm {B} ^ {2} $$ $$ \mathrm {E} = \frac {1}{2} \mathrm {A} ^ {2} + \mathrm {B} ^ {2} $$ $$ \mathrm {E} = \mathrm {E} _ {1} + \mathrm {E} _ {2} + \dots + \mathrm {E} _ {n} $$ $$ + $$ $$ + $$ $$ + $$
300 $$ + $$ $$ + $$
$$ + $$ $$ \mathrm {E} = \frac {1}{2} \mathrm {A} ^ {2} + \mathrm {B} ^ {2} $$
$$ + $$ $$ \mathrm {E} = \mathrm {E} _ {1} + \mathrm {E} _ {2} + \dots + \mathrm {E} _ {n} $$ $$ + $$ $$ \mathrm {E} = \frac {1}{2} \mathrm {A} ^ {2} + \mathrm {B} ^ {2} $$ $$ \mathrm {E} = \frac {1}{2} \mathrm {A} ^ {2} + \mathrm {B} ^ {2} $$ $$ + $$ $$ + $$ $$ \mathrm {E} = \mathrm {E} _ {1} + \mathrm {E} _ {2} + \dots + \mathrm {E} _ {n} $$ $$ \mathrm {E} = \frac {1}{2} \mathrm {A} ^ {2} + \mathrm {B} ^ {2} $$ $$ + $$ $$ + $$ $$ \mathrm {E} = \frac {1}{2} \mathrm {A} ^ {2} + \mathrm {B} ^ {2} $$ $$ \mathrm {E} = \mathrm {E} _ {1} + \mathrm {E} _ {2} + \dots + \mathrm {E} _ {n} $$ $$ + $$ $$ + $$ $$ \mathrm {E} = \frac {1}{2} \mathrm {A} ^ {2} + \mathrm {B} ^ {2} $$ $$ \mathrm {E} = \mathrm {E} _ {1} + \mathrm {E} _ {2} + \dots + \mathrm {E} _ {n} $$ $$ + $$ $$ + $$ $$ \mathrm {E} = \mathrm {E} _ {1} + \mathrm {E} _ {2} + \dots + \mathrm {E} _ {n} $$ $$ \mathrm {E} = \frac {1}{2} \mathrm {A} ^ {2} + \mathrm {B} ^ {2} $$ $$ \mathrm {E} = \mathrm {E} _ {1} + \mathrm {E} _ {2} + \dots + \mathrm {E} _ {n} $$ $$ \mathrm {E} = \frac {1}{2} \mathrm {A} ^ {2} + \mathrm {B} ^ {2} $$ $$ \mathrm {E} = \mathrm {E} _ {1} + \mathrm {E} _ {2} + \dots + \mathrm {E} _ {n} $$ $$ + $$ $$ \mathrm {E} = \frac {1}{2} \mathrm {A} ^ {2} + \mathrm {B} ^ {2} $$ $$ \mathrm {E} = \frac {1}{2} \mathrm {A} ^ {2} + \mathrm {B} ^ {2} $$ $$ \mathrm {E} = \frac {1}{2} \mathrm {A} ^ {2} + \mathrm {B} ^ {2} $$ $$ + $$ $$ + $$ $$ + $$ $$ + $$ $$ \mathrm {E} = \frac {1}{2} \mathrm {A} ^ {2} + \mathrm {B} ^ {2} $$ $$ + $$ $$ + $$ $$ + $$ $$ \mathrm {E} = \frac {1}{2} \mathrm {A} ^ {2} + \mathrm {B} ^ {2} $$ $$ \mathrm {E} = \mathrm {E} _ {1} + \mathrm {E} _ {2} + \dots + \mathrm {E} _ {n} $$ $$ \mathrm {E} = \frac {1}{2} \mathrm {A} ^ {2} + \mathrm {B} ^ {2} $$ $$ + $$
Discussion
Cardiovascular disease is responsible for the increased mortality among HD patients [11]. VCis associated with ischemic heart disease and increased cardiovascular morbidity [12]. V.C. is associated with increased cardiovascular mortality [13]. Although calcium-based phosphate binders are very useful to control hyperphosphatemia, they can lead to positive calcium balance and cardiovascular calcification. On the other hand, sevelamer prevents or muffles VC [14]. These effects were encountered when such agents were used in the recommended doses. In the case of sevelamer, such dose is costly and carries the risk of non-adherence. We
did not encounter in the literature any study that tried low doses of sevelamer. The renal units of Cairo University hospitals were still using high calcium dialysate for non-medical reasons. This situation forced the attending physicians to prescribe a low dose of CaCO3 in almost all HD patients to avoid excess calcium load. We captured this chance to try a low dose of sevelamer in comparison to low CaCO3 dose. For this purpose, we switched 40 of the prevalent HD patients to low dose SevelamerHCl instead of CaCO3 while the other 40 patients continued their pre-study treatment, namely, CaCO3 in low dose. The low dose of sevelamer succeeded to achieve results comparable to the full dose, namely, significant muffling of the progress rate of CCS and a significant decrease of FGF23. The effect of low dose sevelamer on CCS progression in the present study is comparable to the effect of the full dose encountered in “Treat to Goal Study” [15]. The favorable effect of sevelamer on CCS is probably due to its significant effect on FGF23beside the hypophosphatemic effect and the favorable effect on CaxP product [16]. The favorable effect of sevelamer on FGF23 could be due to induction of Klotho gene in patients treated with sevelamer as was recently reported [17]. Based on the above findings, we conclude that administering low dose of sevelamerHCl in prevalent HD patients can lead to sustained reductions in serum CaxP. In addition, it significantly decreased serum FGF23 level and muffled the progression of CCS. This relatively low dose achieved 2 benefits, namely, less cost and better patient compliance. These findings need further support in larger studies for a longer duration.
Limitations
The number of patients needs to expand in a future study; this study is a pilot trial. We were not able to include another arm that received full dose sevelamer. We actually recommend a future study comparing low dose versus full dose of sevelamer.
References
-
Mizobuchi M, Towler D, Slatopolsky E (2009) Vascular calcification: The killer of patients with chronic kidney disease. J Am Soc Nephrol 20(7): 1453-1464.
-
Block GA, Port FK (2000) Re-evaluation of risks associated with hyperphosphatemia and hyperparathyroidism in dialysis patients: Recommendations for a change in management. Am J Kidney Dis 35(6): 1226-1237.
-
Viaene L, Bammens B, Meijers BK, Vanrenterghem Y, Vanderschueren D, et al. (2012) Residual renal function is an independent determinant of serum fgf- 23 levels in dialysis patients. Nephrol Dial Transplant 27(5): 2017-2022.
-
Gutiérrez OM, Mannstadt M, Isakova T, Rauh-Hain JA, Tamez H, et al. (2008) Fibroblast growth factor 23 and mortality among patients undergoing hemodialysis. N Engl J Med 359(6): 584-592.
-
Nasrallah MM, El-Shehaby AR, Salem MM, Osman NA, El Sheikh E, et al. (2010) Fibroblast growth factor-23 (FGF-23) is independently correlated to aortic calcification in haemodialysis patients. Nephrol Dial Transplant 25(8): 2679-2685.
-
Urakawa I, Yamazaki Y, Shimada T, Iijima K, Hasegawa H, et al. (2006) Klotho converts canonical FGF receptor into a specific receptor for FGF23. Nature 444(7120): 770 -774.
-
Suki WN, Zabaneh R, Cangiano JL, Reed J, Fischer D, et al. (2007) Effects of sevelamer and calcium-based phosphate binders on mortality in hemodialysis patients. Kidney Int 72(9): 1130-1137.
-
Ossareh S (2014) Clinical and economic aspects of sevelamer therapy in end-stage renal disease patients. Int J Nephrol Renovasc Dis 8(7): 161-168.
-
Ishizu T, Hong Z, Matsunaga T, Kaneko Y, Taru Y (2013) Efficacy of continuous oral administration of lanthanum carbonate over 24 months. Ther Apher Dial 17(Suppl 1): 22-28.
-
Agatston AS, Janowitz WR, Hildner FJ, Zusmer NR, Viamonte M, et al. (1990) Quantification of coronary artery calcium using ultrafast computed tomography. J Am Coll Cardiol 15(4): 827-832.
-
Levin A (2003) Clinical epidemiology of cardiovascular disease in chronic kidney disease prior to dialysis. Semin Dial 16(2): 101-105.
-
Covic A, Kanbay M, Voroneanu L, Turgut F, Serban DN, et al. (2010) Vascular calcification in chronic kidney disease. Clin Sci (Lond) 119(3): 111-121.
-
London GM, Guerin AP, Marchais S, Métivier F, Pannier B, et al. (2003) Arterial media calcification in end-stage renal disease: Impact on all-cause and cardiovascular mortality. Nephrol Dial Transplant 18(9): 1731-1740.
-
Locatelli F, Del Vecchio L, Violo L, Pontoriero G (2014) Phosphate binders for the treatment of hyperphosphatemia in chronic kidney disease patients on dialysis: a comparison of safety profiles. Expert Opin Drug Saf 13(5): 551-561.
-
Asmus H, Braun J, Krause R, Brunkhorst R, Holzer H, et al. (2005) Two year comparison of sevelamer and calcium carbonate effects on cardiovascular calcification and bone density. Nephrol Dial Transplant 20(8): 1653-1661.
-
Cozzolino M, Missaglia E, Ortiz A, Bellasi A, Adragao T, et al. (2010) Vascular calcification in chronic kidney disease. Recenti Prog Med 101(11): 442-452.
-
Lin HH, Liou HH, Wu MS, Lin CY, Huang CC ( 2014) Long-term sevelamer treatment lowers serum fibroblast growth factor 23 accompanied with increasing serum Klotho levels in chronic haemodialysis patients. Nephrology (Carlton) 19(11): 672-678.
- Results of 6-Month Follow-Up of Patients After B-Turp and Thulep
- The Effect of Drinking Water with a High Content of Antimony and Arsenic on the Dynamics of their Distribution in the Kidneys and the Renal Excretory Function in Rats
- Effectiveness and Safety of Tansurethral Thulium Laser Enucleation of the Prostate in the Treatment of BPH: Review
- A Systematic Review on Molecular Pathophysiology Involved in Chronic Kidney Disease and the Role of Animal Models in Drug Discovery to Manage in Chronic Kidney Disease - An Update
- Functional Development of Kidneys in Human Ontogenesis
- Testicular Metastasis: Uncommon Prostate Cancer Case Report