Electronic Waste Management in the Top Ten Economies in the World: A Critical Review on Waste Generation, Regulations, Collection, Recycling and Environmental Challenges
Sustainable management of electronic waste (e-waste) is a challenging issue due to high rates of waste generation, hazardous and complex nature and associated environmental impact. To understand the global e-waste scenario, an overview is presented on the generation, collection and recycling of e-waste in the top ten economies in the world, namely USA, China, Germany, India, Japan, UK, France, Italy, Canada and Brazil. State of these economies were analysed in terms of GDP, population, income/ capita and trends in e-waste generation during 2024. The generation of e-waste was found to increase linearly with annual per capita incomes up to 35000 USD but tended to flatten out for higher incomes. For e-waste legislative frameworks, these economies were clubbed into three sub-groups: Europe (Germany, France, Italy, UK), Asia (China, India, Japan) and Americas (USA, Canada, Brazil). Europe had the most comprehensive e-waste legislations. While Asian countries had kept pace to certain extent, both USA and Canada had only state level legislations. The e-waste collections ranged between 12.7% to 59.6% (of the total e-waste) for Europe and America, these were about 1.4%, 3.2% and 16.2% for India, Brazil and China respectively. Such low levels of formal collections highlight the importance of informal sector in these countries. Case studies on India and China were presented for detailed comparisons between the formal and the informal sectors. High levels of unaccounted e-waste were found to be a serious concern for sustainable waste man
Khanna R¹*, Konyukhov Y², Park M³, Mukherjee PS⁴ and Kravchenko M⁵
¹School of Materials Science and Engineering (Ret.), The University of New South Wales, Australia ²Department of Enrichment and Processing of Minerals and Technogenic Raw Materials, National University of Science and Technology “MISIS”, Russia ³School of Built Environment, The University of New South Wales, Australia ⁴Institute of Minerals and Materials Technology (Ret.), Council of Scientific and Industrial Research, India ⁵Moscow Power Engineering Institute, National Research University, Russia
Abbreviations
GDP: Gross Domestic Product; EC: European Commission; WEEE: Waste Electric and Electronic Equipment; RoHS: Restriction of Hazardous Substances Directive; MoEFCC: Ministry of Environment, Forests, and Climate Change; NCER: National Center for Electronics Recycling.
Introduction
Electronic waste (E-waste), also known as WEEE (Waste Electrical and Electronic Equipment), refers to discarded end-of-life electrical and electronic equipment with little further utility. These waste products could originate from large devices such as fridges, TVs, air-conditioners, computers, laptops, printers, electronic panels and else, and/or small electrical/electronic devices such as mobiles, lighting, cameras, smart watches to name a few. With rapid growth in internet across the globe, mobile and information- based technologies, there is an explosive increase in the electronics/devices sector with applications in commerce, education, health, entertainment, government sectors [1]. Smart phones/devices have become an integral part of everyday life in the modern society; the total number of global mobile devices are expected to exceed 18.2 billion by 2025 [2]. In addition to stand-alone equipment, electronic products are used increasingly in buildings, transport, energy and healthcare sectors; there are cross-over products as well such as wearables, medical monitoring, e-textile, photovoltaic cells in clean energy and else.
Enhancing efficiency, convenience, productivity and connectivity, these devices are almost omnipresent, and not limited to any specific geographical region, poor/developing/ developed economies or specific strata of society. High levels of consumerism, a throw-away society, rapid upgrades, a tendency to replace rather than repair and aggressive marketing by electronics producers are some of the factors fuelling equipment disposal further exacerbating e-waste crisis. All electronic equipment has finite life expectancy, and these need to be replaced/discarded once they stop functioning, require upgrades, have software compatibility issues etc. It is to be expected that the total number of users, usage of electronic devices and volumes of e-waste will continue to grow in the near and long-term future unless steps are taken to reverse some of these trends. E-waste generation worldwide has almost doubled in the last ten years, growing to ~62 billion kg in 2022 [3].
Challenges with E-waste management and associated environmental impacts have been well recognised; continuous efforts are being made through research, legislation, various organisations, civic and waste management authorities all over the world. During the period 2010-2024, a total of 77,048 book chapters, 8,337 encyclopedias, 695,343 research articles and 66,021 review articles were published [4]. With so much research output, there is a strong likelihood of sufficient technical know-how currently available to address various aspects of e-waste recycling, processing and management.
E-waste is one of the fastest growing solid waste streams in the world [5]. It is a hazardous waste containing several toxic elements and materials, and may also produce additional toxic chemicals, toxins, furans during inappropriate processing [6]. Many of these toxic materials, that belong to the 10 chemicals of public health concern, could cause serious harm to human health, flora and fauna, and the environment [7, 8]. One of the major concerns is that less than quarter of the e-waste generated was officially documented as collected and recycled in 2022 [9], and more than 62 billion USD (US Dollars) worth of materials were unaccounted for [10]. According to Unitar (United Nations Institute for Training and Research, Sustainable Cycles Program), e-waste generated was rising nearly five times the e-waste collected and recycled [11]. Unaccounted e-waste was either handled/processed inappropriately or was just dumped along with municipal solid waste, incinerated or landfilled resulting in serious environmental damage and pollution risks worldwide.
To get a deeper understanding and a clearer picture of the global e-waste management scenario, in this article we focus our attention on the top ten economies in the world rather than different geological regions or the state of the economy such as developed, developing or underdeveloped economies. These ten economies were chosen to ensure a high level of consumption, economic activity, waste generation and the fact that the lack of economic resources will not be a limiting factor in achieving the best possible outcome for sustainable e-waste management. Our aim is to get a perspective on the situation in the top ten economies in terms of gross domestic product (GDP), namely, USA, China, Germany, India, Japan, UK, France, Italy, Canada, Brazil [12].
With these economies coming from Americas, Asia and Europe, there are big differences in their income/capita, populations, consumption levels, living standards, legislative and environmental policies and others. We have carried out in- depth critical review on the available information on several key aspects of e-waste management such as generation, regulations, collection, recycling and environmental challenges. Aiming for sustainable developments in the field, this study will help identify bottlenecks, certain fallacies in the reported data, the role of the informal sector, status of commercial e-waste recycling and pathways toward a deeper understanding of the field.
State of the Economy and Basic Parameters
Figure 1 shows specific details on the state of the economy for the top ten countries in terms of GDP (in trillions USD), population (in millions) and income/capita (in thousands USD) as per the data available for 2024 [12, 13]. The top two economies, namely USA and China, are far ahead of the rest of the countries in terms of GDPs; both China and India are far ahead of others in terms of their population. While the per capita income for the USA was the highest (89,700 USD), it ranged from 35,000 USD to 57,000 USD for other developed countries such as Japan and European Union nations. China, Brazil and India have much lower per capita income ranging from 2,900 to 13,900 USD and may still be termed as developing countries despite breaking into the top ten.
The data presented in Figure 1 can affect the consumption of electronic products, disposal and the generation of e-waste in a myriad of ways. Higher purchasing power/ living standards would generally lead to higher consumption of electronic goods, higher rates of disposal, higher levels of upgrades to the latest technologies, which in turn would result in significant increases in the e-waste generation.
![Figure 1: Basic economic data for the top ten economies in the world [12]. Logarithmic scale has been used along the y-axis of all three plots.](/fulltextimages/14135/fig_1.jpeg)
However, the population plays a very important role as well in the generation of e-waste. With almost everyone owning a mobile/device, these numbers can become very high in lower income countries as well. However, disposal rates will generally be much lower with a strong tendency toward repairs, reutilization and recycling than outright dumping or throwing away. In addition, there is a great deal of inequality in the income levels of the rich and the poor/ or the lower middle class.
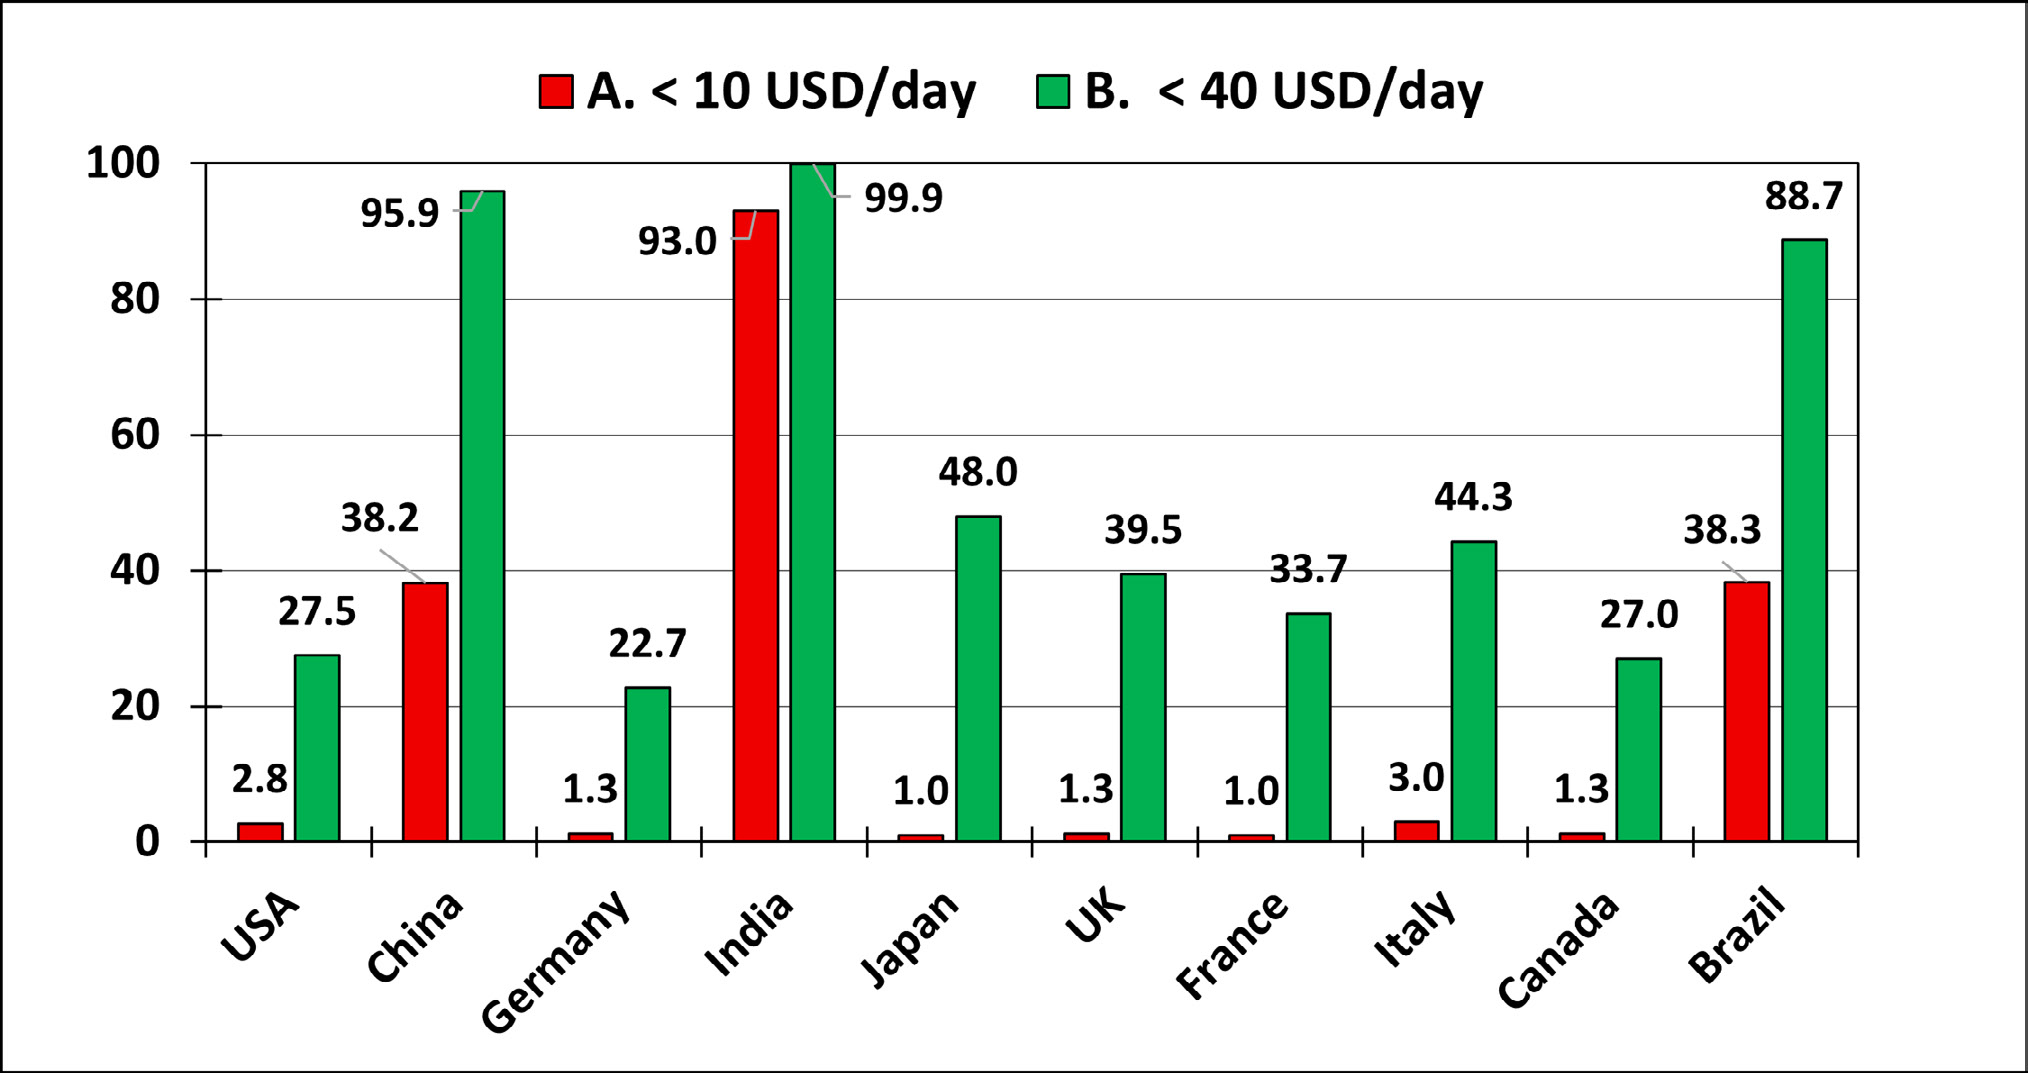
Figure 2 shows the percentage of population with incomes below 10 USD and 40 USD per day reflecting poverty and extreme poverty in the populace [14, 15, 16]. With 22 to 48% population in this category for USA, Germany, Japan, UK, France, Italy and Canada and between 88.7% and 99.9% in Brazil, China and India, the basic behaviour and trends in e-waste generation for poor economies would be replicated to a certain extent in the top ten economies as well.
E-Waste Generation
Basic Statistics
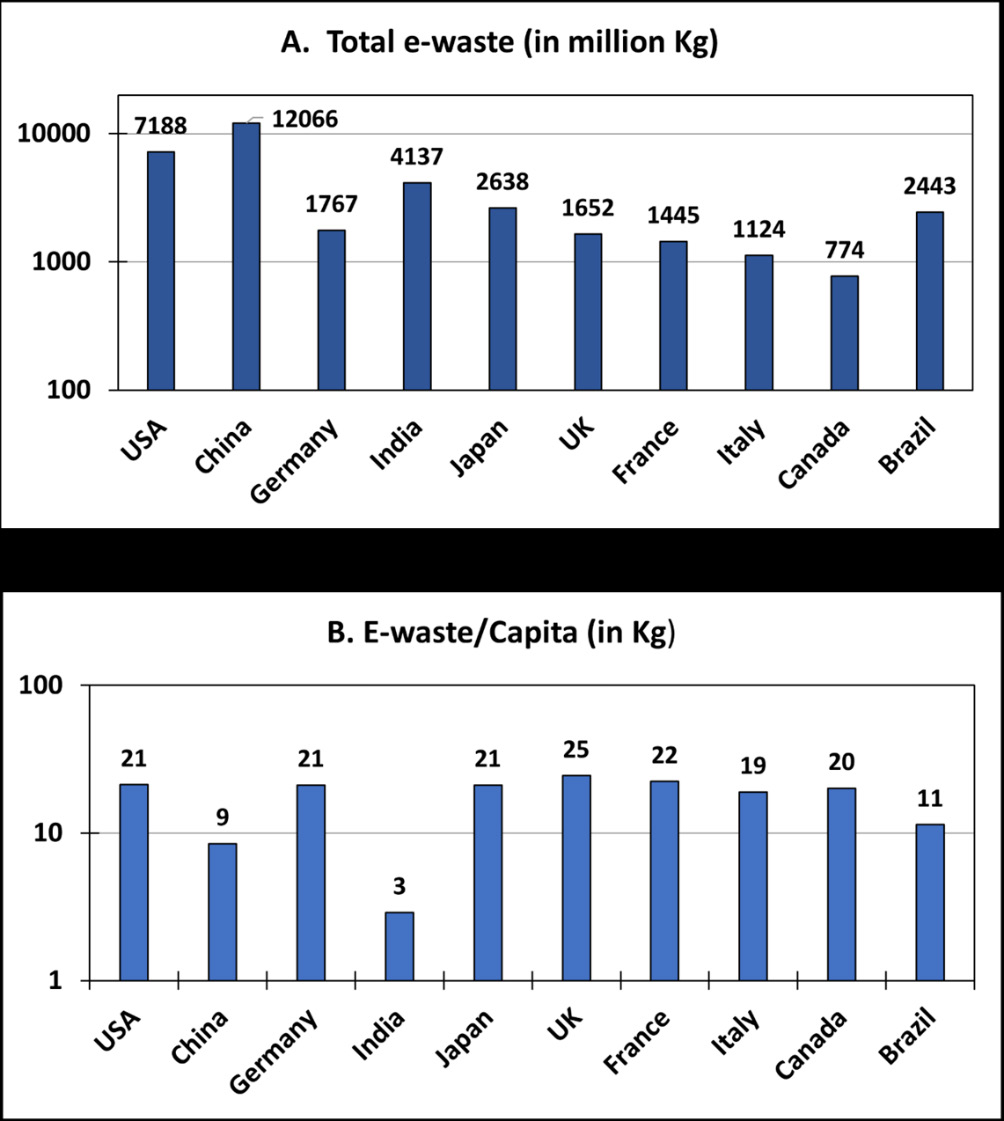
Figure 3 shows the annual volumes of the total e-waste (in millions Kg) and e-waste generated per capita (Kg/Capita) in 2020 as reported in the literature for the top 10 economies of the world [17, 18, 19, 20, 21, 22]. While the highest amounts of e-waste were generated in China (12.066 million tons), USA was in the second place with 7.188 million tons, and India was in the third place with 4.137 million tons (Figure 3A). It is interesting to note that the lowest per capita e-waste was produced in India (3 Kg), followed by China (9 Kg) and then Brazil (11 Kg) (Figure 3B). Other seven economies including Americas and European nations had very similar per capita generation of e-waste (19-25 Kg).
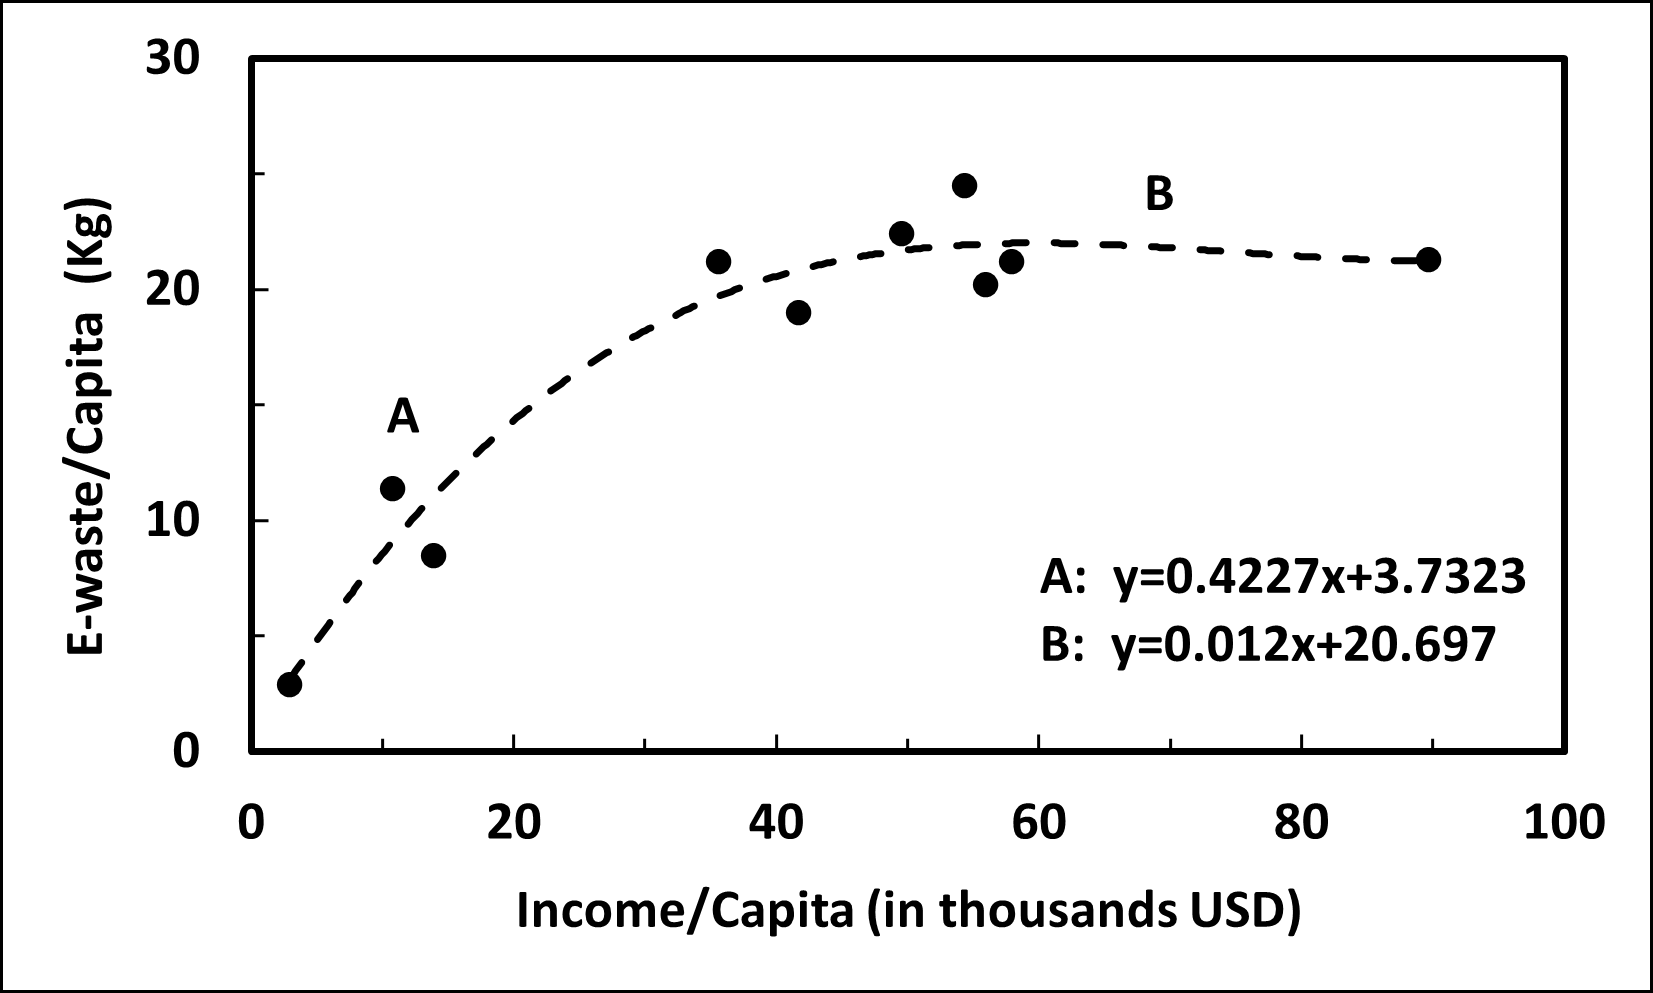
In Figure 4, we have plotted e-waste generated per capita as a function of income/capita for these ten economies. Interestingly, the generation of e-waste was found to increase linearly for per capita income levels up to ~35,000 USD and tended to flatten out for incomes up to 90,000 USD. This result indicates that in the low to middle class developing nations (section ‘A’), the generation of e-waste was found to increase almost linearly with increasing income levels; this trend would also indicate increasing consumption levels as well. In this region the base level (intercept) was quite low (3.7323) but the rate of increase (slope) was steep (0.4227). However, for the section ‘B’, the base level (intercept) was quite high (20.697) but the rate of increase (slope) was rather flat (0.012). No direct link was observed for rich economies with per capita incomes more than 40,000 USD; all these nations belonged to the ‘developed’ nations category.
Socio-Economic Factors
Several studies have explored the correlation between WEEE generation and socio-economic factors in the economy [23, 24]. While a high degree of correlation was observed between WEEE generation and the local GDP, no direct link was noticed with population growth except for China. The likelihood of links between mismanaged E-waste and economic growth in 27 European nations were investigated during the period 2008-2016 [25]; economic growth in these countries was found linked to increases in uncollected, non- recycled and non-reused WEEE. A reduction in subsidies in the private sector also resulted in higher amounts of mis-managed WEEE. Differences in social and economic conditions between the rural and urban areas, provinces, illegal collections, lack of statistical information generally resulted in incomplete and incoherent data on E-Waste generation.
Efforts are being made toward preventing e-waste generation to the extent possible, e.g., portable electronic devices (PED) including chargers, accessories, USBs (universal serial bus) etc. contribute significantly to the consumption, production and amount of electronic equipment being marketed [26, 27]. While it is common to store old smartphones for an average of two years before discarding, associated PEDs might still be functional and operational [28]; these devices are often sold along with accessories accounting for up to 48% of annual consumption of electronic products in the USA and about 260 million units in 2018 in European union [29]. Standardizing various PED peripherals, their continuing reuse and extending life beyond a given device could be used as a strategy for reducing WEEE generation, enhancing waste management policies and promoting an efficient and sustainable circular economy [30, 31].
Several factors could influence the lack of standardization of PED components. Firstly, the lack of political interest, differences among stockholders and lack of technical know-how in decision making [32]. Economic factors include the cost of modifying production lines, counterfeit or smuggled products and the final prices to be passed on to the consumers [33]. Social concerns involve the lack of awareness among consumers, safety related issues, irregular storage, accumulation and disposal of out- dated devices [34]. Technological factors include the lack of technical maturity toward EEE standardization, electrical and data protocols, compatibility of PEDs and accessories; environmental impacts of standardization involve lack pf PED modularity and materials used in various versions etc. [35]. Legal uncertainties about trade agreements, patents, costs of conformity, assessment and enforcement are some of the additional challenges [36, 37]. Strategies such as repairs, remanufacturing, disassembly, component removal are not viable for low-value peripherals; investing in equipment durability through component standardization and modularity will be a sustainable alternative to exploitation of primary natural resources and e-waste generation.
Trans-Boundary E-Waste Movements
Efforts are being made to limit the generation of E-waste on several fronts, the illegal dumping of e-waste by the rich nations onto the global south continues unabated. It is estimated that up to 80% of global north’s luxury goods head toward poor nations of global south as community graveyard. Europe, East Asia and North America are primary exporters of uncontrolled e-waste exports, mainly to Africa, Southeast Asia, Central America, and South America. Recipient countries in Africa, Southeast Asia, Central America and South America have low recycling rates and a high presence of informal workers in the domestic sector. Under the Basel convention [38], E-waste can be categorised as hazardous or non-hazardous depending on the presence of toxic materials such as lead, mercury, brominated flame retardants etc.
According to ‘Global Transboundary E-waste Flows Monitor – 2022’ [39], it is estimated that nearly 10% of total global e-waste (53.6 Mt) crossed countries borders in 2019. Of which nearly 1.8 Mt of e-waste was shipped in a controlled manner to few specified end-processors; most shipments were illegal and uncontrolled as inspection capacities are generally very limited in comparison to the overall transboundary movement.
There have been recent amendments to the Basel convention [40] starting w.e.f. January 1, 2025. Now the international shipments of e-waste and scrap will be permitted only after the prior written consent of the importing and transit countries. These rules will be applicable to hazardous and non-hazardous scrap and e-waste including full equipment, components and dismantled fractions. The OECD countries have updated their rules to ensure each member country to control e-waste in conformity with its domestic legislation and international law [41]. Japan has established criteria for distinguishing import and export of electronic waste (e-waste) subject to control under the Japanese Basel Act [42].
E-waste Regulations
Formal collection of e-waste is managed in line with the national e-waste legislations and relevant legal instruments in place. Producers, designated organisations and government departments are primarily responsible for collecting e-waste using pick-up services, municipal collection or retailers. In this section, we have clubbed the top ten economies into three sub-groups: Europe (Germany, France, Italy, UK), Asia (China, India, Japan), Americas (USA, Canada, Brazil) and have summarised key points of e-waste legislations enacted in these countries along with other aspects of e-waste collection.
Europe
The European Union has some of the most comprehensive and uniform e-waste collection legislations. Directives are established by the European Commission (EC), which the member states transpose into their own national laws. The Waste Electric and Electronic Equipment (WEEE) directive is a uniform regulation for the collection and processing of e-waste first introduced in 2002 [43, 44]. It is linked with the ‘Restriction of Hazardous Substances Directive’ (RoHS) that limits the use of certain hazardous materials in the manufacture of electronic and electrical equipment and the regulation on ‘Registration, Evaluation, Authorisation and Restriction of Chemicals’ REACH. Upgraded first in 2012 (Directive 2012/19/EU), it was revised again in 2019 and in 2024; these upgrades are setting higher recycling targets and broadening the scope of generated e-waste [45]. Germany has adopted a comprehensive and forward-thinking e-waste management system [46].
Being directly relevant to the present study, some verbatim excerpts from the legislation are provided next. As a comprehensive legislation, this Directive has detailed articles on: product design (to promote the design and production of EEE, notably in view of facilitating re-use, dismantling and recovery of WEEE, its components and materials); separate collection (to minimise the disposal of WEEE in the form of unsorted municipal waste, to ensure the correct treatment of all collected WEEE and to achieve a high level of separate collection of WEEE); disposal and transport of collected WEEE (prohibit the disposal of separately collected WEEE which has not yet undergone the treatment); collection rate (the minimum collection rate shall be 45 % calculated on the basis of the total weight of WEEE); proper treatment (all separately collected WEEE undergoes proper treatment); permits (any establishment or undertaking carrying out treatment operations obtains a permit from the competent authorities); shipments of WEEE (decisions on the control of transboundary movements of wastes); recovery targets (to ensure that producers meet the minimum targets set out); financing with respect to the collection from private households/others; registration, information and reporting and else.
Asia
China: China is the global manufacturing base for many categories of EEE. It is estimated that China treats about 70% of the world’s e-waste; this volume includes a substantial domestic contribution from China itself, which is now one of the largest generators of e-waste in the world. In 2006, China introduced the Measures for Administration of the Pollution Control of Electronic Information Products (“China RoHS”) and in 2009 the Ordinance on the Administration of the Recovery and Treatment of Waste Electrical and Electronic Products (“China WEEE”). This requires manufacturers and importers to pay a fee to a government fund to subsidise the waste recovery and recycling [47]. The Chinese government has also started to regulate the e-waste recycling industry in Guiyu and other designated e-waste processing hotspots.
China’s WEEE management, a total of 103 policies, has evolved over the past 20 years through four stages (1) Slow start stage prior to 2009 with no specific policy; recycling by individual workshops, limited technology and high levels of pollution, (2) Exploration stage (2009-2011) involving trade-ins, centralized recycling, WEEE directory and fund system, (3) Rapid explosive stage (2012-2016) establishing extended producer responsibility (EPR) policies with levies on producers and importers, subsidies for recyclers, establishment of formal WEEE enterprises, (4) Stable development stage (2016 onwards) actively promoting new collection models [48, 49, 50]. The “Implementation Plan for Promoting Green Consumption” was released in 2022, promoting the active implementation of ‘Internet + recycling’ using tools, ideas and internet resources for promoting recycling and WEEE collection [51].
India: The Ministry of Environment, Forests, and Climate Change (MoEFCC) is primarily responsible for regulations regarding electronic waste in India. The e-waste (Management and Handling) Rules of 2011 came into effect in May 2012. All manufacturers and importers of electronic goods were required to come up with a plan to manage their electronic waste. Producers or importers had to establish e-waste collection centres or employ take back systems. Upgraded e-waste management rules (2016) clearly defined the duties of responsible parties, enacting more stringent regulations on e-waste production, as well as the general definition of e-waste [52]. This scheme assigned management and reporting responsibilities to the manufacturers to recycle e-waste and to minimise environmental damage.
These rules were further amended in 2018, which focussed on achieving e-waste collection targets of 10% during 2017–2018, 20% during 2018–2019, 30% during 2019–2020, and so on. The Central Pollution Control Board was given the power for testing the compliance of rules. Further upgrading of these rules in 2022 focussed on the registration of manufacturers, producers, refurbishers and recyclers under the EPR framework and their responsibilities, the responsibilities of state governments and union territories, the storage of e-waste, modalities of EPR regime, reduction in the use of hazardous substances during the manufacture of electronic goods, and others [53].
Japan: The Law for the Promotion of Recycling of Small Waste Electrical and Electronic Equipment (PRSWEEE Law) first became active in 2013 [54, 55]; it provides a legal recycling framework to recover more resources from the urban mining of WEEE. There are laws for recycling specified kinds of home appliances; Waste management and public cleansing law; law for the promotion of effective utilization of resources [56]. It has also developed a criteria for distinguishing used EEEs as second-hand goods for exportation in 2013 [57]. There is a law for marking for the presence of the specific chemical substances Pb, Hg, Cd, hexavalent Cr etc. in EEE [58]. Japan has amended Waste management and Basel acts in 2018 toward strengthening environmentally sound management (ESM) of e-waste and the promotion of import of hazardous waste [59].
Americas
USA and Canada: Both United States and Canada have no national legislations, and the United States is not a signatory to the Basel convention [60]. Twenty-five U.S. states (plus the District of Columbia) currently have electronics recycling laws; a summary and link to the laws as well as the key dates can be found at the ‘National Center for Electronics Recycling (NCER)’ website [61]. Generally, many state schemes are based upon a product stewardship model for computer equipment, monitors and televisions requiring producers and manufacturers to pay an annual registration fee. In California consumers pay a recycling fee when purchasing of specific types EEE [62].
Brazil: The Brazilian government has implemented a ‘National Policy for Solid Waste (NPSW)’ with short, medium and long-term goals to be met by the government, private initiatives and civil society [63]. In Article 33, the manufacturers, importers, distributors and traders of electronic products/components have an obligation for managing post-consumer electronics irrespective of the public management of solid waste. The resulting process is consistent with reverse logistics for moving end-of-life goods for remanufacturing, refurbishing, resource recovery or proper disposal [64, 65]. A sectoral agreement was signed by the government for structuring, implementing, and operationalizing the reverse logistics system for household electrical and electronic products on the domestic market [66, 67]. E-waste collection: Formal and Informal Sectors The percentage fraction of the total e-waste collected in the top ten economies is shown in Figure 5 based on the data available in 2022 [10, 11]; this data represents collection statistics in the formal sector only. Several interesting features about these are given next. Even in nations with national e-waste regulations in place, the formal collection rates remain poor with improper handling and prevalent illegal trade in e-waste. The management and compliance vary and are often applied only to isolated formal (regulated) recycling operations. These sectors must compete with the dominant and widespread informal collection methods. During the initial few years of WEEE directive, most of the e-waste remained completely unaccounted for due to loopholes and difficulties law enforcement.
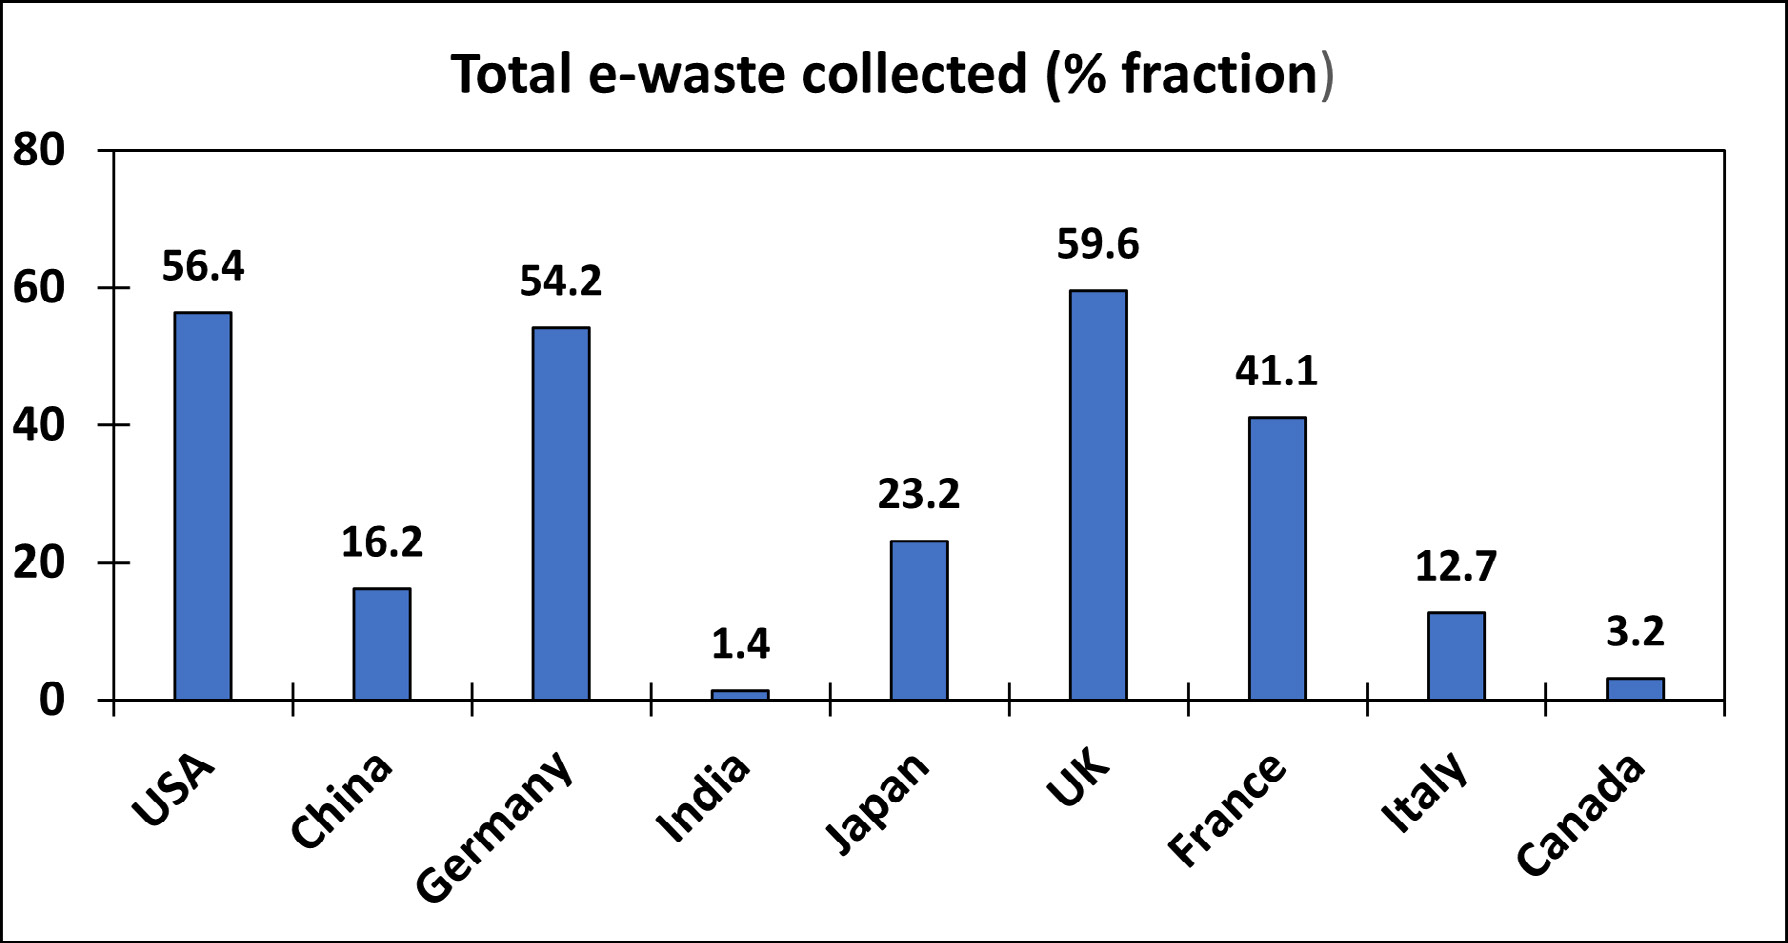
Around 75% of global e-waste is either dumped in landfills or remains unaccounted. Extremely low collection rates recorded for India, Brazil and China reflect the burgeoning informal sector in these countries, where a large proportion of e-waste is collected and processed in an illegal as well as unsafe manner without governmental control or supervision. In addition, the illegal transboundary movement from rich, developed nations to the poor or low- income countries continues unabated despite international regulations. Recent studies by the Basel Convention on e-waste in Africa have highlighted the ongoing stream of used electrical and electronic equipment reaching the continent from industrialized countries, including the EU member states for recycling or disposal [67]. In general, the developed economies are more likely to have e-waste regulations and enforceable management systems in place but paradoxically fail to match in volume and efficiency in the amount of e-waste collected. It is also hard to measure this disparity accurately due to insufficient reporting of opaque international trade in e-waste [68].
Informal Sectors
Informal collection encompasses a range of unregulated and unreported collection arrangements. In developed economies, e-waste is often mixed in other scrap materials or ends up in non-separated collected waste that is either incinerated or landfilled. The remainder is exported to the poor and developing regions of the world where a significant proportion of e-waste processing is carried out in the informal recycling sector. Extensive informal sector is a key challenge to the economically and environmentally safe and sustainable e-waste management [69, 70, 71]. In developing countries, attention needs to be focussed on informal sectors due to pervasive market-driven and bottom-up recycling activities [72]. The informal sector workers also lack labour standards and rights and often experience poor health and environmental problems [59]. General information on extensive informal e-waste sectors in China, India and Brazil is presented next.
China
A significant fraction of e-waste recycling in China is undertaken by an extensive and well established multi- tiered informal recycling sector [73]. The e-waste recycling chain starts with the collection by informal collectors purchasing e-waste directly from households and businesses or through opaque means of illegal imports. China was traditionally a major destination for illegally imported e-waste [74], but the scenario is beginning to change under Chinese governmental policies. Domestic e-waste collection is focused mainly on urban and coastal regions with larger populations. Collectors, often migrant workers from rural areas, operate as door-to-door brokers between households and mid-level scrap dealers, dismantlers and repairers. They negotiate a price to buy and collect household items ranging from plastic, paper and metal scraps to household appliances and other EEE [75]. This collected waste is then sold to other informal recyclers for repair, refurbishment and dismantling. Despite significant development of the formal recycling pilot projects, these often struggle to complete and cannot match the price or service offered by informal waste peddlers to the households and businesses.
Activities based on rudimentary techniques are mostly concentrated in specific regions, especially in south-eastern China. Guiyu (Guangdong Province) was once the largest e-waste recycling hub in the world, with informal activities reported as far back as 1995 [76, 77]. E-waste was processed in open-air backyards, open burning, and open acid baths of PCBs were some of the common practices in early days [78]. Severe environmental damage, occupational hazards and health impacts on the surrounding populace, waterways and land are well documented [79, 80]. Schneider and Zeng [81] have documented some of the old practices that are still being used in Guiyu, e.g., the transport of e-waste by tricycles, open storage, dismantling equipment by crouching on floor etc, high temperature separation of components, simple tools, lack of protective equipment and else.
Due to the very high volumes of e-waste being generated, the government has brought in several initiatives and legislations for the industry. Nearly 21.9 billion Chinese Yuan (CNY) were provided as subsidies to e-waste recyclers during the period 2012-2020; nearly 600 million units of large electronic equipment, e.g., air-conditioners, TVs, Fridges, computers, were processed in the formal recycling facilities [82]. In recent years, China has built a formal e-waste recycling system with 109 e-waste recycling plants nationwide, operated under the best available technologies and strict environmental standards [83]. However, the formal sector depends to a great extent (up to 90%) on the WEEE collected and dismantled in the informal sector. The authorities need to improve the informal sector as well in terms of gradually improving their working conditions, efficiency, worker safety and health [84].
India
In addition to a rapidly growing domestic e-waste generation, India is another major destination for the global trade in e-waste. A vast majority (up to 95%) of this waste is recycled and processed by a distributed network of informal sector which collects, dismantles and recycles e-waste, mostly operating outside of any regulation or formal organisational system. Informal sector collectors that operate door-to-door can offer higher prices than the few formal regulated recyclers that are starting to enter the market. However, the efficiency of the collection services provided by this sector is remarkably successful, especially in contrast to e-waste collection rates in most developed economies. Their extensive and widespread operations often limit the e-waste supply to the formal recyclers making them operate at lower capacities [85, 86]. Cheap labour, large manpower, inexpensive collection methods, and low operating costs are crucial factors that favour informal e-waste collection and supply chains in India [87]. It often involves uneducated and poor workers from the slums or rural areas, who earn their livelihood through scavenging, using unsafe practices creating health and environmental hazards for themselves, society and the neighbourhood [88]. These practices are being strongly discouraged by the local, state and national governments and are getting mostly eliminated.
Formalised e-waste collection and drop-off services have started to appear in India but struggle to compete with scrap collectors who are widely distributed and pay households for their waste. In Bangalore, nicknamed the Silicon Valley of India, various initiatives have been piloted for the collection of e-waste by providing drop-off locations as well as commercial services for waste collection from businesses and institutions. More novel methods include mobile e-waste pick-up vehicles and collection units placed at various post offices. A modified EPR scheme needs to be formulated by integrating informal e-waste collectors with the formal e-waste management and value recovery businesses [89]. The links between the informal and the formal sectors need to be fostered and developed further to establish a sustainable e-waste industry in India along with a transition to circular economy, human capital development and sustainability.
Brazil
Brazil is one of the few developing countries that provides incentives to the waste pickers as important members in the waste management policies. Brazilian labour ministry has recognised ‘collectors of recyclable materials’ as a professional employment activity since 2002, supporting social/economic inclusion of these workers, and their integration as waste picker organisations (WPO). Within the legislative framework, conditions were established towards promoting governmental actions in support of productive organization of waste pickers, improvements in working conditions, social and economic uplifting and inclusion, among others [90]. E-waste importers, recyclers, producers can collect and transport e-waste either individually or collectively and are responsible for the reverse logistics of their products. There is a management fee for the market participation as well. An e-waste collection target of 17% has been set for 2025 by operating WEEE reverse logistics operation in over 400 municipalities [91].
There are not many e-waste recycling facilities in Brazil, most are engaged in dismantling end-of-life equipment. Collection of e-waste takes place through private collection, partnership between companies, volunteer delivery by consumers, waste pickers supplies and municipal programs etc [92]. After preliminary processing such as dismantling, sorting and grinding, these are exported overseas for recycling. Manufacturers, importers, distributors and e-waste recyclers work almost independently in the current management scenario; the rates of formal collection and recycling are very low in Brazil [93].
Formal and informal recycling: Case studies of India and China
Formal recycling and the management of e-waste is usually carried out by certified recyclers, producers and operators duly registered with their respective governments and operating within the law of the land. Being the major players in the e-waste scenario, basic statistical details are presented next on the developing economies namely India and China as two case studies. These two nations have high stakes in developing environmentally and economical sustainable e-waste management.
India
In India, the total number of EEE producers having EPR authorization under E-Waste management rules (2016) have reached 2309 in 2023, an increase of 423 from the corresponding numbers in 2022 [94]. The number of registered ‘Producer Responsibility Organisations’ (PROs) were 95 in 2023, an increase of 21 from those in 2022. Currently there are 567 registered dismantlers/e-waste recyclers operating in 22 states of India. These states include Andhra Pradesh, Assam, Chhattisgarh, Delhi, Gujarat, Goa, Haryana, Himachal Pradesh, Jammu & Kashmir, Jharkhand, Kerala, Karnataka, Madhya Pradesh, Maharashtra, Odisha, Punjab, Rajasthan, Tamil Nadu, Telangana, Uttar Pradesh, Uttarakhand and West Bengal. The total annual processing capacity is about 17.23 million tons/annum. In 2022, an estimated 16.02 million tons of e-waste was generated in terms of 21 types of notified EEEs according to 2016 regulations. New regulations released in 2023 cover 106 types of EEEs. An estimated 5.27 million tons of e-waste was dismantled in 2022. Some of the major registered e-waste recyclers in India are Attero recycling (Roorkee, Uttarakhand), Ecoreco (Mumbai, Maharashtra), Saahas Zero Waste (Bengaluru, Karnataka) Namo eWaste (Gurugram, Haryana), E-Parisara (Bengaluru, Karnataka) among others. [95, 96, 97, 98, 99].
China
In addition to setting up essential legislative framework for managing hazardous e-waste, several regional disposal centres have been established in China to limit informal/ backyard recycling operations and to mitigate harmful environmental damage [100]. A total of five batches of 109 registered WEEE recycling companies were included in the list of WEEE fund subsidies during the period 2012-2019; these were distributed in 29 provincial administrative units. Total annual processing capacity of 163 million tons was achieved during this period. The licensed companies are distributed in different provinces in China, according to the mapping provided by Awasthi, et al. [52]. Most of these are in the east, which has a higher gross domestic product measure than other regions in the country [101]. Those performing the dismantling of appliances, and are listed in the First Catalogue, receive financial incentives from the Fund Policy. Such incentives have pushed up pre-processing activities, consequently strengthening the supply to companies that perform the end-processing [102]. Some of the key certified recycling plants in China are as follows: Beijing (Beijing Jinyu Mangrove Environmental Protection Technology Co., Ltd.; TES-AMM (Beijing) Co., Ltd.); Tianjin (Tianjin Hengchang Environmental Protection Technology Co., Ltd.; Tianjin Green Angle Recycling Co., Ltd.; Tianjin Ziya Environmental Protection Industrial Park; Tianjin Hejia Veolia Environmental Services Co., Ltd; Protection Science-Tech Co., Ltd.; Taiding (Tianjin) Environmental Protection Science-Tech Co., Ltd.); Shanghai (Shanghai San Jing Xin Yun Precious and Rare Metals Recycling Co., Ltd.; Shanghai Central WEEE Recycling Co., Ltd.; Shanghai Xin Jinqiao Industrial Waste Management Co., Ltd.; Shanghai Senlan Industrial Waste Management Co., Ltd.). There are several treatment facilities in Suzhou, Huizhou and Harbin as well [103].
Impact of Informal Recycling
Although the governments of China and India are making serious efforts through appropriate legislations, development of adequate infrastructures and formal e-waste recycling sectors, informal recycling far outpaces the formal sector and continues to grow unabated. Rising metal prices, especially gold, silver and copper have made unauthorized e-waste recycling a livelihood option, offering citizens an opportunity to get involved at different stages of e-waste management. Despite significant development of the formal recycling pilot projects, these often struggle to complete and cannot match the price or service offered by informal waste peddlers to households and businesses. Domestic e-waste collection is mostly processed in the informal sector across China.
In India, the formal sector faces stiff competition from the unorganised informal sector and was able to capture only 10% of the total share of the e-waste market due to limited collection, disposal mechanisms and adequate technologies [104]. Discarded electronic products are initially collected by a ‘Kabadiwalla’ from house to house, handed over to dealers or traders for segregation of different parts, extraction of components, valuables etc. In China, domestic e-waste collection is focused mainly on urban and coastal regions with large populations. Collectors, often migrant workers from rural areas, operate as door-to-door brokers between households and mid-level scrap dealers, dismantlers and repairers [105].
Despite the serious negative health and environmental impacts of the informal sector, a much more nuanced view is required to understand not just these disadvantages, but also the advantages and services offered by this sector. An early study comparing e-waste recycling in Switzerland and in India [106] found that e-waste collection has positive impacts for employment in India, while negative impacts for downstream recycling. Informal collection and recycling play a vital role supporting the global trade and recycling of e-waste. Of the various recycling activities associated with the collection, sorting, dismantling, and materials recovery could be carried out by the informal sector, and the end of line recycling preferentially in the formal sector where the most environmental and health impacts occur [107, 108]. There are clear environmental and social advantages for the informal sector to focus on the collection of e-waste. As per a StEP white paper released in 2016, “If an informal collection system exists, use it to collect all e-waste, and ensure e-waste is sent to licensed recyclers through incentives” [109]. Any downstream e-waste recycling needs to adhere to higher environmental standards and accountability.
Conclusion
The opportunities and challenges for the management of e-waste are complex and vary for each geographical region, with most dramatic differences existing between the emerging and developed economies. Caution needs to be exercised for adopting e-waste regulations based on developed economies without taking into context the local political, cultural and socio-economic waste management issues. Another cause for concern is that even in the developed and rich economies, a very large amount of e-waste remains unaccounted for; typical e-waste collections range between 12.7% to 59.6% of the total e-waste generated (Figure 6). A significant proportion of the e-waste is going missing, most likely dumped with other wastes, just stored at homes, or landfilled. This is a serious cause for concern; such bottlenecks need to be removed through persistent effort, will and innovative solutions to the problem.
The developments in the e-waste treatment technologies also need to keep pace with the evolution of electronic products, as the composition of e-waste will change significantly from one generation to the next. For example, lithium-ion batteries have replaced lithium hydride batteries; new materials such as carbon nanotubes and metallic nanoparticles are also being used [110]. The emergence of advanced electronic materials, organic electronics, complementary metal-oxide-semiconductor (CMOS)-based technology for integrated circuits, embedded systems, printed electronics are some of the latest trends in the field, that would impact the composition of e-waste in the future [111, 112, 113].
Attention was focussed on the top ten economies in this overview. All these countries, whether developed, emerging or developing economies, have significant national wealth and sources despite widely different per capita incomes. As significant resources and efforts are/will be required for technical, economically feasible and environmentally sustainable developments in e-waste management and resource recovery, these countries, among others, should spear head future campaigns in the field.
References
-
One Global Definition of E-waste.
-
https://www.stepinitiative.org/files/_documents/ wh i t e p a p e r s / S t E P _ W P _ O n e % 2 0 G l o b a l % 2 0 Definition%20of%20E-waste_20140603_amended.pdf
-
(2021) Forecast number of mobile devices worldwide from 2020 to 2025 (in billions).
-
https://www.sciencedirect.com/search?qs=E-Waste.
-
(2024) The Global E-Waste Monitor
-
Khanna R, Cayumil R, Mukherjee PS, Sahajwalla V (2014) A novel recycling approach for transforming waste printed circuit boards into a material resource. Procedia environ Sciences 21: 42-44.
-
Cayumil R, Khanna R, Rajarao R, Ikram-Ul-Haq I, Mukherjee PS, et al. (2016) Environmental impact of processing electronic waste–key issues and challenges. E-Waste in Transition-From Pollution to Resource, IntechOpen, Rijeka.
-
WHO (2025) World Health Organisation.
-
He X, Jing Y, Wang J, Li K, Yang Q, et al. (2015) Significant accumulation of persistent organic pollutants and dysregulation in multiple DNA damage repair pathways in the electronic-waste-exposed populations. Environmental research 137: 458-466.
-
Widmer R, Oswald-Krapf H, Sinha-Khetriwal D, Schnellmann M, Böni H, et al. (2005) Global perspectives on e-waste. Environ Impact Assess Rev 25(5): 436-458.
-
Balde CP, Kuehr R, Yamamoto T, McDonald R, D’Angelo E, et al. (2024) The Global E-waste Monitor 2024. Bonn: International Telecommunication Union, United Nations Institute for Training and Resources, Geneva, Switzerland.
-
(2025) The National E-waste Monitor 2025, Norway.
-
(2025) The Top 25 Economies in the World.
-
(2025) World Population Review.
-
https://data.undp.org/poverty-and-inequality.
-
Hasell J, Roser M, Esteban Ortiz-Ospina E, Pablo AP (2024) Poverty.
-
https://ourworldindata.org/economic-inequality.
-
Waste from electrical and electronic equipment.
-
Forti V, Baldé CP, Kuehr R, Bel G (2020) The Global E-waste Monitor 2020: Quantities, flows and the circular economy potential. United Nations University (UNU)/ United Nations Institute for Training and Research (UNITAR) - co-hosted SCYCLE Programme, International Telecommunication Union (ITU) & International Solid Waste Association (ISWA), Bonn/Geneva/Rotterdam.
-
Eurostat (2022) Waste electrical and electronic equipment (WEEE) by waste management operations (env_waselee), Metadata in Euro SDMX Metadata Structure (ESMS). Eurostat, the statistical office of the European Union.
-
https://ec.europa.eu/eurostat/databrowser/view/env_ waseleeos/default/table?lang=en.
-
(2022) UK Environment Agency. WEEE collected in the UK.
-
https://ec.europa.eu/eurostat/databrowser/view/env_ waseleeos/ default/table?lang=en.
-
Dias P, Palomero J, Pilotto M, Cenci T, Scarazzato A, et al. (2022) Electronic waste in Brazil: Generation, collection, recycling and the covid pandemic. Cleaner Waste Systems 3.
-
Awasthi AK, Cucchiella F, D’Adamo I, Li J, Rosa P, et al. (2018) Modelling the correlations of e-waste quantity with economic increase. Sci Total Environ 613–614: 46-53.
-
Kumar A, Holuszko M, Espinosa DCR (2017) E-waste: an overview on generation, collection, legislation and recycling practices. Resour Conserv Recycl 122: 32-42.
-
Boubellouta B, Kusch-Brandt S (2021) Relationship between economic growth and mismanaged e-waste: panel data evidence from 27 EU countries analyzed under the Kuznets curve hypothesis. Waste Manag 120: 85-97.
-
Mesa JA, Gonzalez-Quiroga A, Aguiar MF, Jugend D (2022) Linking product design and durability: a review and research agenda. Heliyon 8: e10734.
-
Aguiar MF, Mesa JA, Jugend D, Pinheiro MAP, Fiorini PDC (2022) Circular product design: strategies, challenges and relationships with new product development. Manag Environ Qual Int J 33: 300-329.
-
Proske M, Jaeger-Erben M (2019) Decreasing obsolescence with modular smartphones? – An interdisciplinary perspective on lifecycles. J Clean Prod 223: 57-66.
-
Althaf S, Babbitt CW, Chen R (2021) The evolution of consumer electronic waste in the United States. J Ind Ecol 25: 693-706.
-
Bressanelli G, Saccani N, Pigosso DCA, Perona M (2020) Circular Economy in the WEEE industry: a systematic literature review and a research agenda. Sustain Prod Consum 23: 174-188.
-
Bridgens B, Hobson K, Lilley D, Lee J, Scott JL, et al. (2019) Closing the loop on E-waste: a multidisciplinary perspective. J Ind Ecol 23: 169-181.
-
(2019) European Commission. Impact Assessment Study on Common Chargers of Portable Devices.
-
Treffers M (2015) History, current status and future of the wireless power consortium and the Qi interface specification. IEEE Circ Syst Mag 15: 28-31.
-
(2021) European Commission. Directive Proposal 1.
-
Ahmad I, Fernandes BG (2020) Concept of universal USB charger. IEEE Ind Appl Soc Annu Meet IAS: 3-7.
-
De Vries H, Jakobs K, Egyedi T, Eto M, Fertig S, et al. (2018) Standardization: towards an agenda for research. Int J Stand Res 16: 52-59.
-
Egyedi TM, Widlak A (2019) Institutional economics of standards, regulation and innovation effects. EURAS Proc. 2019 Stand. A Bio-Based Econ 143-162.
-
https://www.basel.int/implementation/ewaste/ overview/tabid/4063/default.aspx
-
ewastemonitor.info/wp-content/uploads/2022/06/ Global TBM_webversion_june_2_pages.pdf
-
h t t p s : / / w w w. e p a . g ov / hwg e n e ra to r s / n e w- international-requirements-electrical-and-electronic- waste
-
h t t p s : / / w w w. o e c d . o r g / e n / a b o u t / n e w s / announcements/2024/06/oecd-countries-update- rules-on-international-shipments-of-electronic-waste. html
-
https://www.env.go.jp/en/recycle/basel_conv/Legal_ Framework_in_Japan/pdf/e-waste_criteria.pdf
-
European Parliament (2002) Directive 2002/96/EC of the European Parliament and of the Council of 27 January 2003 on waste electrical and electronic equipment (WEEE).
-
Gutberlet J, Baeder AMM (2008) Informal recycling and occupational health in Santo André, Brazil. International Journal of Environmental Health Research 18: 1-15.
-
DIRECTIVE 2012/19/EU OF THE EUROPEAN PARLIAMENT AND OF THE COUNCIL of 4 July 2012 on waste electrical and electronic equipment (WEEE).
-
Lawhon M, Salehabadi D (2013) Fixing the e-waste problem: An exploration of the sociomateriality of e-waste. In: Khetriwal S, et al. Solving the e-waste problem: An interdisciplinary compilation of international e-waste research. United Nations University Press, Tokyo, Japan.
-
Lewis H (2016) Product stewardship in action: the business case for lifecycle thinking, Greenleaf Publishing, UK.
-
Wang L, Cai K, Song Q, Zeng X, Yuan W, et al. (2025) How effective are WEEE policies in China? A strategy evaluation through a PMC-index model with content analysis. Environmental Impact Assessment Review 110: 107672.
-
Song Q, Zhang Y, Miao Y, Li J (2016) Internet+resource recycling mode promotes the resource recycling revolution in China. Environ Pollut Control 38: 105-109.
-
Li B, Liu D, Zhang L, Wu Y, Ding X, et al. (2024) Challenges of E-Waste Dismantling in China. Toxics 12: 867.
-
Liu T, Zheng Z, Wen Z, Wu S, Liu Y, et al. (2022) Factors Influencing Residents Behavior in Internet Recycling: From the Perspective of the Adoption of New Technology. Int J Environ Res Public Health 19: 6166.
-
Awasthi AK, Li J (2017) Management of electrical and electronic waste: A comparative evaluation of China and India. Renewable and Sustainable Energy Reviews 76: 434-447.
-
https://www.mppcb.mp.gov.in/proc/E-Waste- Management-Rules-2022-English.pdf.
-
Yasuhiko H, Santo A, Tomohiro Tasaki T (2014) EPR- Based electronic home appliance recycling system under home appliance recycling act of Japan. Institute of Global Environmental Strategies 1-29.
-
Hirofumi A, Yoshida H, Sakai S (2008) Current results and future perspectives for Japanese recycling of home electrical appliances. Resources. Conservation and Recycling 52(12): 1399-1410.
-
https://19january2017snapshot.epa.gov/sites/ production/files/2014 08/documents/japan_country_ presentation.pdf.
-
Sugimura Y, Murakami S (2016) Problems in Japan’s governance system related to end-of-life electrical and electronic equipment trade. Resources Conservation and Recycling 112: 93-106.
-
https://www.env.go.jp/en/recycle/asian_net/ Annual_Workshops/2019_PDF/Session2/S2_07_Japan_ ANWS2019.pdf.
-
Lundgren K (2012) The global impact of e-waste: Addressing the challenge. International Labour Organization, Switzerland.
-
https://www.ecycleclearinghouse.org/contentpage. aspx?pageid=10.
-
Forrest L, Denton SJ (2014) Management of electronic waste - Financial responsibility. Compliance and Risks Cork Ireland.
-
(2020) Regulates the implementation of a reverse logistics system for electrical and electronic products and their components for domestic use.
-
Hawks K (2006) What is reverse logistics? Reverse Logist Mag 1(1): 12-15.
-
Santos S, Oladele M, Ogunseitan A (2022) E-waste management in Brazil: Challenges and opportunities of a reverse logistics model. Environmental Technology & Innovation 28: 102671.
-
(2019) Sectoral agreement for reverse logistics of electronics products. agreement
-
Vargas DB, Campos LMDS, Luna MMM (2024) Brazil’s Formal E-Waste Recycling System: From Disposal to Reverse Manufacturing. Sustainability 16: 66.
-
https://www.basel.int/Implementation/Ewaste/ EwasteinNigerandSwaziland/EwasteinAfrica/ Overview/tabid/2546/Default.aspx.
-
Golev A, Schmeda-Lopez D, Smart S, Corder G, McFarland E (2016) Where next on e-waste in Australia? Waste Management 58: 348-358.
-
Hicks C, Dietmar R, Eugster M (2005) The recycling and disposal of electrical and electronic waste in China— legislative and market responses. Environ. Impact Assess Rev 25: 459-471.
-
Nnorom IC, Osibanjo O (2008) Overview of electronic waste (e-waste) management practices and legislations, and their poor applications in the developing countries. Resour Conserv Recycl 52: 843-858.
-
Gu Y, Wu Y, Xu M, Wang H, Zuo T (2016) The stability and profitability of the informal WEEE collector in developing countries: a case study of China. Resour Conserv Recycl 107: 18-26.
-
Davis JM, Garb YA (2015) Model for Partnering with the Informal e-waste Industry: Rationale, Principles and a Case Study. Resour Conserv Recycl 105: 73-83.
-
Ghosh SK, Debnath B, Baidya R, De D, Li J, et al. (2016) Waste electrical and electronic equipment management and Basel Convention compliance in Brazil, Russia, India, China and South Africa (BRICS) Nations. Waste Management & Research 34: 693-707.
-
Tong X, Wang JC (2004) Transnational flows of e-waste and spatial patterns of recycling in China. Eurasian Geogr Econ 45: 608-621.
-
Wang F, Kuehr R, Ahlquist D, Li J (2013) E-waste in China: a country report. United Nations University/StEP Initiative.
-
Chi X, Streicher-Porte M, Wang MYL, Reuter MA (2011) Informal electronic waste recycling: a sector review with special focus on China. Waste Manag 31: 731-742.
-
Song X, Wang J, Yang J, Lu B (2017) An updated review and conceptual model for optimizing WEEE management in China from a life cycle perspective. Front Env Sci Eng 11: 3.
-
Zeng X, Li J, Stevels, ALN, Liu L (2013) Perspective of electronic waste management in China based on a legislation comparison between China and the EU. J Clean Prod 51: 80-87.
-
Cayumil R, Khanna R, Konyukhov Y, Burmistrov I, Kargin JB, et al. (2021) An overview on solid waste generation and management: current status in Chile. Sustainability 13(21): 11644.
-
Kirby PW, Lora-Wainwright A (2015) Peering through loopholes, tracing conversions: remapping the transborder trade in electronic waste. Area 47: 4-6.
-
Schneider AF, Zeng X (2022) Investigations into the transition toward an established e-waste management system in China: Empirical evidence from Guangdong and Shaanxi, Current Research in Environmental Sustainability 4: 100195.
-
MEESCC (2021) Integrated Environmental Management of E-Waste in China (2012- 2021). Solid Waste and Chemicals Management Centre of Ministry of Ecology and Environment of China, Beijing, China.
-
Tong X, Tao D (2016) The rise and fall of a waste city in the construction of an urban circular economic system: the changing landscape of waste in Beijing. Resour Conserv Recycl 107: 10-17.
-
Akenji L, Hotta Y, Bengtsson M, Hayashi S (2011) EPR policies for electronics in developing Asia: an adapted phase-in approach. Waste Manage Res 29: 919-930.
-
Bhardwaj SR (2016) International workshop on extended producer responsibility in India: Opportunities, challenges and lessons from international experience, Ministry of Environment, Forest and Climate Change, Government of India.
-
Borthakur A, Govind M (2018) Public understandings of e-waste and its disposal in urban India: From a review towards a conceptual framework. J Clean Prod 172: 1053-1066.
-
Sengupta D, Ilankoon IMSK, Kang KD, Chong MN (2022) Circular economy and household e-waste management in India: Integration of formal and informal sectors. Miner Eng 184: 107661.
-
Dutta D, Goel S (2021) Understanding the gap between formal and informal e-waste recycling facilities in India. Waste Manag 125: 163-171.
-
Koshta N, Patra S, Singh SP (2021) Estimation of E-waste at micro level for reverse logistics: A case of Delhi J Clean Prod 314: 128063.
-
Dias P, Palomero J, Cenci MP, Scarazzato T, Bernardes AM (2022) Electronic waste in Brazil: Generation, collection, recycling and the covid pandemic. Cleaner Waste Sys 3: 100022.
-
Brazilian Electrical and Electronics Industry Association A (2020) Economic overview and performance of the sector.
-
Guarnieri P, Silva LC, Levino NA (2016) Analysis of electronic waste reverse logistics decisions using strategic options development analysis methodology: A Brazilian case. J Clean Prod 133: 1105-1117.
-
Schneider AF, Aanestad M, Carvalho TC (2024) Exploring barriers in the transition toward an established e-waste management system in Brazil: a multiple-case study of the formal sector. Environ Dev Sustain.
-
(2025) E-Waste management.
-
(2025) E-Waste management.
-
(2025) WEEE recycling.
-
https://saahaszerowaste.com/e-waste-management- recycling-services.
-
(2025) Namo Ewaste Management Limited.
-
https://www.msmeonline.in/ads/e-parisaraa-pvt- ltd.
-
Wang R, Deng Y, Li S, Yu K, Liu Y, et al. (2021) Waste Electrical and Electronic Equipment Reutilization in China. Sustainability 13: 11433.
-
Ni HG, Zeng EY (2009) Law enforcement and global collaboration are the keys to containing e-waste tsunami in China. Environ Sci Technol 43 (11): 3991-3994.
-
Wen Z (2018) Recovery of key metals in the electronics industry in the People’s Republic of China: an opportunity in circularity. In World economic forum. Geneva, Switzerland.
-
Chi X, Streicher-Porte M, Mark YL, Wang M, Reuter A (2011) Informal electronic waste recycling: A sector review with special focus on China. Waste Manag 31(4): 731-742.
-
(2019) MAIT-GTZ, Study Reveals Extent of E-waste Challenge, Press Release
-
Wang F, Kuehr R, Ahlquist D, Li J (2013) E-waste in China: a country report. United Nations.
-
Sinha-Khetriwal D, Philipp K, Schwaninger M (2005) A comparison of electronic waste recycling in Switzerland and in India. Environ Impact Assess Rev 25: 492-504.
-
Khanna R, Mukherjee PS, Park M (2020) A critical assessment on resource recovery from electronic waste: Impact of mechanical pre-treatment. J Clean Prod 268: 122319.
-
Khanna R, Saini R, Park M, Ellamparuthy G, Biswal SK, et al. (2020) Factors influencing the release of potentially toxic elements (PTEs) during thermal processing of electronic waste. Waste Manag 105: 414- 424.
-
Lodhia S, Martin N, Rice J (2017) Extended Producer Responsibility for waste televisions and computers: A regulatory evaluation of the Australian experience. J Clean Prod 164: 927-938.
-
Fu J, Zhang H, Zhang A, Jiang G (2018) E-waste Recycling in China: A Challenging Field. Environ Sci Techno 52 (12): 6727-6728.
-
https://www.startus-insights.com/innovators- guide/electronics-manufacturing-trends.
- Some Challenging Transdisciplinary Aspects of the Sustainable Waste Management in the Permacrisis Context
- Use of Mobile Autonomous Systems for Pollution Control of Inland Water Bodies
- Environmental Impact Perspective Sustainable Online Textile Retailing: Harnessing Augmented Reality-Based Digital Twins in Bangladesh
- Composite Treatment Module for Removing Acidity and Metal (Loid)S from Acid Rock Drainage
- Household E-Waste Management Systems [E-Wms] in Malaysia
- Biodiversity and Conservation Challenges in the Forests of Mudug and Galgaduud Regions, Somalia: A Mini Review