Atmospheric-Electrical Control of Oil Reservoir Development
A model representation of hydrogen, methane and atmospheric electric field bonds is provided. Sensitivity of atmospheric electric field to density variations of the subvertical methane flux is calculated. Field observations of atmospheric electric field above the oil deposit are provided.
Introduction
According to the theory of surface atmospheric electricity, the main ionizer of the surface air is the exhaled soil radon lifted out from a depth of 4–6m. High molecular weight of this radioactive gas is 222 and eliminates any possibility of its separate subvertical migration into near-surface soil layers and the surface atmosphere [1, 2, 3]. Traditionally, all volatile gases of the soil air are believed to be radon carriers to near-surface soil layers and the atmosphere [4, 5, 6]. However, recent experiments demonstrate that radon is transferred exclusively by bubbles of two volatile gases – hydrogen and methane [7, 8, 9]. The presence of radon in the Earth's crust will be determined by the parent matter distribution. According to Academician V.I. Vernadsky Biogeochemical Laboratory, the content of radon in soils is only an order of magnitude lower than in the rock. In clay, in particular, the average content of radon is 1.3*10-10% that is only a half as much as in granites, 2.58*10-10% [10].
The data obtained allows for developing a model of hydrogen-methane-radon and atmospheric-electrical bonding of the Earth and atmosphere fields. The subvertical hydrogen and methane flow captures radon at a depth of 4–6 meters and lifts it to near-surface soil layers and the surface atmosphere [8, 9]. Lightweight ions formed by the ionization process determine polar conductivities of the air; their recombination with neutral condensation nuclei sets the Atmospheric Electric Field (AEF). Negative charge of the Earth provides an electrode effect. With an ionizer deficiency, the classical electrode effect takes place representing a smooth field decrease coming to the normal background level; in the case of excessive ionizer amount, a reversible electrode effect is observed running through the field decrease, a change and subsequent increase to the background level [9, 11]. The recent results and experiments demonstrate that the most contrasting variations in AEF resulting from changes in the soil radon exhalation mode are observed at a height of initial decimeters to 2–3 m. This was considered in all observation cycles described. Let's make a rough illustrative assessment of the sensitivity of surface atmospheric electricity elements to the soil radon exhalation mode. The radon content in the soil is, at least, by 2 orders of magnitude higher than in the atmosphere [12, 13]. In the framework of the model under consideration, this means that the elements of surface atmospheric electricity are extremely sensitive to the subvertical hydrogen and methane flow density. Let us assess AEF sensitivity to density variations in subvertical flows of carrier gases.
Atmospheric Electric Field Sensitivity to Density Variations of Subvertical Hydrogen and Methane Flow
In 2001, at the North-Stavropol gas storage facility, emergency gas seepage occurred. In the emergency zone, an unloading well was drilled. The jury of opinion of Kavkaztransgaz discovered a probable north-western direction of methane supply to the discharge well. On this probable line of gas supply, an annular profile was constructed. At 8 pickets of this profile, AEF was observed and soil air was sampled for hydrogen and methane lab analysis. It turned out that the hydrogen content is, on average, 50-fold lower than the methane content. Figure 1 shows methane concentration in the soil (laboratory analysis) and AEF (the result of averaging after two consecutive passes of the annular profile).
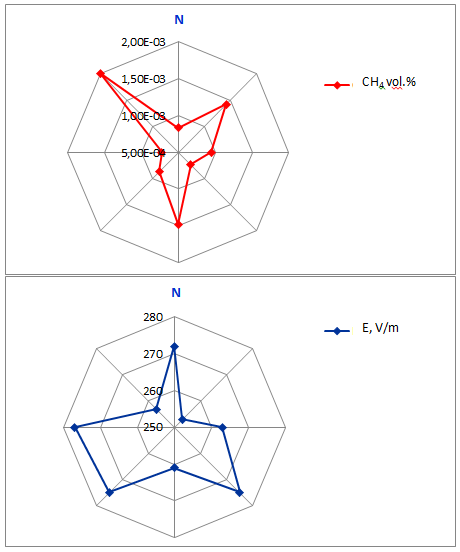
Figure 1: Variations of soil methane and AEF concentrations at the annular profile. At the annular profile, opposite-phase AEF variations readily reproduce changes of methane concentration in the soil k (CH4; E) = -0.83. The high level of correlation between methane and AEF allows for a statement that in the investigated area, the ionizer is mainly transferred by bubbles of combustible gas formed; hydrogen participation in this transfer is minimal. Methane concentration gradients cause the major effect on the field variations. Figure 2 shows observation data for methane and AEF and their power approximation.
![Figure 2: AEF and methane concentration observation data at the annular profile and their power approximation. AEF is set by the function E = 152.33CH4-0.082 [V/m] with confidence D = 0.78; the value of CH4 is normalized by 1 vol %. The field derivative by methane concentration will be presented as dE/dCH4 = - 12.49CH4-1.082 [V/m/(vol.%)]. Practices of multiple AEF observations shows that for online readings taken at any observation picket, the spread in field variations falls within 0.5 to 1.0V/m; the reasons for the spread are purely meteorological, primarily, changes in the wind load. Therefore, a change in AEF, $$](/fulltextimages/1377/fig_2.png)
Figure 2: AEF and methane concentration observation data at the annular profile and their power approximation. AEF is set by the function E = 152.33CH4-0.082 [V/m] with confidence D = 0.78; the value of CH4 is normalized by 1 vol %. The field derivative by methane concentration will be presented as dE/dCH4 = - 12.49CH4-1.082 [V/m/(vol.%)]. Practices of multiple AEF observations shows that for online readings taken at any observation picket, the spread in field variations falls within 0.5 to 1.0V/m; the reasons for the spread are purely meteorological, primarily, changes in the wind load. Therefore, a change in AEF, $$ \mathrm {E} = \mathrm {E} _ {1} + \mathrm {E} _ {2} + \dots + \mathrm {E} _ {n} $$ E = 2V/m, was taken for the field threshold which was readily fixed exclusively due to variations in the carrier gas density. Calculations using the derivative obtained for mean values of the methane concentration at the profile studied, lead to changes in the methane concentration, $$ \mathrm {E} = \mathrm {E} _ {1} + \mathrm {E} _ {2} + \dots + \mathrm {E} _ {n} $$ CH4 = 9.02*10-5 vol.%, which is 8% of the average methane concentration at 8 pickets on the annular profile with the field change by the threshold value of $$ \mathrm {E} = \frac {1}{2} \mathrm {A} ^ {2} + \mathrm {B} ^ {2} $$ E = 2.0V/m. At comparable volatile carrier gases concentrations for the ionizer at a level of 10-5vol.% (the ratio H2/CH4 = 0.95), similar calculations give values of 2.6% of the average hydrogen content and 18% of the average methane content that change the field by E = 2.0V/m. As follows from the estimates obtained, the degree of hydrogen involvement in the transfer is 6.9 times greater than that of methane. For relatively high average methane concentrations, CH4 = 0.0103vol. %, the threshold AEF
change is achieved with combustible gas variations of about 1.2% and 8.4% for hydrogen, H2 = 0.00217 vol.%; the ratio of H2/CH4 = 0.21. These estimates allow for a statement that an increase in contamination of near- surface soil layers by methane will significantly increase AEF sensitivity to variations in combustible gas concentrations. Let us illustrate possible uses of profile AEF observations for the purpose of monitoring oil field development.
Atmospheric-Electrical Monitoring of Oil Fields
The field of methane concentrations in the troposphere is affected by the oil and gas content of the subsoil. For example, CH4 content in the troposphere above oil and gas structures in Bukhara-Chardzhou tectonic stage is 1.2-1.5 times higher than its mean planetary content [14, 15]. The field survey has demonstrated that combustible gas concentration in the near-surface soil layer increases within the projection of the oil deposit onto the Earth surface, Figure 3. For this purpose, soil air was sampled for subsequent laboratory analysis for methane content. The experiment has shown that the soil methane concentration can be increased by injecting vibroseismic radiation into the medium, using standard seismic sources of SV 20/60 or SV 10/100 type. The ratio of mean methane concentrations above the reservoir and the host rocks in the background sampling mode is about 1.7; and in the presence of vibration about 2.8.
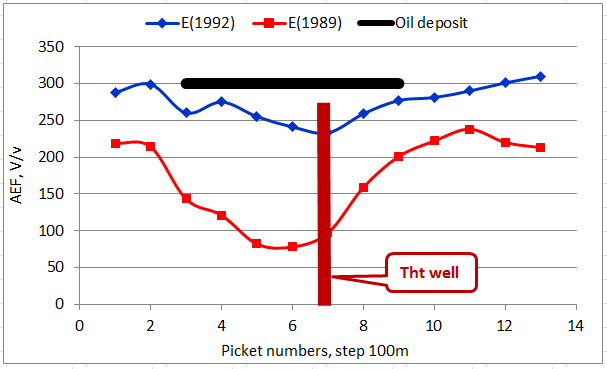
Figure 3: Soil methane content in the background and in the presence of vibration effect. According to the introduced model concepts, the excess supply of methane to the atmosphere observed over the oil deposit, shall inevitably affect the changes in elements of surface atmospheric electricity – the reverse electrode effect. The initial results of profile AEF observations were obtained across the 3rd Rechitsa oil field, Belarus. The measurements were carried out twice: in summer 1989 first, in the vicinity of the well just put into operation, and then in 1992, after 3 years of well operation – Figure 4. As might be expected, in three years the AEF decline above the deposit has significantly decreased as a result of lowering the pore pressure during operation, flooding the reservoir or reducing the density of the plume of hydrocarbons. Special attention should be paid to the trend of field increase at the picket #4. The result observed allows a consideration of possible cutting off of an area beneath the picket #3 from the main deposit. Soil radon is the intermediate link between methane plume of the oil deposit and AEF. Bubbles of the carrier gas both lift the ionizer out to the atmosphere and cause an increase in the radon content in near-surface soil layers. Let us consider the results of simultaneous observations of the volumetric activity of soil radon and AEF obtained at the Aleksandrovskoye oil field in Belarus, Figure 4.
![Figure 4: Variations in the atmospheric electric field and volumetric activity of soil radon above the Aleksandrovskaya oil deposit, Belarus. The investigated area was not very suitable for setting up measurements: on the one hand, it included numerous scattered islets of bushes and trees capable of shielding the field; on the other hand, small water-logged areas were observed, where biogenic methane might be present. Nevertheless, on the studied site 29 observation pickets with a pitch of 50-100 m were located. As shown on plots, in the zone of pickets 2-8 the surveyed profile crosses the oil deposit that is indicated by low field values due to high content of spoil radon transferred by the oil plume methane. The arrays of observation data were divided into two parts – above the deposit and outside the deposit, and linear AEF approximations were developed as functions of volumetric activity of soil radon. With the confidence of about 0.8, these approximations can be presented as follows: E(Rn)2-8 = 553.3 - 119.2*Rn and E(Rn)1.9-29 = 377.4 - 55.2*Rn – Figure 4. Numerical factors have the dimension of V/m; values of volumetric activity of the soil radon are normalized by 1Bq/l. It is obvious that AEF values at each picket will depend on the soil radon concentration multiplied by the sum of concentrations of carrier gases. The plot in Figure 4 shows that the mean volumetric activity of the soil radon outside the deposit is Rn(mean)1.9-29 = (2.74 +/- 0.20)Bq/l; the free term has the dimension of [Bq/l]. Volumetric activity of the soil radon above the oil deposit increases as the oil plume methane participates in transfer of the ionizer. The increase of the oil plume methane contribution into this process can be roughly estimated from the ratio of the free terms of the approximations introduced (~1.5). The ratio obtained is comparable with the results of similar estimate performed on the basis of background methane measurements presented in Figure 3. The results of the field observations shown in Figures 2-4 completely fit the framework of model representations of relationships between gas and electric fields of the Earth and the atmosphere. However, there are examples of AEF bursts above the oil deposit in the literature: variations in the atmospheric electric field recorded during research in the area of the Karsak structure, the Guryev arch, and Western Kazakhstan Figure 5 [16]. In the north-east part of the area, a positive AEF anomaly has been detected; it has the south-east extent and two distinct peaks of about 250V/m. According to drilling results, industrial oil reserves were found here.](/fulltextimages/1377/fig_4.png)
Figure 4: Variations in the atmospheric electric field and volumetric activity of soil radon above the Aleksandrovskaya oil deposit, Belarus. The investigated area was not very suitable for setting up measurements: on the one hand, it included numerous scattered islets of bushes and trees capable of shielding the field; on the other hand, small water-logged areas were observed, where biogenic methane might be present. Nevertheless, on the studied site 29 observation pickets with a pitch of 50-100 m were located. As shown on plots, in the zone of pickets 2-8 the surveyed profile crosses the oil deposit that is indicated by low field values due to high content of spoil radon transferred by the oil plume methane. The arrays of observation data were divided into two parts – above the deposit and outside the deposit, and linear AEF approximations were developed as functions of volumetric activity of soil radon. With the confidence of about 0.8, these approximations can be presented as follows: E(Rn)2-8 = 553.3 - 119.2*Rn and E(Rn)1.9-29 = 377.4 - 55.2*Rn – Figure 4. Numerical factors have the dimension of V/m; values of volumetric activity of the soil radon are normalized by 1Bq/l. It is obvious that AEF values at each picket will depend on the soil radon concentration multiplied by the sum of concentrations of carrier gases. The plot in Figure 4 shows that the mean volumetric activity of the soil radon outside the deposit is Rn(mean)1.9-29 = (2.74 +/- 0.20)Bq/l; the free term has the dimension of [Bq/l]. Volumetric activity of the soil radon above the oil deposit increases as the oil plume methane participates in transfer of the ionizer. The increase of the oil plume methane contribution into this process can be roughly estimated from the ratio of the free terms of the approximations introduced (~1.5). The ratio obtained is comparable with the results of similar estimate performed on the basis of background methane measurements presented in Figure 3. The results of the field observations shown in Figures 2-4 completely fit the framework of model representations of relationships between gas and electric fields of the Earth and the atmosphere. However, there are examples of AEF bursts above the oil deposit in the literature: variations in the atmospheric electric field recorded during research in the area of the Karsak structure, the Guryev arch, and Western Kazakhstan Figure 5 [16]. In the north-east part of the area, a positive AEF anomaly has been detected; it has the south-east extent and two distinct peaks of about 250V/m. According to drilling results, industrial oil reserves were found here.
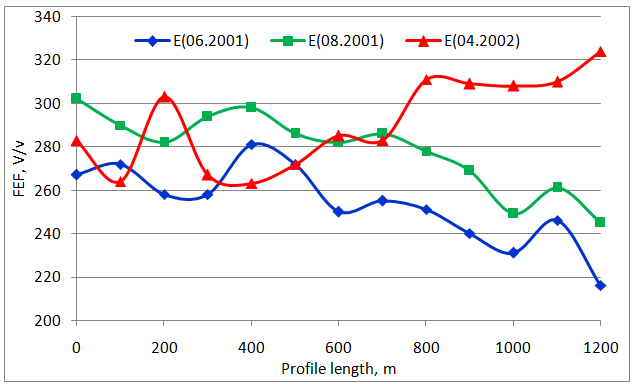
![Figure 5: AEF isolines in the area of the Satybaldy-Karsak structure, the Guryev arch, Western Kazakhstan. Positive field anomaly of about 250V/m in the NE part above the productive oil deposit; negative field anomaly of about (- 110) V/m in the SW part. However, in the southwest part on the same site another AEF anomaly (negative of an irregular shape) was detected. Its value at the minimum reaches (-110) V/m. According to the exploration results, this area is recognized as unproductive with respect to industrial oil reserves - reservoir-reservoirs are saturated with mineralized water. Satybaldy-Karsak structural element is located in the northwest of the Karsak salt-dome structure, which overlies the oil deposit [17]. According to electrical prospecting and drilling, the salt dome area is significantly larger than the total area of all identified oil strata. Pressure-tight salt dome prevents deep subvertical flow of volatile gases and plumes of the oil deposit from moving to the Earth's surface. Volatile gases are accumulated under the dome, and then their subvertical discharge by the dome perimeter happens. This is that leads to negative AEF values in the southwest of the studied area. In this case, lifting of the hydrogen and plume methane flow out to the atmosphere is regulated by the salt dome rather than by the oil deposit cover. Figure 6 shows results of the AEF-profiling above the zone of emergency petroleum product spill that has entered temporary perched water. During the scouring activities, the AEF level increases reaching its maximum on 04.2002.By this time, petroleum product residues remain at marks 100m and 300-700m.The presence of petroleum products increased methane concentration in the near-surface soil layers that led to an increase in soil radon exhalation, i.e. recorded AEF decline.](/fulltextimages/1377/fig_5.jpeg)
Figure 5: AEF isolines in the area of the Satybaldy-Karsak structure, the Guryev arch, Western Kazakhstan. Positive field anomaly of about 250V/m in the NE part above the productive oil deposit; negative field anomaly of about (- 110) V/m in the SW part. However, in the southwest part on the same site another AEF anomaly (negative of an irregular shape) was detected. Its value at the minimum reaches (-110) V/m. According to the exploration results, this area is recognized as unproductive with respect to industrial oil reserves - reservoir-reservoirs are saturated with mineralized water. Satybaldy-Karsak structural element is located in the northwest of the Karsak salt-dome structure, which overlies the oil deposit [17]. According to electrical prospecting and drilling, the salt dome area is significantly larger than the total area of all identified oil strata. Pressure-tight salt dome prevents deep subvertical flow of volatile gases and plumes of the oil deposit from moving to the Earth's surface. Volatile gases are accumulated under the dome, and then their subvertical discharge by the dome perimeter happens. This is that leads to negative AEF values in the southwest of the studied area. In this case, lifting of the hydrogen and plume methane flow out to the atmosphere is regulated by the salt dome rather than by the oil deposit cover. Figure 6 shows results of the AEF-profiling above the zone of emergency petroleum product spill that has entered temporary perched water. During the scouring activities, the AEF level increases reaching its maximum on 04.2002.By this time, petroleum product residues remain at marks 100m and 300-700m.The presence of petroleum products increased methane concentration in the near-surface soil layers that led to an increase in soil radon exhalation, i.e. recorded AEF decline.
We propose this method for practical use as a simple and high-performance technique of monitoring for petroleum products spreading over near-surface soil layers basing on AEF variations.
Conclusion
A model representation of relationships between the gas characteristics of soil air and elements of surface atmospheric electricity is provided. Bubbles of hydrogen and methane act as carrier gases for radon lifting it out to near-surface soil layers and the surface atmosphere. Exhaled soil radon is the only ionizer of the atmospheric air; lightweight ions formed during ionization define polar conductivities of the atmospheric air; their recombination with neutral condensation nuclei leads to formation of heavy ions, which are mostly responsible for existence of the atmospheric electric field. Field observations analysis allows for asserting that an increase in subvertical methane flow density above the oil deposit leads to additional exhalation of the ionizer that inevitably causes a decline of the atmospheric electric field. Laboratory studies of soil air sampled above oil fields showed the presence of excessive methane – the presence of a low subvertical methane flow above the deposit. The ratio of the average methane concentrations above the deposit and above the host rocks is about 1.7; in the presence of vibroseismic excitation, methane concentrations increase and their ratio raises to about 2.8. Changes in the atmospheric electric field by $$ \mathrm {E} = \mathrm {E} _ {1} + \mathrm {E} _ {2} + \dots + \mathrm {E} _ {n} $$ E = 2V/m will be achieved with the change in the subvertical carrier gas flow density by 1.0-1.5% already at soil methane concentrations of about (10-3–10-2) vol. %. In accordance with the model representation developed, the excessive content of soil methane should inevitably affect measurements of AEF and volumetric activity of the soil radon. The profile measurements of the field and radon above the Aleksandrovsk oil deposit (Belarus) and the 3rd Rechitsa oilfield (Belarus) provide a confident proof for the above assumption. Profile observations of the atmospheric electric field can successfully be used for mapping of emergency petroleum products spill.
References
-
Baranov VI (1956) Radiometriya. Moscow: Publishing house of the Academy of Sciences of the USSR, pp: 343.
-
Tverskoi PN (1951) The Course of Meteorology. Leningrad: Gidrometeoizdat pp: 887.
-
Frenkel Ya I (2009) Theory of Phenomena of Atmospheric Electricity. Moscow: LIBROKOM Book House pp: 152.
-
Voitov GI, Rudakov VP, Shuleikin VN, Kozlova NS, Baranova LV (1999) Emanation and electrical effects in the subsoils atmosphere above Kaluga impact ring structure. Russian Journal of Earth Sciences. 1: 503- 510.
-
Voitov GI, Gusev AS, Shuleikin VN (2000) Emanation (hydrogen-radon) and electrical effects over complexly built tectonic structures (on the example of the Aleksandrov zone of pre-breaking uplifts, Belarus). Reports of Russian Academy of Sciences, 370: 105-108.
-
Gergedava K, Buzinov SN, Shuleikin VN, Voitov GI (2001) Unconventional geophysics for underground gas storages. Oil gas and business 43: 2-7.
-
Zubarev AP, Shuleikin VN (2009) Complex geophysical and geochemical control in the operation of underground gas storage facilities. Moscow: Publishing Hous, pp: 264.
-
Shuleikin VN (2013) Radon transfer to near-surface soil layers and surface atmosphere. Geophysical processes and the biosphere 12: 57-66.
-
Shuleikin VN, Shchukin GG, Kupovykh GV (2015) Development of methods and means of applied geophysics - atmospheric-electrical monitoring of geological heterogeneities and zones of geodynamic processes. Petersburg: Publishing House of the Russian State Hydrometeorological University, pp: 205.
-
Koshkin NI, Shirkevich MG (1976) Handbook of elementary physics. Moscow: Nauka pp: 255.
-
Redin AA (2011) Mathematical modeling of electrodynamic processes in the surface layer under the conditions of aerosol pollution of the atmosphere. Taganrog: PhD Thesis pp: 19
-
Sisigina TI (1962) Measurements of radon exhalation from the surface of rocks. Moscow: Gosatomizdat pp: 104-111.
-
Sisigina TI (1965) Exhalation of radon from the surface of several types of soils in the European part of the USSR and Kazakhstan. Moscow: Atomizdat pp: 40-48.
-
Ammosov SM, Voitov GI, Korobeinik GS, Kuznetsov VV, Nikolaev AV, et al. (1988) On Two Types of Gas- Geochemical Effects in the Field of the Vibration Source of Seismic Oscillations. Reports of the Academy of Sciences of the USSR, 301: 62-68.
-
Voitov GI, Starobinets IS, Usmanov RI (1990) On the density of CH4 fluxes to the atmosphere in oil and gas regions (on the example of the Amu-Darya Basin). Reports of the Academy of Sciences USSR, 313: 1444- 1448.
-
Shirokov BI (2011) Atmospheric electricity and hydrocarbon deposits. Proceedings of the 10th International Conference on Geoinformatics. Ukraine Kiev, S147.
-
Levashov SP, Yakimchuk NA, Korchagin IN, Taskinbaev KM (2004) Geoelectric studies of oil- bearing suprasalt and sub-salt deposits of Karsak dome structure (Western Kazakhstan). Ukraine: Geoinformatics pp: 28-32.
- Nigeria’s Vulnerability in the Face of Global Energy Policy
- A Simulation Study of Investigation of Optimum Oil Production Performance by Applying Various Gas Injection Methods in Oil Reservoir
- Characterization of Permo-Triassic Reservoirs through Thermal Maturity Assessment of Westphalian Source Rocks in the Cheshire Basin
- Influence of Microwax on the Rheological and Thermal Behaviour of a Wax Crude Oil
- Real-Time Monitoring and Performance Optimization of Steam Injection in Heavy Oil Reservoirs Using Fiber Optic Sensing and Integrated Predictive Simulation Models
- Rapid On-Site Determination of the Total Petroleum Hydrocarbon Content of Soils by Handheld Fourier Transform Near-Infrared Spectroscopy: Development of a Global, Site- and Scanner- Independent Calibration Model