Significant Influence of Sand Production on the Well's Drainage Area
The exploration of unconventional oil and gas reservoirs is a prominent global trend today. Achieving cost-effective and efficient hydrocarbon production from these reservoirs necessitates advanced technologies. One such technology that has been employed in the oil and gas industry for many decades is hydraulic fracturing. It is used to create highly conductive channels within formations characterized by extremely low permeability values. The successful implementation of hydraulic fracturing hinges on the development of an effective fracturing design. This design is crucial to achieving the anticipated production outcomes from unconventional reservoirs, including tight gas, shale gas, coal bed methane, and reservoirs with very low permeability. Key parameters for the success of hydraulic fracturing operations include the determination of the optimal fracturing rate, fracture height, and the selection of propping agents. These factors collectively contribute to the efficiency and productivity of hydraulic fracturing activities in unconventional reservoirs.
Introduction
Formation damage refers to the phenomenon in which the permeability of the subsurface formation near the wellbore decreases. There are various factors that can lead to formation damage, which will be explored later. The decrease in permeability in the wellbore region has a direct impact on the overall productivity of the well. This reduction is often attributed to the blocking of pore throats in the vicinity of the wellbore, causing a decrease in the available flow area [1]. Turbulent flow in the well is another factor contributing to the reduction in the flow area. When turbulent flow occurs, it leads to a significant pressure drop in comparison to laminar or Darcy flow. The pressure drop associated with turbulent flow is notably higher, which results in a further reduction in wellbore permeability. This complex interplay of factors underscores the importance of understanding and managing formation damage in well operations [2].
The Skin Factor
The skin factor is a crucial measure of the impact of formation damage on well performance. Formation damage typically results in a reduction in permeability around the wellbore. The accompanying figure illustrates the ideal pressure profile of a well, highlighting the influence of formation damage (represented by the yellow line) on creating an additional pressure drop [3].
The skin factor (s) can take on various values, and its interpretation is as follows:
- Positive skin factor, s > 0: When a damaged zone near the wellbore leads to a reduced permeability (k_skin) compared to the formation’s original permeability (k), the skin factor is positive. The magnitude of the skin factor increases as the damaged zone’s permeability (k_ skin) decreases and as the depth of the damage (r_skin) increases [4].
- Negative skin factor, s < 0: When the permeability around the well (k_skin) is higher than that of the formation (k), a negative skin factor is indicated. This negative skin factor suggests an improved wellbore condition, often associated with measures to enhance permeability near the well [5].
- Zero skin factor, s = 0: A skin factor of zero signifies that no alteration in permeability around the wellbore is observed, implying that k_skin equals the formation’s original permeability (k).
The skin factor is a valuable metric for evaluating the influence of formation damage on well performance and is a critical parameter in wellbore management and optimization.
[equation]
(1) H: formation height q0: oil flow rate
0 µ : oil viscosity Sd: formation damage skin K0: formation permeability to oil kd: damaged permeability to oil : extra pressure drop due to formation damage [equation]
Formation damage skin is directly related to the ratio of the original permeability to the damaged permeability. As this ratio increases, the skin factor also increases, signifying greater formation damage [6]. Stimulation in the context of oil wells refers to a set of operations carried out to optimize productivity. This technique is of paramount importance in the production process, as it encourages the flow of hydrocarbons from the reservoir rocks to the wellbore, given that the hydrocarbons are situated within the pores of the reservoir rock [7]. Stimulation also encompasses methods aimed at improving the natural permeability of undisturbed rock formations housing the reservoir, making it economically viable for oil production. Permeability is the rock’s ability to conduct fluids, including oil and water. Stimulation technologies can be applied to increase the reservoir’s permeability to a level that allows for enhanced oil production rates [8].
One of the well stimulation techniques is hydraulic fracturing, which is employed to boost well productivity. In hydraulic fracturing, a fracturing fluid or pumping fluid, typically composed of a mixture of water and sand, is injected into the formation under high pressure [9]. This article delves into the influence of hydraulic fracturing on well productivity, with reference to a real well example using the Prosper model. The project explores how oil and gas production behavior is affected in various scenarios, including the base case, a 30-degree deviation angle, and a 45-degree deviation angle. Furthermore, the study investigates how different parameters, such as tubing diameters and skin factor, impact oil and gas production, aiming to determine the optimal well production rates. In practice, the well in question is somewhat deviated, and the study conducts a sensitivity analysis to identify optimal parameters for future wells and to assess production outcomes under different trajectories [10].
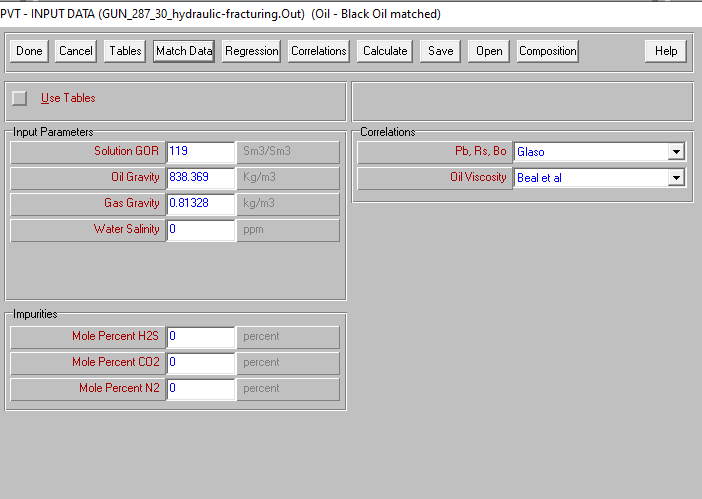
PVT Parameters are as Following in this Well
Solution GOR: The term “Solution GOR” typically refers to the Gas-Oil Ratio within a solution, often used in the context of the oil and gas industry. The Gas-Oil Ratio (GOR) represents the volume of gas produced relative to the volume of oil in a given solution, typically measured in standard cubic feet of gas per barrel of oil (scf/bbl) or in similar volumetric units. It is a crucial parameter in reservoir engineering and production analysis, providing insights into the composition of fluids extracted from subsurface reservoirs [11]. In the oil and gas industry, Solution GOR helps assess the gas-to- oil ratio over the course of production, offering valuable information about the reservoir’s behavior and the efficiency of the extraction process. Monitoring changes in Solution GOR over time can aid in optimizing production strategies and maximizing resource recovery [12].
Oil Gravity: Oil gravity, in the context of the oil and gas industry, refers to the specific gravity or density of crude oil. It is a fundamental property that characterizes the relative weight of a given volume of oil compared to an equivalent volume of water. The American Petroleum Institute (API) gravity scale is commonly used to express the gravity of crude oil. The API gravity scale is an inverse measure, where higher API gravity values indicate lighter and, often, more valuable crude oils. Lighter oils have a lower density and flow more easily than heavier oils. Where specific gravity is the ratio of the density of the oil to the density of water. Crude oils with API gravity greater than 10 are generally considered light, while those below 10 are considered heavy [13]. Understanding the oil gravity of a particular crude oil is crucial in the oil and gas industry for various purposes, including refining processes, transportation, and determining the market value of the oil. Lighter oils are often preferred for their higher yields of valuable products like gasoline, while heavier oils may contain more complex hydrocarbons and require additional processing.
Gas gravity, in the context of the oil and gas industry, refers to the specific gravity of a gas. It is a measure of the relative density of a gas compared to air or another reference gas. Gas gravity is a crucial parameter in the analysis and characterization of natural gas [14].
Gas Gravity: The specific gravity of a gas is typically expressed as the ratio of the density of the gas to the density of air. It is often compared to the specific gravity of air, which is 1. If the gas gravity is less than 1, the gas is lighter than air; if it is greater than 1, the gas is heavier than air. Understanding the gas gravity is important in various aspects of the oil and gas industry, including the design and operation of processing facilities, transportation, and determining the composition of natural gas. The composition of natural gas, including the presence of different hydrocarbons and non- hydrocarbon components, can influence its specific gravity. This information is valuable for optimizing production and processing operations (Figure 1) [15].
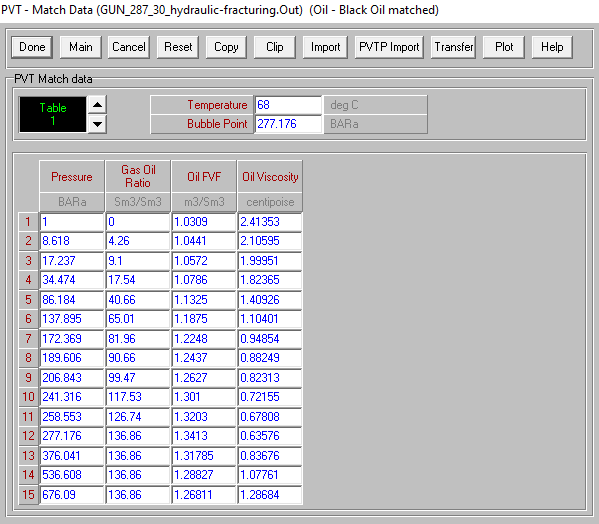
The initial reservoir conditions for this well include a reservoir pressure of 350 bar and a reservoir temperature of 68°C (Figure 2).
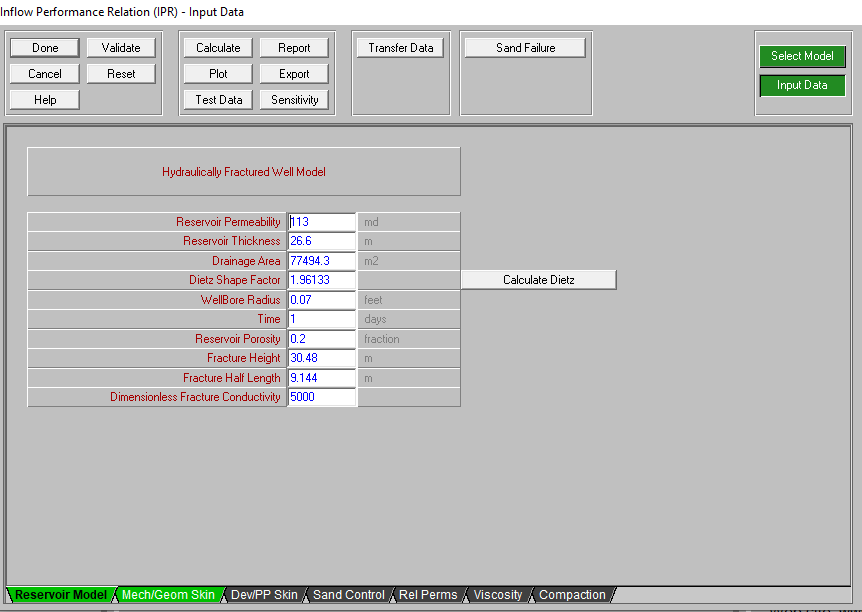
To enhance the permeability around the wellbore, hydraulic fracturing has been employed. The following are the relevant reservoir and technical parameters for the hydraulic fracturing operation (Figure 3).
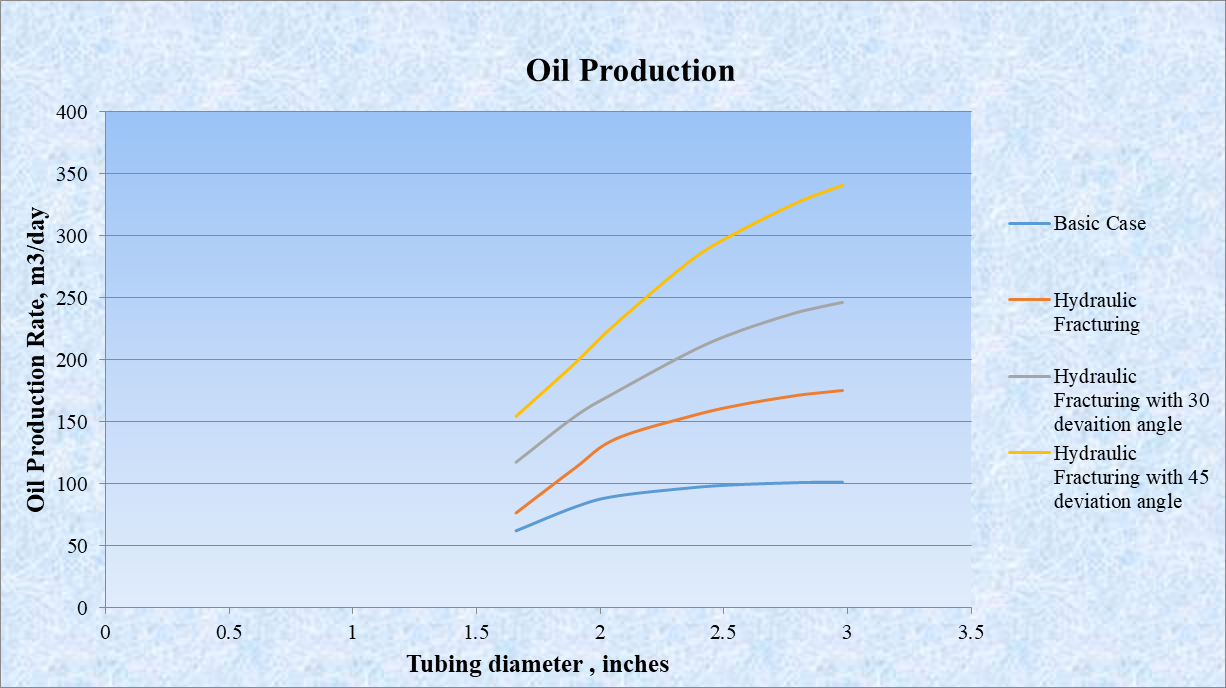
Different tubing diameters can significantly impact the rate at which oil is produced from a well. This variation is a critical consideration in well optimization and reservoir management. It demonstrates that when a tubing diameter of 2.98 inches is selected, the daily oil production rate significantly increases to 340.8 cubic meters per day (m3/ day) when employing the hydraulic fracturing method in the case of a 45-degree deviation angle. In contrast, the base case yielded a daily oil production rate of 101.4 m3/day. This comparison highlights the substantial improvement in oil production achieved through hydraulic fracturing with the specified tubing diameter under the given conditions (Figure 4).
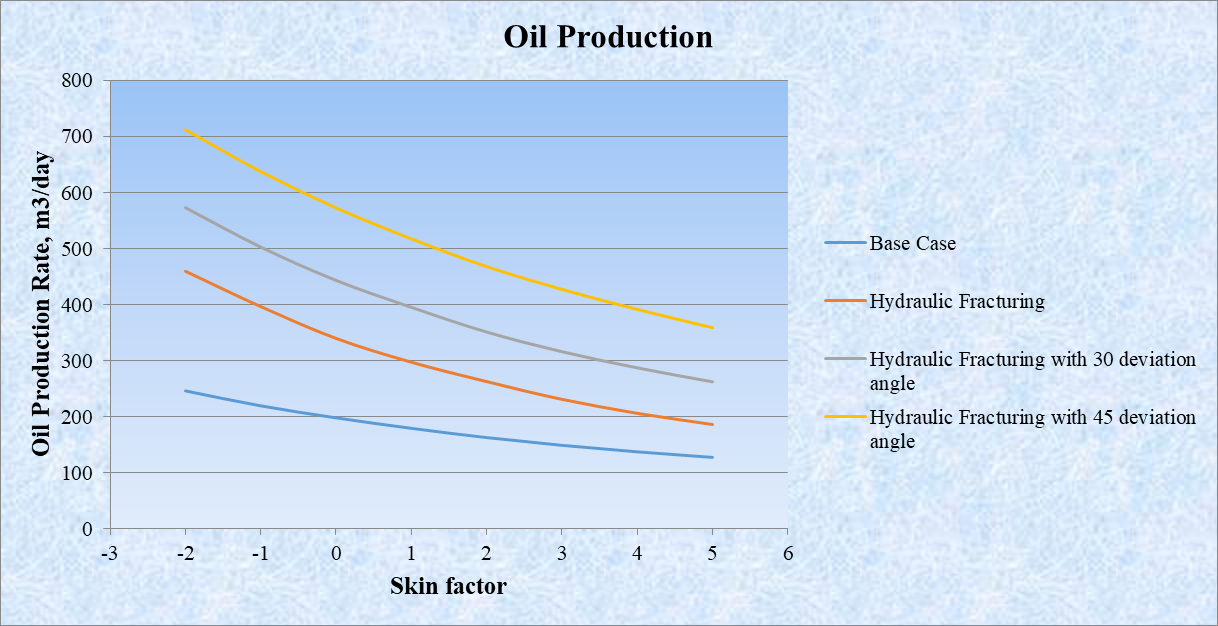
The skin factor is a key parameter that can influence the productivity of a well. Changes in skin factor can have a notable impact on the rate at which oil is produced from a well. Understanding how different skin factors affect oil production is essential for well management and reservoir optimization. Figure 5 depicts that when a negative skin factor of -2 is selected, the daily oil production rate significantly increases to 711.6 cubic meters per day (m3/day) when employing the hydraulic fracturing method in the case of a 45-degree deviation angle. In contrast, the base case yielded a daily oil production rate of 245.8 m3/day. This comparison highlights the substantial improvement in oil production achieved through hydraulic fracturing with a negative skin factor under the given conditions.
Different tubing diameters can have a significant impact on the rate at which natural gas is produced from a well. This variation is an important consideration in optimizing well performance and reservoir management, especially when aiming to maximize gas production. Figure 6 illustrates that when a tubing diameter of 2.98 inches is chosen, the daily gas production rate significantly increases to 18,388 cubic meters per day (m3/day) when employing the hydraulic fracturing method in the case of a 45-degree deviation angle. In contrast, the base case yielded a daily gas production rate of 7,398.5 m3/day. This comparison underscores the substantial improvement in gas production achieved through hydraulic fracturing with the specified tubing diameter under the given conditions.
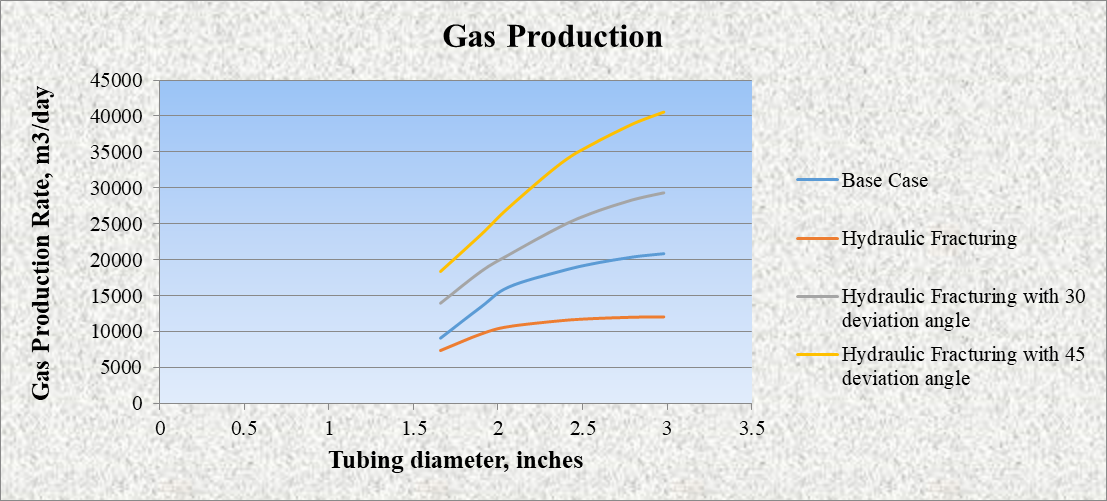
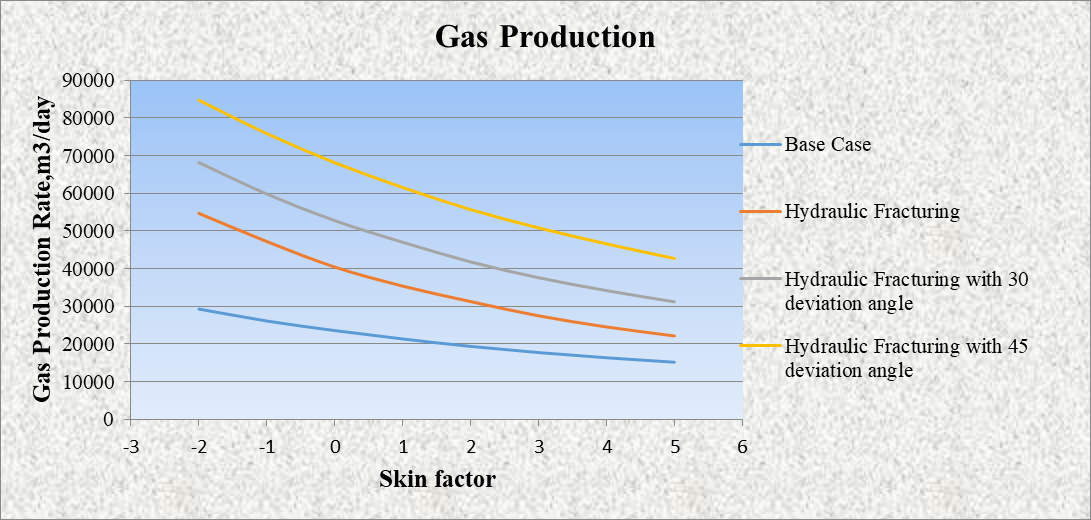
Figure 7 demonstrates that when a negative skin factor of -2 is selected, the daily gas production rate significantly increases to 84,681.9 cubic meters per day (m3/day) when employing the hydraulic fracturing method in the case of a 45-degree deviation angle. In contrast, the base case yielded a daily gas production rate of 29,245.8 m3/day. This comparison highlights the substantial improvement in gas production achieved through hydraulic fracturing with a negative skin factor under the given conditions.
Conclusion
In summary, hydraulic fracturing emerges as a proficient technique for inducing fractures within the rock formation, thereby promoting the extraction of natural gas or oil and augmenting recoverable volumes. The strategic choice of a deviation angle during well completion facilitates a more expansive coverage of the drainage area when juxtaposed with a purely vertical well. Moreover, within a deviated well, the pressure surrounding the wellbore surpasses that of a vertical counterpart. The careful selection of a larger tubing diameter further amplifies the efficiency of oil and gas extraction from the well. By means of meticulous sensitivity analysis, the study has effectively ascertained the optimal tubing diameter and the targeted skin factor around the wellbore, both of which constitute pivotal elements in the pursuit of maximizing production efficiency.
References
-
Abou AS Reservoir Stimulation.
-
Schechter RS (2013) Moncrief Endowed Chair in Petroleum Engineering. Oil Well Stimulation, Origins of the formation Damage, pp: 121-129, 246-249.
-
Zhai Z, Fonseca E, Azad A, Cox B (2015) A new tool for multi & multi-well hydraulic fracture modeling, SPE Hydraulic Fracturing Technology Conference, USA.
-
Eyvazov J, Hamidov N (2023) The effect of hydraulic fracturing length to the well production. Journal of Physics Conference Series 2594(1): 012022.
-
Eyvazov J, Hamidov N (2023) The Effect of Different Hydraulic Fracturing Width to the Well Production. International Journal of Oil Gas and Coal Engineering 11(4): 74-78.
-
Eyvazov J, Guliyeva M, Guliyev U (2022) How the Oil Recovery Factor Changes in Different Polymer Concentrations on in the Basis of Increasing Well Drainage Area. International Petroleum and Petrochemical Technology Conference, pp: 133-140.
-
Eyvazov J, Guliyeva M (2023) Increase Oil Recovery in Different Surfactant Concentrations on the Basis of Increasing Well Drainage Area. Progress in Petrochemical Science 5(1): 463-467.
-
Eyvazov J, Guliyeva M, Guliyev U (2022) The Effect of Sand Production to the Well Drainage Area. International Petroleum and Petrochemical Technology Conference, pp: 141-146.
-
Tronvoll J, Dusseault MB, Sanfilippo F, Santarelli FJ (2001) The Tools of Sand Management. SPE Annual Technical Conference and Exhibition, Louisiana, pp: SPE 71673.
-
Eyvazov J (2022) Sensitivity analysis of oil and gas production as a result of increasing the drainage area with changing in well parameters during different completion of wells. SOCAR, pp: 19-22.
-
Isehunwa SO, Ogunkunle TF, Onwuegbu SM, Akinsete OO (2010) Prediction of sand production in gas and gas condensate wells. Journal of Petroleum and Gas Engineering 8(4): 29-35.
-
Tananykhin D, Saychenko L (2017) Sand control methods for the development of oil & gas fields with hard to recover reserves. Espacios 38(48): 31.
-
Maduabuchi OF, Appah D, Okoro ES (2017) Relative Study of Internal Gravel Packing and Chemical Sand Consolidation: Sand Control Techniques of Niger Delta Wells. American Journal of Engineering Research 6(5): 261-268.
-
Ikporo B, Sylvester O (2015) Effect of Sand invasion on Oil Well Production: A Case study of Garon Field in the Niger Delta. The International Journal of Engineering and Science 4(5): 64-72.
-
Alakbari FS, Mohyaldinn ME, Muhsan AS, Hasan N, Ganat T (2020) Chemical Sand Consolidation: From Polymersto Nanoparticles. Polymers 12(5): 1069.
- Nigeria’s Vulnerability in the Face of Global Energy Policy
- A Simulation Study of Investigation of Optimum Oil Production Performance by Applying Various Gas Injection Methods in Oil Reservoir
- Characterization of Permo-Triassic Reservoirs through Thermal Maturity Assessment of Westphalian Source Rocks in the Cheshire Basin
- Influence of Microwax on the Rheological and Thermal Behaviour of a Wax Crude Oil
- Real-Time Monitoring and Performance Optimization of Steam Injection in Heavy Oil Reservoirs Using Fiber Optic Sensing and Integrated Predictive Simulation Models
- Rapid On-Site Determination of the Total Petroleum Hydrocarbon Content of Soils by Handheld Fourier Transform Near-Infrared Spectroscopy: Development of a Global, Site- and Scanner- Independent Calibration Model