Absorption of Crude Oil from Water Surface Using Shells of Periwinkle, Thales (Ngolo) and Oyster
The Total petroleum hydrocarbon (TPH) of water contaminated with Bonny Light crude oil was determined before and after absorption using Ultraviolet (UV) spectroscopy and Gas Chromatographic (GC) analyses. Shells of periwinkle, thales (ngolo) and oyster were used as absorbents, each of the shells were ground into powdery form, sieved through a mesh of 50 microns and calcined at temperatures of 500, 600 and 700°C respectively. Results obtained from UV spectroscopic analyses showed that the TPH concentration of the oil contaminated water after absorption with uncalcined periwinkle, thales and oyster shells were 1410.0, 1371.0 and 1330.0 mg/l respectively. The higher the calcination temperature of the absorbents, the lower the TPH of the oil contaminated water after absorption making oyster shell calcined at 700°C the best absorbent. GC analyses gave the individual hydrocarbon components of the oil contaminated water before and after absorption thereby confirming the uptake efficiencies of the absorbents. The lower the TPH of the oil contaminated water, the higher the uptake efficiency of the absorbents which is directly proportional to the dilution factor and the amount of crude absorbed by the absorbents. The uptake efficiency of the absorbents follows the trend Oyster >thales> periwinkle. The process of calcination (high temperature heating) boosted the uptake efficiency of the absorbents by 45 percent.
Abbreviations
TOG: Total Oil and Grease; TPH: Total Petroleum Hydrocarbon; GC: Gas Chromatography; PAH: Poly Aromatic Hydrocarbons; SVOCs: Semi-Volatile Organic Compounds; VOCs: Volatile Organic Compounds.
Introduction
It is always said that it is better to prevent an oil spill than to think of a way of cleaning it up, however, most spills are preventable while others are not. Oil spillage could take place due to bad weather such as hurricanes, storms and earthquakes, while others might occur as a result of natural seepage, i.e., crude oil leaking up naturally from the ground into the surface environment. There are also other forms of mystery spills which might be difficult to prevent, however, stringent measures should be taken immediately they occur. On the other hand, those spills that are caused by intentional acts of violence, such as the vandalilization of oil pipelines and the crashing of tankers and barges, should be prevented as much as possible. Others like the blowing up of oil wells, spills caused by Government facilities and pliers such as oil- carrying naval boats could also be minimized [1, 2, 3, 4, 5, 6, 7].
Spilled oil can be removed from the water in a variety of ways. It can either be skimmed off the surface like (vacuum) with skimmers or burnt off [7, 8, 9]; it can also be absorbed with sorbent pads or dispersed with chemicals (dispersants). Further, it can be corralled with booms and filtered through pumps such as an oil/water separator to remove the oil that has mixed with water [6, 10]. However, the most common clean up methods include absorption (sorbents), containment and recovery, dispersion, burning, bioremediation, hot and cold pressure washing, wave action and photoxidation [6, 11, 12].
This study is focused on absorption method in which sorbents are used to clean up oil spills.
For absorbents to be effective in combating oil spills, they should be both oleophilic (oil attracting) and hydrophobic. (water repellent). Although they may be used as the sole cleaning method in small spills, sorbents are most often used to remove final traces of oil or in areas that cannot be reached by skimmers [13].
Nevertheless, any oil removed from the sorbent materials after use must be properly disposed off or recycled [1]. There are three basic categories of sorbents namely: natural organic, natural inorganic and synthetic. Natural organic sorbents include peat, moss, straw, hay, sawdust, ground corncobs, feathers and other readily available carbon-based products [14]. Natural inorganic sorbents consist of clay, partite, vermiculite, glass wool, sand or volcanic ash [15]. Synthetic sorbents include man made materials that are similar to plastics, such as polyurethane, polyethylene and polypropylene and they are designed to adsorb liquids unto their surfaces like a sponge [10].
The aim of this study is to ascertain the effectiveness of natural organic materials such as shells of periwinkle, thales and oyster as absorbents in the clean-up of oil spill and also know the extent of cleansing that can be achieved by these absorbents through the knowledge of the concentration of the total petroleum hydrocarbon of the spilled system before and after oil spillage.This study is also aimed at having a knowledge of the best out of the three absorbents used.
Materials and Methods
Source of Crude Oil
The crude oil used for this study is the Nigeria’s Bonny light crude. It was obtained at the Bonny Island as “dead sample”, because the crude oil causing spills on water bodies like lakes, oceans, seas and ponds are usually in their dead form. “Dead crude” refers to crude that is not pressurized (not mixed with pressurized gases). Crude samples were obtained with glass sampling bottles previously cleaned with xylene and dried in an oven [1, 16].
Source(s) of Potential Absorbents
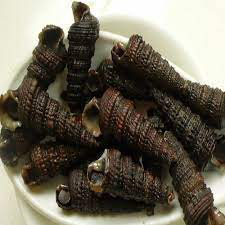
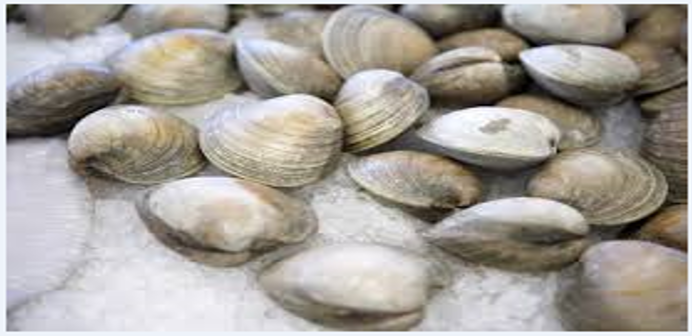
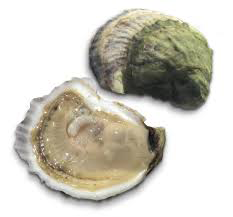
The absorbents used for this project (shells of periwinkle, oyster and thales (ngolo)) are extracts of common sea foods from the riverine areas of Niger Delta, Nigeria. The shells which were hitherto thrown away after the aquatic organism has been removed were collected in separate polyethylene bags and labelled appropriately and taken to the laboratory. Pictures of the shells of Periwinkle, thales and Oyster are shown in Figures 1-3 respectively.
Equipment and Media
Five hundred millilitre (500ml) separatory flasks, beakers, conical flask, xylene (solvent), concentrated sulphuric acid, silicone oil, thermostatic water bath, 50cc vials, weighing balance, carbon disulphide, benzene tetradecane solution, Core Laboratories cryoscope, AP Paar densitometer, Cacil CE 1021 (100 Series) ultraviolet spectrophotometer, 1000ml measuring cylinder, thermometer, 3400 varian star autosampler gas chromatographic liquid analyser and 50 microns sieve.
Laboratory Analyses
Calibration of Ultraviolet Spectrophotometer: A concentration of 10,000mg/l of the bonny light crude oil was prepared as the stock solution. Concentrations of 100mg/l- 50mg/l were prepared by pipetting 1.0ml, 2.0ml, 3.0ml, 4.0ml, and 5.0ml of the stock solution into 100ml volumetric flasks respectively. They were made up to mark with xylene and shaken. The absorbance of each standard concentration was determined using spectrophotometer at a wavelength of 420nm. The calibration curve was obtained by plotting absorbance values against the individual concentrations as shown in Figure 4. A calibration check with a concentration of 300mg/l was carried out using the same procedures with the standard and its absorbance determined [17].
Ultraviolet Analyses: For the ultraviolet (UV) analyses, 20ml of xylene (solvent) was weighed and added to the oil spilled sample after clean up by the absorbent. The mixture was transferred into the separatory flask with addition of two drops of sulphuric acid (to break down the moisture). The content was shaken vigorously for five minutes and was allowed to stand until separation was observed. The down layer (water) was eluted while the upper layer which is the extract (solvent containing the oil) was collected with an extract bottle [18]. The extract was analysed for oil and grease (total hydrocarbon content) using UV spectrophotometer (Cecil CE 1021; 100 Series) at 420nm. The absorbance and optical path length were obtained by the UV spectrophotometer while the concentration of the crude in water was calculated using the Beer Lamberts equation as shown in equation 1 using the slope of the calibration curve shown in figure 4 as the molar absorptivity constant (ɛ).
Gas Chromatographic Analyses: Gas chromatograph (Model no.: 3400 Varian Star) was utilized for total petroleum hydrocarbon (TPH) determination of the pure crude and water-oil mixture. The Gas Chromatograph was equipped with column of fused silica capillary (0.25 mm x 30 m x 0.25 mm), Helium gas (carrier gas) with a flow rate of 1.9 mL/min. Column temperature was formally set to periodically increase from 64°C to 191°C at 4.0°C/min and to 282°C at 6.0°C/min. It was held for 20 minutes at 274°C. A 1 litre sample was properly injected in split less modes. The quadrupole, ion exchanges and interface temperatures were held constant at 162°C, 153°C and 276°C respectively. Ionization was carried out in electrons impact mode at 67 eV and data were thereafter obtained by selected ion monitoring mode. The hydrocarbon content of the crude representing the total petroleum hydrocarbon (TPH) was identified based on selected ions, retention time comparison between sample and standard solutions. TPHs quantification was carried out using relative response factor of the target or specific TPH to internal standard. This was achieved using quantification ions and confirmation ions [19].
Reference Sample
Ultraviolet and gas chromatographic analyses of the Bonny light crude (without any of the absorbents used) was carried out, and this served as the reference sample. For the ultraviolet analysis, 40ml of xylene (solvent) was added to the sample, containing 20ml of the Bonny light crude weighing 2397 mg in 400ml of water. The mixture was transferred to the separatory flasks with addition of four drops of sulphuric acid (to break moisture). The content was shaken vigorously for four minutes and was allowed to stand, until separation was achieved. The down layer (water) was eluted while the upper layer which is the extract (solvent containing the oil) was collected with an extract bottle. The extract was analysed for oil and grease (Total hydrocarbon content) using UV spectrophotometer (Cecil CE 1021; 100 Series) at 420nm. The final concentration was calculated using the concentration/absorbance curve generated from the calibration plot which gave a concentration of 5993 mg/l.
Gas chromatographic analysis was carried out on the reference sample as well using a 3400 Varian star auto sampler gas chromatographic liquid analyser.
Absorption of Crude Oil from Water Using Shells of Periwinkle, Thales and Oyster
A sample of 20ml of bonny light crude oil weighing 2397 mg was transferred into a 1-litre beaker containing 400ml of water at 300C. The beaker walls were previously coated with silicone oil to prevent crude oil from sticking to the walls. The beaker content was shaken using a thermostatic water bath to simulate sea waves. Twenty-five grams (25g) of each of the uncalcined ground periwinkle shell (of 50 microns mesh size) was spread over the surface of the spilled water to sorb crude oil from the surface from where some amounts of the crude oil were seen to sink (due to impurities). The ground periwinkle shell was allowed contact with the crude oil for 7 minutes, after which, the ground periwinkle shell with the absorbed oil was carefully scooped off the surface with a spatula and introduced into a glass vial. The remaining sample was separated into two, for ultraviolet and gas chromatographic analyses. This process was repeated for ground samples of thales (ngolo) and oyster.
The same absorbents (periwinkle, thales and oyster) with the same mesh size of 50 microns was divided into three, each of which was calcined using an oven at temperatures of 500, 600 and 700°C respectively to remove volatile components in the absorbent and to envisage the effect of calcination on uptake efficiency of the absorbents. Each of the calcined absorbents weighing 25 g respectively was used to clean up a simulated oil-spilled water consisting of 20 ml of bonny light crude oil in a 400 ml water at 30°C [20, 21, 22, 23, 24, 25].
Results and Discussion
Results
The results showing the total petroleum hydrocarbon content after absorption with shells of periwinkle, thales (ngolo) and oyster are contained in Tables 1-3 respectively, while the amount of crude oil absorbed at the different dilution factors is contained in Tables 4-6. Figure 4 shows the calibration plot for the estimation of the total petroleum hydrocarbon content, while Figures 5 and 6 contain charts showing the absorbances of calcined and uncalcined shells of periwinle and thales; Figures 7 and 8 show their absorption capacities in relatively smaller dilution factors.
| Sample Identity | Absorbance @ 420nm | Optical Path Length (cm) | TPH Concentration (mg/l) |
|---|---|---|---|
| Uncalcined Periwinkle | 0.395 | 1.000 | 1410.000 |
| Calcined Periwinkle @ 500°C | 0.285 | 0.999 | 1018.000 |
| Calcined Periwinkle @ 600°C | 0.258 | 0.999 | 922.000 |
| Calcined Periwinkle @ 700°C | 0.23 | 1.001 | 820.000 |
| Uncalcined Thales | 0.384 | 1.000 | 1371.000 |
| Calcined Thales @ 500°C | 0.263 | 0.999 | 940.000 |
| Calcined Thales @ 600°C | 0.236 | 1.001 | 842.000 |
| Calcined Thales @ 700°C | 0.209 | 0.998 | 748.000 |
Table 1: Concentrations of Simulated Oil Spill After Absorption with Periwinkle Shell using UV Spectroscopic Analyses.
| Sample Identity | Absorbance @ 420nm | Optical Path Length (cm) | TPH Concentration (mg/l) |
|---|---|---|---|
| Uncalcined Oyster | 0.372 | 0.999 | 1330.000 |
| Calcined Oyster @ 500°C | 0.261 | 1.001 | 931.000 |
| Calcined Oyster @ 600°C | 0.232 | 0.998 | 830.000 |
| Calcined Oyster @ 700°C | 0.206 | 1.002 | 734.000 |
Table 2: Concentrations of Simulated Oil Spill After Absorption with Oyster Shell using UV Spectroscopic Analyses.
| Sample Identity | Crude in Extract (mg) | Dilution Factor | Uptake Efficiency (%) | Crude Absorbed (mg) |
|---|---|---|---|---|
| Uncalcined Periwinkle | 132.700 | 4.250 | 76.500 | 2264.000 |
| Calcined Periwinkle @ 500°C | 69.100 | 5.890 | 83.000 | 2328.000 |
| Calcined Periwinkle @ 600°C | 56.700 | 6.500 | 84.600 | 2340.000 |
| Calcined Periwinkle @ 700°C | 44.900 | 7.310 | 86.300 | 2352.000 |
Table 3: Uptake Efficiency, Dilution factor and Amount of Crude Absorbed by Periwinkle Shell.
| Sample Identity | Crude in Extract (mg) | Dilution Factor | Uptake Efficiency (%) | Crude Absorbed (mg) |
|---|---|---|---|---|
| Uncalcined Thales | 125.500 | 4.370 | 77.100 | 2272.000 |
| Calcined Thales @ 500°C | 59.000 | 6.380 | 84.300 | 2338.000 |
| Calcined Thales @ 600°C | 47.300 | 7.120 | 86.000 | 2350.000 |
| Calcined Thales @ 700°C | 37.400 | 8.010 | 87.500 | 2360.000 |
Table 4: Uptake Efficiency, Dilution factor and Amount of Crude Absorbed by Thales Shell.
| Sample Identity | Crude in Extract (mg) | Dilution Factor | Uptake Efficiency (%) | Crude Absorbed (mg) |
|---|---|---|---|---|
| Uncalcined Oyster | 118.100 | 4.510 | 77.800 | 2279.000 |
| Calcined Oyster @ 500°C | 57.800 | 6.440 | 84.500 | 2339.000 |
| Calcined Oyster @ 600°C | 46.000 | 7.220 | 86.200 | 2351.000 |
| Calcined Oyster @ 700°C | 36.000 | 8.160 | 87.800 | 2361.000 |
Table 5: Uptake Efficiency, Dilution factor and Amount of Crude Absorbed by Oyster Shell.
![Figure 4: A calibration check with a concentration of 300mg/l was carried out using the same procedures with the standard and its absorbance determined [17].](/fulltextimages/12951/fig_4.png)
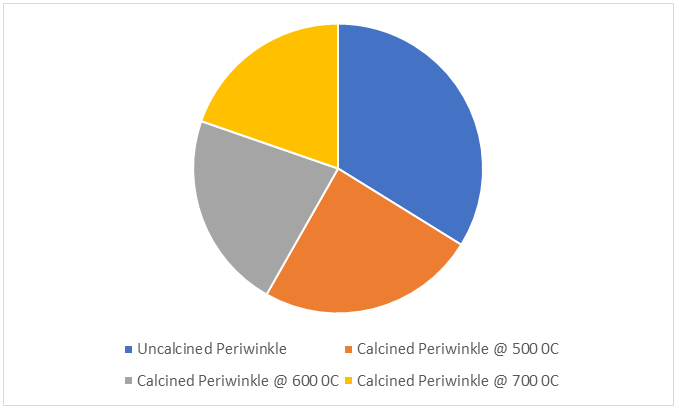
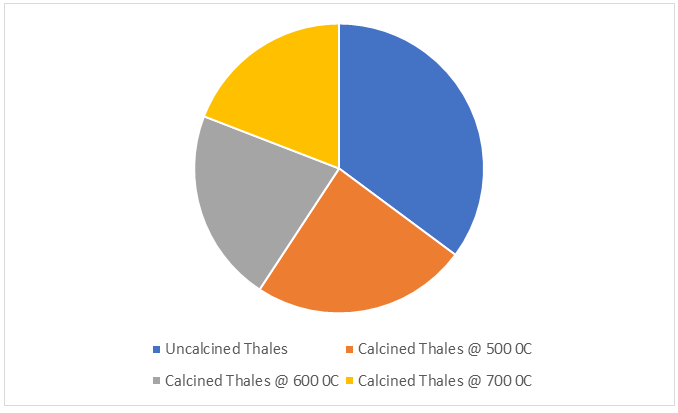
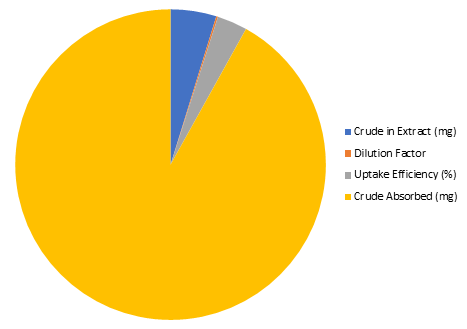
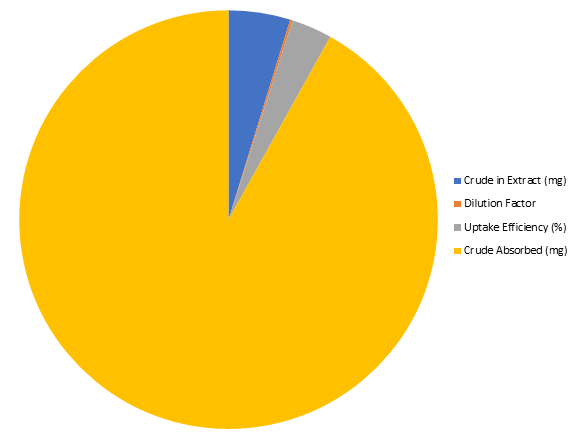
Table 7 contains the distribution of the different hydrocarbons in the test crude oil before and after absorption. The gas chromatographic profile of the crude oil showed an array of hydrocarbon compounds, from methane to hexatriacontane (C36) hydrocarbons.
| Hydrocarbon compound distribution | Test crude | Periwinkle shell | Thales (Ngolo) shell | Oyster shell | ||||||
|---|---|---|---|---|---|---|---|---|---|---|
| UN | 500oC | 700oC | UN | 500oC | 700oC | UN | 500oC | 700oC | ||
| Methane | 0.043 | 0.003 | 0.000 | 0.000 | 0.002 | 0 | 0.000 | 0.000 | 0.000 | 0.000 |
| Ethane | 0.058 | 0.003 | 0.000 | 0.000 | 0.002 | 0.000 | 0.000 | 0.000 | 0.000 | 0.000 |
| Propane | 0.053 | 0.041 | 0.000 | 0.000 | 0.003 | 0.000 | 0.000 | 0.001 | 0.000 | 0.000 |
| i-butane | 0.072 | 0.043 | 0.000 | 0.000 | 0.041 | 0.000 | 0.000 | 0.002 | 0.000 | 0.000 |
| n-butane | 0.085 | 0.067 | 0.020 | 0.010 | 0.052 | 0.010 | 0.000 | 0.025 | 0.000 | 0.000 |
| neo-pentane | 0.000 | 0.000 | 0.000 | 0.000 | 0.000 | 0.000 | 0.000 | 0.000 | 0.000 | 0.000 |
| i-pentane | 0.102 | 0.099 | 0.060 | 0.050 | 0.063 | 0.040 | 0.020 | 0.03 | 0.010 | 0.000 |
| n-pentane | 0.135 | 0.124 | 0.100 | 0.001 | 0.082 | 0.050 | 0.032 | 0.064 | 0.020 | 0.000 |
| hexanes | 2.020 | 0.529 | 0.332 | 0.330 | 0.421 | 0.380 | 0.320 | 0.346 | 0.250 | 0.000 |
| m-cyc-pentane | 0.400 | 0.592 | 0.320 | 0.210 | 0.490 | 0.400 | 0.100 | 0.400 | 0.310 | 0.000 |
| benzene | 0.130 | 0.070 | 0.010 | 0.010 | 0.053 | 0.020 | 0.020 | 0.042 | 0.030 | 0.030 |
| cyclohexane | 0.872 | 0.597 | 0.470 | 0.470 | 0.521 | 0.490 | 0.430 | 0.480 | 0.420 | 0.010 |
| heptanes | 1.740 | 1.532 | 1.120 | 1.020 | 1.310 | 1.130 | 1.110 | 1.214 | 1.020 | 0.000 |
| m-cyc-hexane | 0.660 | 1.422 | 1.030 | 1.010 | 1.257 | 1.160 | 1.130 | 1.128 | 1.120 | 0.010 |
| toluene | 0.392 | 0.070 | 0.020 | 0.015 | 0.052 | 0.210 | 0.110 | 0.048 | 0.200 | 0.001 |
| octanes | 2.590 | 2.560 | 2.501 | 2.301 | 2.136 | 2.210 | 2.000 | 2.272 | 2.270 | 0.001 |
| e-benzene | 0.270 | 0.234 | 0.150 | 0.120 | 0.221 | 0.240 | 0.210 | 0.247 | 0.240 | 0.210 |
| m/p-xylene | 0.410 | 0.272 | 0.100 | 0.100 | 0.327 | 0.320 | 0.150 | 0.301 | 0.290 | 0.010 |
| o-xylene | 0.230 | 2.010 | 0.160 | 0.150 | 0.214 | 0.180 | 0.010 | 0.202 | 0.180 | 0.001 |
| nonanes | 3.020 | 2.943 | 2.580 | 2.530 | 2.642 | 2.490 | 2.220 | 2.652 | 2.650 | 0.020 |
| 124tri-benzene | 0.490 | 0.370 | 0.290 | 0.270 | 0.321 | 0.420 | 0.317 | 0.422 | 0.420 | 0.010 |
| decanes | 5.280 | 4.109 | 3.220 | 3.200 | 3.924 | 3.630 | 3.230 | 3.875 | 3.870 | 0.210 |
| undecanes | 5.090 | 4.070 | 3.740 | 3.730 | 3.907 | 3.840 | 3.520 | 3.915 | 3.900 | 0.100 |
| dodecanes | 4.720 | 4.530 | 4.020 | 4.000 | 4.280 | 4.180 | 4.150 | 4.081 | 4.083 | 0.033 |
| tridecanes | 5.070 | 4.631 | 4.510 | 4.200 | 4.600 | 4.510 | 4.310 | 4.450 | 4.215 | 0.000 |
| tetradecanes | 5.623 | 5.243 | 5.100 | 4.100 | 4.932 | 4.840 | 4.277 | 4.536 | 4.532 | 0.102 |
| pentadecanes | 6.980 | 6.210 | 5.800 | 5.400 | 5.770 | 5.680 | 5.080 | 5.362 | 5.215 | 0.002 |
| hexadecanes | 6.020 | 5.620 | 5.020 | 5.000 | 5.682 | 4.910 | 4.210 | 4.882 | 4.875 | 0.015 |
| heptadecanes | 4.920 | 4.735 | 4.010 | 3.010 | 4.912 | 4.230 | 4.110 | 3.921 | 3.847 | 0.012 |
| octadecanes | 6.047 | 5.670 | 5.310 | 5.110 | 5.129 | 5.120 | 5.110 | 4.989 | 4.987 | 0.003 |
| nonadecanes | 3.240 | 4.615 | 4.600 | 4.510 | 4.510 | 4.450 | 4.420 | 4.482 | 4.357 | 0.002 |
| eicosanes | 3.820 | 3.735 | 3.730 | 3.230 | 3.700 | 3.610 | 3.420 | 3.648 | 3.598 | 0.007 |
| heineicosanes | 4.025 | 3.620 | 3.470 | 3.290 | 3.590 | 3.500 | 3.320 | 3.662 | 3.423 | 0.023 |
| docosanes | 4.120 | 3.450 | 3.150 | 3.142 | 3.214 | 3.090 | 3.070 | 3.026 | 2.987 | 0.020 |
| tricosanes | 3.020 | 3.000 | 2.920 | 2.533 | 2.978 | 2.950 | 2.420 | 3.427 | 2.845 | 0.001 |
| tetracosanes | 2.970 | 2.890 | 2.820 | 2.720 | 2.852 | 2.810 | 2.560 | 2.721 | 2.678 | 0.001 |
| pentacosanes | 2.842 | 2.720 | 2.610 | 2.310 | 2.684 | 2.660 | 2.580 | 2.582 | 2.547 | 0.002 |
| hexacosanes | 2.724 | 2.547 | 2.140 | 2.120 | 2.534 | 2.520 | 2.400 | 2.500 | 2.498 | 0.005 |
heptacosanes 2.547 2.520 2.410 2.310 2.490 2.470 2.470 2.377 2.364 0.010
octacosanes 2.470 2.400 2.120 2.100 2.395 2.390 2.320 2.281 2.250 0.010
nonacosanes 2.540 2.502 2.440 2.421 2.470 2.430 2.315 2.344 2.234 0.200
triacontanes 2.420 2.380 2.250 2.240 2.370 2.350 2.320 2.352 2.320 0.020
hentricontanes 2.320 2.270 2.220 2.210 2.245 2.230 2.200 2.221 2.150 0.001
dotriacontanes 2.150 2.080 2.020 2.010 2.075 2.070 2.030 2.061 2.056 0.010
tritriacontanes 1.620 1.593 1.520 1.420 1.592 1.590 1.500 1.489 1.487 0.007
tetriacontanes 1.340 1.214 1.140 1.130 1.251 1.250 1.227 1.189 1.187 0.002
pentatriacontanes 1.180 1.120 1.000 0.905 1.115 1.110 1.107 1.072 1.048 0.040
hexatriacontanes 6.420 4.330 3.270 3.220 5.964 4.130 3.900 5.460 2.520 1.420
- Where UN = Uncalcined absorbent
Table 7: Hydrocarbon Content of The Test Crude before / After Absorption by Absorbents Using Gas Chromatographic Analyses.
Bear Lamberts Equation:
A Cl ε = (1) Where:
4 1 1 2.8 10 Molar absorbtivityconstant lmg cm ε − − − = = ×
A = Absorbance @ 420 nm wavelength L = Optical Length
X Dilution factor Y = (2)
( ) % 100 X Y UptakeEfficiency X − = × (3)
( ) Crude Absorbed by Absorbent mg C D = − (4)
Where: X = Crude oil Concentration before Absorption (mg/l) Y = Crude oil Concentration after Absorption (mg/l) C = Weight of Crude before Spillage (mg) D = Weight of Crude in Extract (mg)
Discussion
One of the basic factors that determines the cleanliness and environmentally friendliness of a crude oil contaminated site after remediation by absorption is the total petroleum hydrocarbon (TPH) concentration at the site. The lower the TPH concentration of the oil contaminated site after absorption the better the absorption capacity of the absorbents [19, 26, 27, 28]. Total petroleum hydrocarbon (TPH) is typically defined as carbon chains in the range of C6 through C35, they include a variety of mixtures that may contain hundreds to thousands of hydrocarbon compounds including aliphatic (straight carbon chain) and aromatic (benzene ring) compounds. The concentration of TPH after a clean-up process serves as a key performance indicator for the effectiveness of the absorbents used especially in cases where volatile organic compounds (VOCs), semi-volatile organic compounds (SVOCs) and metals have either been screened out or fully evaluated. The diesel and gasoline risk- based level for TPH proffers three tiers that serves as a guide to verify the cleanliness of a spilled site after clean up [29, 30, 31, 32, 33, 34, 35]. The three tiers include the gasoline range (C6-C12) with a TPH < 2500 mg/l, diesel range (C12-C28) with a TPH < 2610 mg/l and lube oil range (C28 – C35) with a TPH < 23000.
Tables 1, 2 and 3 unveils that the TPH of the oil spilled sample was below the acceptable gasoline range which is the lowest range indicating the effectiveness of periwinkle, thales and oyster as absorbents for treating oil spillage.
Tables 1, 2 and 3 shows the concentrations of the simulated oil contaminated water body after absorption with periwinkle, thales and oyster respectively. Each of the tables indicated the absorbance and optical lengths of the oil extract after absorption with the uncalcined absorbents as well as the absorbents calcined at temperatures of 500, 600 and 700°0C respectively. Figures 5 and 6 shows a pie chart indicating the absorbance of the remediated water after treatment with uncalcined and calcined periwinkle and thales shells respectively. The higher the temperature of calcination the higher the absorbance. The absorbance increases with increase in the concentration of hydrocarbon in water.
Calcination is the heating (to a very high temperature but below the melting point) of the material under study to remove volatile materials like carbon dioxide, water, sulphur dioxide etc. Calcination is the basic treatment carried out on the absorbent used for this study to deduce its effect on the uptake efficiency [36, 37]. Several other past works have shown that treatment on the absorbent, such as increasing the contact time, loading weight, salinity, temperature and treating the absorbents with different concentrations of the solvent, led to a corresponding increase in their uptake efficiencies. The present study however did not concentrate its effort on finding out the effect of these treatments on the uptake efficiencies of the absorbents, rather focused on the most effective absorbent used (i.e. absorbent with the highest uptake efficiency) and the effect of calcinations on the uptake efficiency of the absorbent. Table 1 shows that the TPH concentration of the crude oil contaminated water after absorption with uncalcined periwinkle shell was the highest, it can also be observed from the same table that the TPH concentration reduced with increase in the calcination temperature of the absorbents used in the absorption process. The same trend was also observed in Tables 2 and 3 with the shells of thales and oyster respectively.Absorption using the shells of periwinkle, thales (ngolo) and oyster was carried out at constant conditions of contacting time (7 minutes), loading weight (25g) and temperature (30°C). However, the process of calcination increased the percentage uptake efficiency of the absorbents by 30%. Figures 7 and 8 shows a pie chart unveiling the absorption capacity of uncalcined thales and oyster shells respectively.
The effect of temperature on the sorption of oil was studied by heating the absorbents at various temperatures to know the effect of temperature on the uptake efficiency of the absorbents. Temperature can also be considered in terms of the water on which the spill occurs. The higher the temperature of the water, the easier it will be to clean up the spill. This is because most of the volatile components will be lost to evaporation due to the high temperature and the film of the oil droplets becomes lighter when the temperature is high [18]. For this study, the temperature of the water was maintained at 300C since it is the temperature easily attainable for rivers, seas, oceans, ponds and lakes. It can also be deduced from Tables 1, 2 and 3 that the higher the TPH concentration, the higher the absorbance and the lower the rate of absorption, this is in accordance with Berr-Lambart’s law. Results obtained showed that oyster shell calcined at 700°C left the oil contaminated water the lowest absorbance absorption hence regarded as the best absorbent.Better absorbents give lower absorbance after absorption.
The uptake efficiency, dilution factor, amount of crude absorbed by the uncalcined and calcined absorbents obtained from the shells of periwinkle, thales and oyster were shown in Tables, 4, 5 and 6 respectively. The uptake efficiency of an absorbent refers to the absorption capacity or oil cleaning ability of the absorbent it also refers to the percentage of TPH or total oil and grease (TOG) cleaned by the absorbents. On the other hand, the dilution factor refers to the ratio of the crude oil concentration in water before and after absorption as shown in equation 2 and it is directly proportional to the uptake efficiency of the absorbents hence the higher the uptake efficiency and dilution factor of an absorbent the better the absorbent to clean up oil contaminated water samples thereby bringing the TPH concentration of the oil contaminated sample to the barest minimum. Mathematically the uptake efficiency of an absorbent is the ratio of the difference in the crude oil concentration in water before and after absorption to the crude oil concentration in water before absorption as shown in Equation 3.
Results obtained from Tables 4, 5 and 6 shows that oyster shell calcined at 700 0C had the highest uptake efficiency and dilution factor while uncalcined periwinkle shell had the least uptake efficiency and dilution factor.
The amount of crude oil absorbed by the absorbent in (mg) is another parameter that confirms the uptake efficiency of the absorbents, it is the difference in the weight of the crude before spillage to the weight of the crude after absorption which is equivalent to the weight of the crude in the extract as shown in equation 4. The amount of crude absorbed by the absorbent is directly proportional to the uptake efficiency and dilution factor of the absorbents.
Gas chromatographic analyses were carried out on the crude oil before spillage as well as on the oil extract after absorption with the uncalcined and calcined absorbents obtained from the shells of periwinkle, thales and oyster respectively. Gas chromatography (GC) like Ultraviolet (UV) spectroscopy gives the TPH concentration of the crude but unlike UV spectroscopy, GC also gives the individual hydrocarbon content of the crude. Total Petroleum Hydrocarbon (TPH) refers to a mixture of hydrocarbons found in crude oil. There are several of these compounds hence it is not practicable to measure one separately however it is of great importance to measure the total amount (TPH) at a site [9, 38, 39]. TPHs are one of the most common groups of persistent organic contaminants, It is also worthy to note that not all the petroleum hydrocarbons occur in one sample, the TPH of a sample depends on the origin of the sample, it is therefore the sum of the volatile petroleum hydrocarbons, including poly aromatic hydrocarbons (PAH) and extractable petroleum hydrocarbon present in the sample however the GC measures the concentrations of the critical hydrocarbon in the crude [7, 40]. Results obtained from Table 7 shows that the gaseous hydrocarbons from C1 to C4 and the heaviest solid hydrocarbon of C36 reduced with increase in the temperature at which the absorbents were calcined with the shell of Oyster calcined at 700°C giving the lowest TPH concentration thereby corroborating with the results obtained from UV
Spectroscopy. Results obtained from Table 7 shows that the absorbents do not completely take care of the liquid and solid fractions of the crude especially the water-soluble fractions and so should not be used as a sole cleaning agent during crude oil spill [41, 42].
Conclusion
The Total petroleum hydrocarbon (TPH) concentration of crude oil contaminated water after absorption is a key performance indicator that shows the cleanliness and environmental friendliness of the water. The shells of periwinkle, thales and oyster are very good absorbents because of their ability to reduce the TPH of the oil in water to an appreciable extent as indicated by their uptake efficiencies. The uptake efficiencies of absorbents are affected by their loading weight, contact time, mesh size, temperature of environment as well as the temperature at which the absorbents were heated before use which is also known as calcination. Results obtained showed that oyster shell has the highest uptake efficiency while periwinkle shell had the least absorption capacity. The uptake efficiency of the absorbents increases with increase in the temperature of calcination, all other factors remaining constant.
Acknowledgements
The authors gratefully acknowledge the staff of Technology Partners Institute and Core Lab Nigeria Limited, Port Harcourt, Nigeria.
References
-
Ultraviolet and gas chromatographic analyses of the Bonny light crude (without any of the absorbents used) was carried out, and this served as the reference sample. For the ultraviolet analysis, 40ml of xylene (solvent) was added to the sample, containing 20ml of the Bonny light crude weighing 2397 mg in 400ml of water. The mixture was transferred to the separatory flasks with addition of four drops of sulphuric acid (to break moisture). The content was shaken vigorously for four minutes and was allowed to stand, until separation was achieved. The down layer (water) was eluted while the upper layer which is the extract (solvent containing the oil) was collected with an extract bottle. The extract was analysed for oil and grease (Total hydrocarbon content) using UV spectrophotometer (Cecil CE 1021; 100 Series) at 420nm. The final concentration was calculated using the concentration/absorbance curve generated from the calibration plot which gave a concentration of 5993 mg/l. Gas chromatographic analysis was carried out on the reference sample as well using a 3400 Varian star auto sampler gas chromatographic liquid analyser.
- Nigeria’s Vulnerability in the Face of Global Energy Policy
- A Simulation Study of Investigation of Optimum Oil Production Performance by Applying Various Gas Injection Methods in Oil Reservoir
- Characterization of Permo-Triassic Reservoirs through Thermal Maturity Assessment of Westphalian Source Rocks in the Cheshire Basin
- Influence of Microwax on the Rheological and Thermal Behaviour of a Wax Crude Oil
- Real-Time Monitoring and Performance Optimization of Steam Injection in Heavy Oil Reservoirs Using Fiber Optic Sensing and Integrated Predictive Simulation Models
- Rapid On-Site Determination of the Total Petroleum Hydrocarbon Content of Soils by Handheld Fourier Transform Near-Infrared Spectroscopy: Development of a Global, Site- and Scanner- Independent Calibration Model