Process Parameter Optimization of Waste Polyethylene Terephthalate Bottle Neutral Hydrolysis Depolymerisation Using Process Simulation and Response Surface Methodology
The global surge in plastic production has led to a concerning accumulation of durable plastic waste in landfills and the environment. To address this issue, the depolymerization of waste polyethylene terephthalate (PET) through neutral hydrolysis has been proposed as a chemical recycling solution. Despite its potential environmental benefits, the endothermic nature of this process at high temperatures has raised doubts about its commercial feasibility. In response, this study was conducted to assess optimal conditions for waste PET depolymerization using neutral hydrolysis in a continuous stirred tank reactor with zinc acetate as a catalyst. Process simulation, aimed to manufacture pure terephthalic acid (TPA) and ethylene glycol from pelletized post-consumer PET bottles, was conducted with Aspen Plus Version 11. Sensitivity analysis explored the impact of factors such as reaction temperature, reaction time, PET flake size, and catalyst to PET ratio on both PET conversion and TPA yield. The study found that PET depolymerization increased with decreasing particle size, longer reaction times, increasing catalyst to PET ratio and reaction temperatures within the range of 200–240°C. Optimizing the process through response surface modelling revealed that key parameters for neutral hydrolysis considering a mean particle size of 20 mm were the ratio of water to PET, temperature, pressure, and reaction time with optimal values of 5:1, 225°C, 30 bar, and 67.5 min respectively. The model's reliability was confirmed through variance analysis, emphasizing the significance of main and interaction effects in the regression model.
Abbreviations
CSTR: Continuous Stirred-Tank Reactor; EG: Ethylene Glycol; PET: Polyethylene Terephthalate; RSM: Response Surface Methodology; TPA: Terephthalic Acid.
Introduction
The demand for polyethylene terephthalate (PET) has grown across various sectors such as food and beverages, healthcare, textiles, cosmetics, and housing, because it offers transparent light weight options for packaging beverages and other consumer products [1, 2]. However, the improper management of waste PET bottles has become a significant environmental concern worldwide. These bottles contribute to the growing accumulation of plastic waste and pose numerous waste management challenges [3, 4]. One of the main problems with waste PET bottles is their slow biodegradation. PET bottles can take several decades or even centuries to decompose naturally. This means that this waste if improperly managed can result in littering, clogged drainage systems, persistent constituents of landfills and harm to marine life if they enter oceans and waterways, contributing to pollution and harming ecosystems [4, 5]. To address this growing global environmental concern, recycling technologies are being utilized and actively researched to handle post-consumer plastic waste. There are three primary waste recycling methods for recovering the value of waste PET bottles. On overview of these recycling methods is shown in Figure 1.
Primary recycling encompasses the recovery and reuse of polymeric materials for purposes they were originally designed for, without modifying their initial form. While it is a cheap option, there are limited cycles for suitable usage prior to the deterioration of materials’ intrinsic properties. Secondary recycling follows a series of steps, starting with the sorting and separation of thermoplastic containers from any impurities or foreign materials. The sorted containers are then washed and dried to remove any residual substances. Subsequently, they undergo grinding to obtain plastic flakes, which are melted and processed into new forms through extrusion. While secondary recycling allows for wider post- consumer plastic utilization and the production of recycled products with improved physicochemical properties when blended with other materials, this is however accompanied by property deterioration with each cycle of use due to reduction in molecular weight and heterogeneity. Chemical recycling involves partial or full depolymerization of polymers into oligomers or monomers via chemical processes such as glycolysis, alcoholysis, and hydrolysis which provide feedstocks for new plastic materials. This method has the advantage of allowing for production of entirely new products of high value from waste post-consumer plastic such as PET bottles [7, 8].
There are several chemical recycling approaches each with its advantages and disadvantages. Hydrolysis enables the retrieval of high-quality monomers from PET bottles by its reaction with water at relatively high temperatures and pressures under alkaline, acidic, or neutral conditions. Hydrolysis has the primary advantage of breaking the PET polymer directly into its original monomers, ethylene glycol (EG) and terephthalic acid (TPA), thus eliminating the production of methanol [8]. Neutral hydrolysis has attracted recent interest because its effluents have the highest ecological purity as the use of organic solvents is very limited or non-existent. However, low-quality TPA is produced from hydrolysis under neutral conditions as compared to acidic or alkaline conditions at similar temperatures and pressures [9, 10]. Thus, conditions for technical feasibility of neutral hydrolysis have been the subject of ongoing research.
Uncatalyzed depolymerization of post-consumer PET via neutral hydrolysis requires temperatures of at least 300 ºC to achieve TPA yields exceeding 80%. Reaction pressures are also elevated with 100 bar and 300 bar reported in separate studies. The degree of PET conversion is influenced by other operating conditions such as stirring rate, the mass ratio of PET to water, and residence time after the desired reaction temperature and pressure have been attained. The PET conversion rates and TPA yields observed for the different states of water used such as compressed liquid, superheated vapour, or supercritical fluid were comparable with similar reaction kinetics. PET in its molten state has been seen to increase the rate of reaction significantly with as compared to its solid state. It was observed that increasing the residence time beyond a threshold led to decreasing TPA yield. This was attributed to the formation of secondary products after total depolymerization of the PET was complete. Limiting the reaction time is desirable as it minimizes the energy consumed during the process. Attempting depolymerization at temperatures less than 200 ºC required more than 2 hours reaction time [11, 12, 13].
The use of catalysts has been shown to reduce reaction temperatures and time while increasing TPA yield for depolymerization of pellets from waste PET bottles. When a simple ester is hydrolysed in aqueous solution with metal salts functioning as a catalyst, zinc acetate and sodium acetate catalyse PET hydrolysis by boosting its pace by around 20% because of the electrochemical instability of the polymer- water interface during the hydrolysis process [14, 15]. The effectiveness of other catalysts has been investigated. With the use of Platinum heterogeneous catalyst (Pt zeolite-β), reaction temperature was reduced in an experiment without a corresponding reduction in either PET conversion or TPA yield as compared to heterogeneous catalyst Zinc zeolite-β. The Pt zeolite-β catalyst was however similar in performance to homogeneous Zinc Chloride [16]. An experimental study revealed that metal acetates used for the catalysis of neutral hydrolysis can be replaced by salts such as NaCl and CaCl2. Furthermore, it was established that marine water, rich in a mixture of metallic ions such as Na+, Mg2+, Ca2+, and K+, is a viable substitute for metal acetates as catalysts for PET depolymerization via neutral hydrolysis [17]. Reported reaction temperatures for catalysed neutral hydrolysis for post-consumer PET are 195 to 280 ºC with reaction pressures of 1.3 to 4 MPa [9]. Neutral hydrolysis experiments for PET depolymerization conducted below 210ºC required at least 2 hours for complete PET conversion. In the presence of Zinc Acetate catalyst above 230ºC, complete melting of PET in water was observed, resulting a homogeneous phase for which fast hydrolysis was ideal to maximize the yield of TPA [15, 18, 19]. Neutral hydrolytic depolymerization of PET has been found through experiments to proceed as a first order reaction with activation energy of 64.13 – 73.5 kJ/mol and pre-exponential (frequency) factor of 7.34 – 88.83 × 10⁴ min-1 for reaction temperatures of 195 – 205ºC and 30 to 35 bar [17, 20].
The difficulty in separating the impurities in PET from the resulting TPA demands much more comprehensive purification processes than hydrolysis under either acidic or alkaline conditions. The purity of the resultant TPA solution can be significantly increased by filtration having been dissolved in caprolactam or an aqueous NaOH. An alternative purification option is the crystallization of TPA from caprolactam. Purification of the EG generated during the reaction is possible by extraction or distillation [21]. The chemical reaction for the neutral hydrolysis is shown in Figure 2.
![Figure 1: Overview of plastic recycling techniques [6].](/fulltextimages/13150/fig_1.png)
There is a paucity of studies on optimized pilot plant designs for the hydrolysis of waste PET bottles especially based on neutral hydrolysis. The successful implementation of a pilot plant design for waste PET bottle hydrolysis could significantly contribute to the effective recycling and reutilization of PET, reducing its negative impact on the environment. Thus, the aim of this study is to determine the optimal process parameters for the depolymerization of waste PET bottles via neutral hydrolysis in a pilot process plant.
Materials and Methods
Process Simulation
Experimental data obtained from publications on PET depolymerization via neutral hydrolysis formed the basis for process simulation of PET depolymerization via neutral hydrolysis using a Continuous Stirred Tank Reactor (CSTR) modelled within Aspen Plus software (version 11), leveraging its polymer feature. This approach was previously employed in a recent simulation study conducted by Raheem and Edeh (2023). The parameters for the process simulation of a pilot plant for neutral hydrolysis towards PET depolymerization are shown in Table 1.
| Operating Conditions | Values | Units |
|---|---|---|
| H O/PET ratio 2 | 05:01 | |
| Temperature | 240 | °C |
| Pressure | 32 | Bar |
| Residence time | 2 | Hr |
| Catalyst/PET mass ratio - [Zn(Ac) :PET] 2 | 0.09375 | |
| PET particle size | 20 | Mm |
Table 1: Process Simulation Input Parameter data.
Modelling data for the distillation column (a radfrac column in Aspen Plus software) aimed at recovering water (H2O) from its mixture with ethylene glycol (EG) and terephthalic acid (TPA) in the context of the neutral hydrolysis process for PET depolymerization is given in Table 2. The process equipment modelled in addition to the CSTR and Distillation Column include a separator, heat exchangers and pumps.
| Distillation Column Configuration | CSTR | ||
|---|---|---|---|
| Equipment Specification | Value | Equipment Specification | Value |
| Number of stages; Feed Stage (above) | 7; 4 | Volume (m3) | 266.26 |
| Condenser Type; Reboiler Type | Total; Kettle | Pressure ( bar) | 32 |
| Reflux Ratio (mass) | 1 | Temperature (°C) | 240 |
| Distillate to Feed Ratio (mole) | 0.991 | Catalyst Loading (kg) | 14.925 |
| Condenser Pressure (atm) | 1 | Bed Voidage | 0.9 |
Table 2: Configuration for both the Distillation Column and Reactor.
The process which involved the production of TPA from plastic waste (PET) through neutral hydrolysis modelled using the Aspen Plus software is described as follows. The feed to the process was 1000 kg/hr of PET at 25°C and 1 bar which required 5000 kg/hr of water at 25°C and 1 bar as well. Both components were pumped and heated to the operating conditions of the reaction which was 32 bar and 240°C respectively before they were fed into the reactor. The reactor operated based on the kinetic parameters specified as regards the production of TPA from PET. The TPA and EG produced by the reactor were then sent into a separator that separates them from the unreacted PET. The top product outlet of the separator which contained the produced TPA was sent into a valve that reduced its pressure to 2 bar before it was fed into the distillation column. The distillation column separated the desired TPA from other unwanted components such as ethylene glycol and water. The purified TPA was then sent into a cooler where its temperature was reduced to 25°C. Process parameters like temperature and pressure were varied using the sensitivity analysis feature of the software to optimize the production of TPA in the reactor.
The following specifications and restrictions were made to this simulation.
- The experimental method by Liu, et al. [1] and simulation by Raheem and Edeh [22] were adopted regarding the ratio of PET to water as well as operational variables like temperature and pressure.
- The TPA yield was the focus of the simulation in the CSTR, which also included consideration of the effects of reaction time, the PET to water ratio, reaction temperature, and catalyst concentration. As a result, the conversion was standardised using the minimum and maximum conversion values discovered through experimental work carried out under identical experimental settings.
- It was assumed that the reaction only moved forward (irreversible) and water was in excess. Water serves as the hydrolysis agent.
- Sensitivity analysis was performed for PET conversion, and TPA yield to allow for parameter changes such as temperature, pressure, water/PET ratio and reaction time that affect the process as this helps to control and optimize the system effectively.
- Percentage PET conversion and TPA yield were defined by following equations:
( ) ( ) ( )
Initial PET weight-Residual PET weight PET conversion % = ×100 Initial PET weight (1) ( ) ( ) ( ) TPA weight obtained by hydrolysis TPA yield % = ×100 Initial PET weight-Residual PET weight (2) ( ) ( ) Mass or moles of TPA formed TPA Selectivity % = ×100 Total mass or moles of all products formed (3) ( ) ( ) Mass or moles of EG formed EG Selectivity % = ×100 Total mass or moles of all products formed (4) The process flow diagram for the PET depolymerization of bottle trash through neutral hydrolysis, which produces terephthalic acid, is shown in Figure 3 below.
![Figure 2: Chemical reaction for PET depolymerization via neutral hydrolysis [7].](/fulltextimages/13150/fig_2.png)
Optimization Study
Using response surface methodology and the gradient approach similar to the works by Owolabi et al. [23], PET hydrolysis was optimized. The optimal conditions for the hydrolysis of polyethylene terephthalate (PET) were determined by utilizing the Box-Behnken design. This design was used as opposed to Central Composite Design as it addresses the issue of appropriate experimental boundaries as well as avoids the inclusion of extreme combinations [24]. Four independent variables were the independent variables of the study: reaction temperature (varied from 150 to 300ºC; specifically, 150, 165, 225, and 300ºC), reaction duration (varied from 15 to 120 min; specifically, 15, 30, 67.5, and 120 min), water to PET mass ratio (varied from 1:1 to 10:1; specifically, 1:1, 5.5:1, and 10:1), and pressure (varied from 10 to 50 bar; specifically, 10, 20, 30, and 50). Two centre point experiments were used in a 29-run Box-Behnken design, and each experiment was run once. TPA yield and PET conversion were the two dependent variables selected as responses. To compute the regression model and carry out an analysis of variance (ANOVA), Statistica software was utilized for data analysis at a significance level of 5%.
Results and Discussion
Following the process simulation workflow outlined in above, PET conversion of 94.75% was attained, resulting in a TPA yield of 95.5%, PET conversion of 94.75% and an EG yield of 64.27%. The remaining unreacted material accounted for just 5.25%. Based on stoichiometry, the expected produced quantities were 864.58 kg for TPA and 322.92 kg for EG. The selectivity values, as presented in Table 3, indicate a selectivity of 0.799 for TPA and 0.201 for EG. These findings demonstrate that the reaction predominantly produces the desired hydrolyzed product (TPA) while minimizing the unwanted byproduct of EG. The high selectivity for TPA underscores the efficiency and cost-effectiveness of the process. It is important to note that achieving this high PET conversion and TPA yield typically requires elevated temperature of 240ºC and 32 bar pressure over an extended 2 hours’ duration, water to PET (5:1) and catalyst to PET (1:75).
Sensitivity of TPA Yield and PET conversion to Key Reaction Parameters
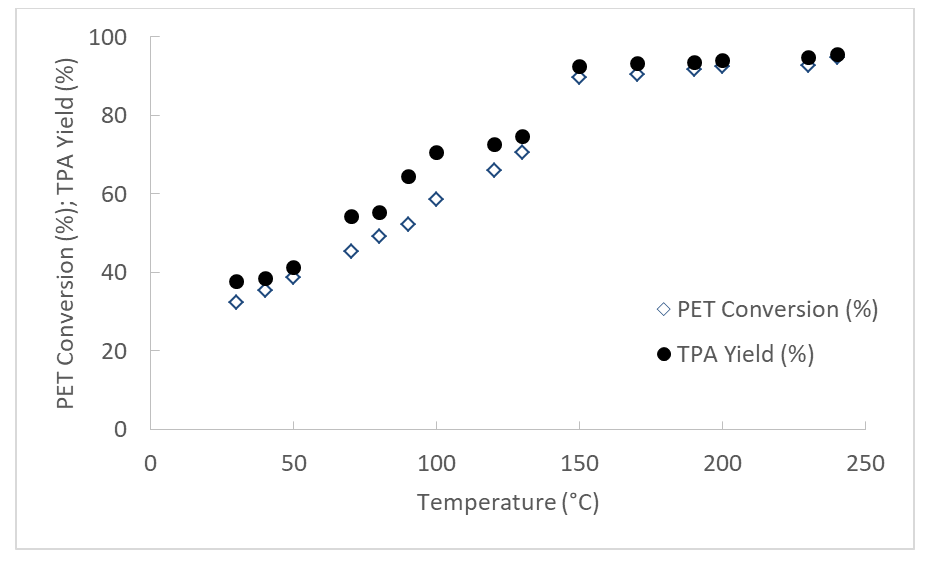
Effect of Reaction Temperature: The analysis showed a strong correlation between temperature, reaction time, TPA yield, and PET conversion in the depolymerization process. At lower temperatures (30-70°C), PET depolymerization proceeded at a very slow rate, requiring more time to achieve the desired level of depolymerization. TPA yield and PET conversion rates gradually increased, indicating that thermal energy is essential for initiating the process. This agrees with, Ugduler, et al. [25] that observed that temperatures below 50°C lacked sufficient thermal energy to initiate PET hydrolysis.
Beyond a specific temperature threshold (150°C), a significant rise in PET conversion and TPA yield occurred due to rapid reaction kinetics, achieving maximum conversion in a shorter timeframe. This threshold suggested a breach in the activation energy barrier, leading to an accelerated reaction rate. TPA yield closely followed the temperature increase, showing a gradual rise initially followed by a more pronounced ascent. The temperature of 240°C was identified as the point of maximum TPA yield, highlighting the critical impact of temperature on reaction efficiency.
Conversely, operating at temperatures exceeding 240°C favoured secondary reactions, such as thermal oxidative degradation of PET and intermolecular dehydration of ethylene glycol (EG). These secondary reactions, occurring at elevated temperatures, could complicate subsequent purification processes as was observed by Liu, et al. [15]. The findings underscore the intricate relationship between temperature, reaction kinetics, and the overall efficiency of the PET depolymerization process as shown in Figure 4.
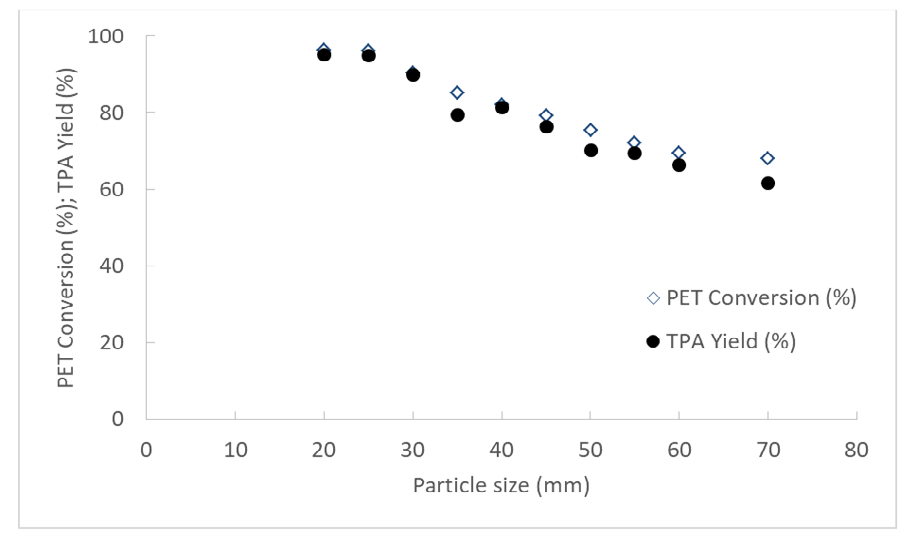
Effect of PET particle size: During a 2-hour reaction at 240ºC, it was observed that as particle size is decreased, both PET conversion and TPA yield showed increased significantly (Figure 5). These results were expected since smaller particle size PET feedstocks provide a larger reaction surface area, resulting in a faster reaction rate and higher PET conversion rates. Accordingly, by lowering the particle size, saw a comparable improvement in PET conversion as also reported by Ugduler, et al. ([25] and Liu, et al. [26]. For instance, 18.5 mm particles produced a PET conversion and TPA yield of about 97% and 96% respectively, whereas 140 mm particles had a significantly lower PET conversion rate and TPA yield of 45% and 47% respectively. This finding is crucial for the practical application of PET neutral hydrolysis in industrial settings because it raises the possibility of a partial cost reduction for energy-intensive grinding required to produce smaller particle sizes.
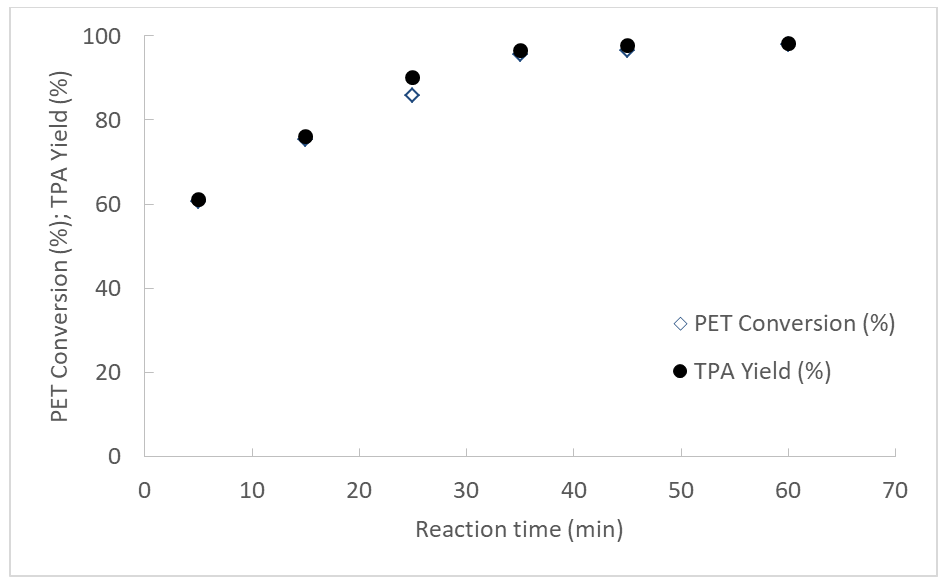
Effect of Reaction Time: Investigating the impact of reaction time on the depolymerization process, within the time frame of 5 to 60 minutes at various temperature ranges between 200 and 250 degrees Celsius. With a Zn(Ac)2/PET ratio of 1:70 and pressure of 50 bar, the simulation was run. Figure 6 shows the results of PET depolymerization carried out at temperatures above 200ºC with the yield of TPA and the depolymerization of PET both showed an appreciable increase with increasing reaction durations especially with a notable increase in yield between 15 and 45 minutes. It is noticed that, at a short reaction time of 10 min, there is incomplete hydrolysis of PET into its monomers. This resulted in a lower yield of terephthalic acid of (61.19%). More depolymerization, or the breaking down of more PET polymer chains into monomers, usually results from longer reaction times. By extending the reaction time, purer monomers are produced by ensuring that the depolymerization step is completed. Similarly, Liu, et al. [15] observed an increase in TPA yield of about 73% when reaction time was increased to 60 min from 5 min at 220ºC.
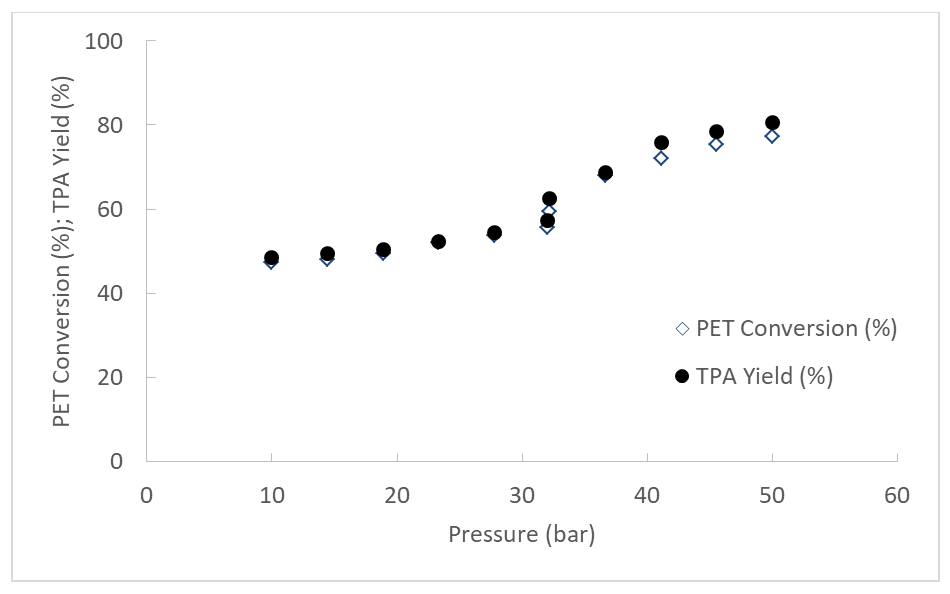
Effect of Reaction Pressure: Echoing the findings on the effect of temperature on PET conversion and TPA yield, PET depolymerization demonstrated sensitivity to pressure variations. Higher pressure conditions consistently yielded higher TPA concentrations and PET conversion at a constant temperature of 240ºC, indicating a direct influence of pressure on reaction efficiency. It is observed that at a low pressure of 10 bar, reaction did not proceed as efficiently as a low percentage PET conversion and TPA yield of 47.23% and 48.58% respectively were obtained, while an increase in pressure enhanced the contact between the reactants and the catalyst, potentially leading to a more efficient depolymerization reaction. The results underscore the importance of pressure as a parameter for optimizing TPA production (Figure 7). Mishra, et al. [20] reported an increase in the rate of depolymerization with pressure. However, the pressure effect was highly dependent on the reaction temperature with increased TPA yield observed at higher temperatures.
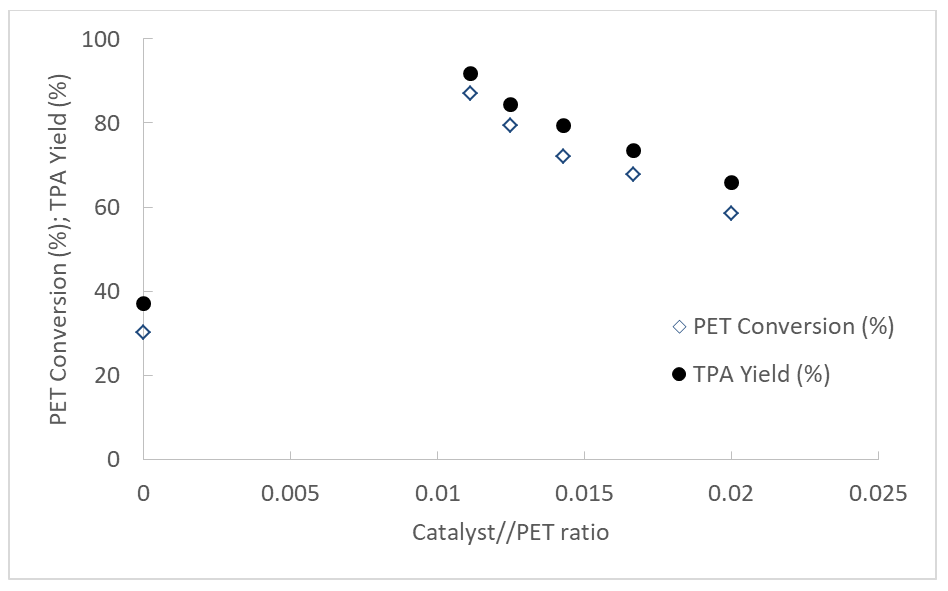
The influence of the Zn(AC)2 to PET ratio on the PET depolymerization process: Sensitivity was carried out utilizing Zn(Ac)2 to PET ratios ranging from 1:50 to 1:90, as well as in the absence of catalyst, at temperatures between 200 and 250 °C and reaction times between 15 min and 120 min to examine the effect of Zn(Ac)2 concentration on depolymerization. With the exception of 250°C, when PET conversion and TPA yield were low because of the absence of Zn(Ac)2, it was observed that both PET conversion and TPA production increased with increasing catalyst to PET rations between 200 and 240°C. While Campanelli, et al. (1994) [14] reported only modest increase in depolymerization due to presence of zinc acetate, Guclu, et al. [11] noted that high water to PET ratios could mask the effect of the catalyst. Guclu, et al.[11] observed significant depolymerization in presence of zinc acetate. Figure 8 shows that increasing the catalyst to PET ratio resulted in a corresponding gradual increase in both TPA yield and PET conversion. The presence of catalysts provides a different, lower-activation-energy reaction pathway, which speeds up the depolymerization step. Faster PET breakdown as a result is advantageous for industrial processes. The trend is consistent regardless of the residence time as shown below. The decline to 30.29% PET conversion and 37.12% TPA yield shown to the left of Figure 8 is due to absence or total catalyst consumption at 250°C as was similarly reported by Liu, et al. [15]. The catalyst to PET ratio increases from right to left.
Optimizing the PET Hydrolysis Process via Response Surface Modelling
The optimal conditions for the hydrolysis of polyethylene terephthalate (PET) were determined by utilizing the Box- Behnken design in Response Surface Methodology. Four independent variables were examined, including reaction temperature, pressure, time, and water to PET ratio. TPA yield and PET conversion were the two dependent variables. These four variables were represented mathematically to estimate the PET yield using a regression model. Analysis of variance was used to evaluate the dependability of the model.
A very high TPA yield of 96.23% and PET conversion of 94.96% were attained under optimal operating conditions (temperature, time, water to PET mass ratio, and pressure of 225°C, 67.5 min, 5.5:1, and 30 bar respectively) as highlighted in Table 3.
Creation of a regression model: A non-linear regression model (Equation 5) that captures the correlation between the coded values of the four independent components and the TPA yield (Y) response was developed based on the experimental runs from the Box-Behnken design in Table 3.
Y=71.48+18.22A+13.97B-0.7383C+D+6.79AB-2.44AC-2.56AD-0.2075BC+0.085BD-0.4975CD-13.52A2-13.14B2-1.48C2- 0.0413D2 (5)
| Run | Factor1 | Factor 2 | Factor 3 | Factor 4 | Response 1 | Response 2 |
|---|---|---|---|---|---|---|
| A: Temp. (ºC) | B: Time (mins) | C: Pressure (bar) | D:Water/Pet Ratio | % PET Conversion | Y: % TPA Yield | |
| 1 | 165 | 120 | 30 | 1 | 69.76 | 72.09 |
| 2 | 225 | 30 | 30 | 1 | 76.45 | 78.07 |
| 3 | 165 | 15 | 30 | 1 | 42.05 | 52.14 |
| 4 | 165 | 67.5 | 10 | 1 | 70.89 | 71.21 |
| 5 | 225 | 67.5 | 30 | 1 | 79.92 | 82.65 |
| 6 | 300 | 67.5 | 50 | 5.5 | 87.01 | 92.56 |
| 7 | 300 | 67.5 | 30 | 5.5 | 71.48 | 85.87 |
| 8 | 150 | 120 | 50 | 5.5 | 43.01 | 44.16 |
| 9* | 225 | 67.5 | 30 | 5.5 | 94.96 | 96.23 |
| 10 | 165 | 67.5 | 30 | 5.5 | 74.23 | 77.44 |
| 11 | 150 | 67.5 | 30 | 5.5 | 66.96 | 72.08 |
| 12 | 300 | 30 | 20 | 5.5 | 77.76 | 79.08 |
| 13 | 150 | 67.5 | 10 | 5.5 | 43.24 | 45.43 |
| 14 | 165 | 67.5 | 50 | 5.5 | 68.9 | 72.11 |
| 15 | 165 | 120 | 10 | 5.5 | 75.32 | 81.06 |
| 16 | 300 | 120 | 30 | 5.5 | 84.89 | 88.72 |
| 17 | 300 | 15 | 30 | 5.5 | 90.26 | 93.37 |
| 18 | 165 | 15 | 10 | 5.5 | 37.67 | 50.2 |
| 19 | 165 | 67.5 | 10 | 5.5 | 67.88 | 72.29 |
| 20 | 165 | 15 | 20 | 5.5 | 34.11 | 43.11 |
| 21 | 225 | 15 | 30 | 5.5 | 85.96 | 94.13 |
| 22 | 165 | 15 | 50 | 5.5 | 72.43 | 75.14 |
| 23 | 300 | 67.5 | 30 | 10 | 71.43 | 75.67 |
| 24 | 225 | 67.5 | 10 | 10 | 46.87 | 53.22 |
| 25 | 165 | 67.5 | 30 | 10 | 60.96 | 62.76 |
| 26 | 165 | 67.5 | 20 | 10 | 79.67 | 83.12 |
| 27 | 165 | 120 | 20 | 10 | 72.01 | 74.21 |
| 28 | 165 | 120 | 30 | 5.5 | 64.11 | 71.42 |
| 29 | 165 | 67.5 | 50 | 10 | 72.43 | 73.06 |
Table 3: Box-Behnken design matrix for experimental TPA yields (%).
The regression model’s goodness-of-fit is highlighted by the values of R2 and adjusted R2 being very close to unity. Additionally, as an earlier study by Rai, et al. [27] had indicated, a difference between the adjusted R2 of 0.9983 and the predicted R2 of 0.9960 less than 0.2 proves the model’s reliability. The required threshold of 4 is also exceeded for the acceptable precision, which calculates the signal-to-noise ratio. This demonstrates that, given the specified design space, the regression model is appropriate for predicting the response variable in this case, the TPA yield. The regression model can thus be used for optimization purposes (Table 4).
| Statistic | Value |
|---|---|
| Standard Deviation | 0.7271 |
| Mean | 59.82 |
| Coefficient of Variation | 1.22% |
| Adequate Precision | 123.0957 |
| Predicted R² | 0.996 |
Table 4: Fit statistics of the regression model.
Table 5 below displays the results of the response surface model’s analysis of variance (ANOVA). When a term’s corresponding p-value is less than 0.05, it is considered statistically significant. Moreover, a term’s larger F-value indicates that it has a significant influence on the response of the model. Except for (BC, BD, CD, and D2), it can be concluded that every main effect and most of the interaction effects in the regression model represented by Equation 5 above demonstrated statistical significance.
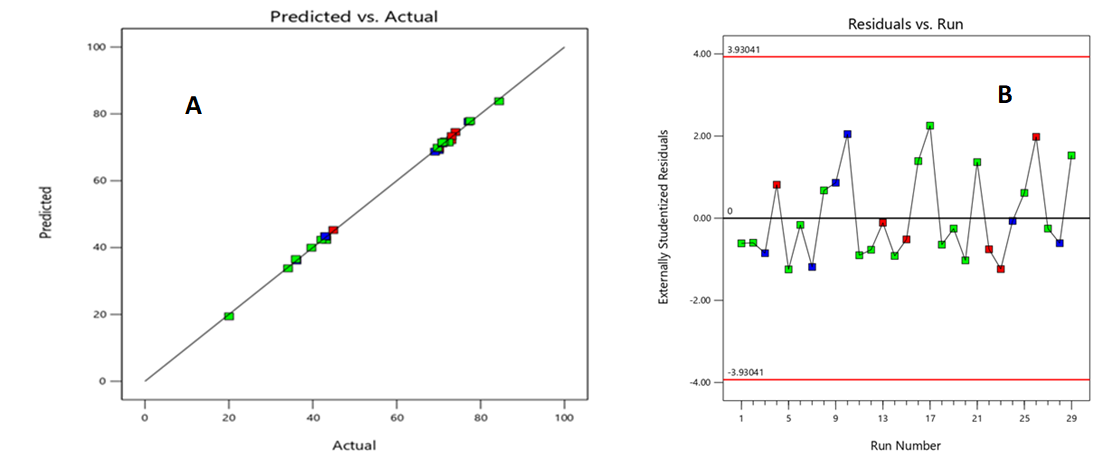
The linear correlation graph Figure 9A shows a high degree of correlation between observed and expected response variables while a substantial percentage of the response variances are satisfactorily explained by the non- linear model. The residuals are well distributed between -1.5 and 2.5 (Figure 9B).
| Source of variation | Sum of Squares | df | Mean Square | F-value | p-value |
|---|---|---|---|---|---|
| Model* | 8671.59 | 14 | 619.4 | 1171.61 | <0.0001 |
| A-Temperature | 3981.8 | 1 | 3981.8 | 7531.67 | <0.0001 |
| B-Time | 2341.65 | 1 | 2341.64 | 4429.29 | <0.0001 |
| C-Pressure | 6.54 | 1 | 6.54 | 12.37 | 0.0034 |
| D-Water/PET | 12.08 | 1 | 12.08 | 22.85 | 0.0003 |
| AB | 184.42 | 1 | 184.42 | 348.83 | <0.0001 |
| AC | 23.91 | 1 | 23.91 | 45.23 | <0.0001 |
| AD | 26.16 | 1 | 26.16 | 49.49 | <0.0001 |
| BC | 0.1722 | 1 | 0.1722 | 0.3258 | 0.5772 |
| BD | 0.0289 | 1 | 0.0289 | 0.0547 | 0.8185 |
| CD | 0.99 | 1 | 0.99 | 1.87 | 0.1927 |
| A2 | 1185.67 | 1 | 1185.67 | 2242.72 | <0.0001 |
| B2 | 1119.53 | 1 | 1119.53 | 2117.61 | <0.0001 |
| C2 | 14.28 | 1 | 14.28 | 27.01 | 0.0001 |
| D2 | 0.011 | 1 | 0.011 | 0.0209 | 0.8872 |
| Residual | 7.4 | 14 | 0.5287 | ||
| Lack of fit** | 5.59 | 10 | 0.5594 | 1.24 | 0.4523 |
| Pure error | 1.81 | 4 | 0.4519 | ||
| Total | 8678.99 | 28 |
Table 5: ANOVA for the non-linear regression response surface model.
* Significant; ** Not significant Table 5: ANOVA for the non-linear regression response surface model.
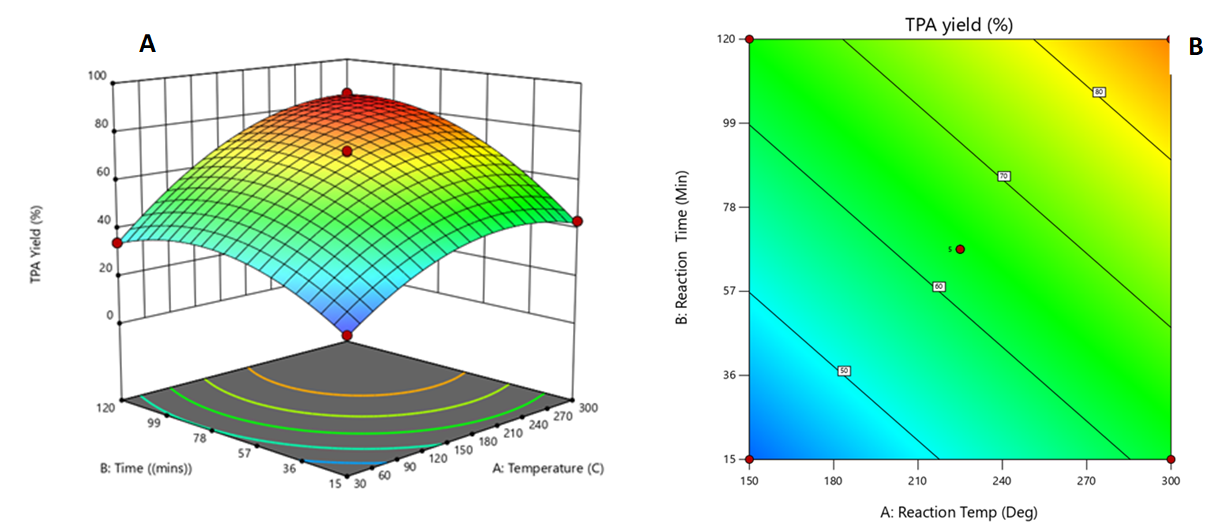
Analysis of response surfaces: A chemical reaction is impacted by a variety of interrelated elements in addition to single ones. Making three-dimensional response surfaces is helpful to better understand these interaction effects. Equation 8 above defines these surfaces, which show the relationship between two components while holding the others constant. Figure 10A visually shows the interaction between reaction temperature (factor A) and reaction time (factor B) in determining TPA yield. The yield tended to exhibit an increase in tandem either other factor as either the reaction temperature or duration increased until attaining an optimum. Matching the contour plot Figure 10B with the 3D response surface plot clearly shows the optimum reaction time and temperature of 67.5 min and 225°C respectively with the Water to PET ratio and reaction pressure fixed at 5.5:1 and 30 bar respectively. Increasing TPA yield is shown as progressively from blue to green to yellow to pink to red in both Figures 10A and Figure 10B.
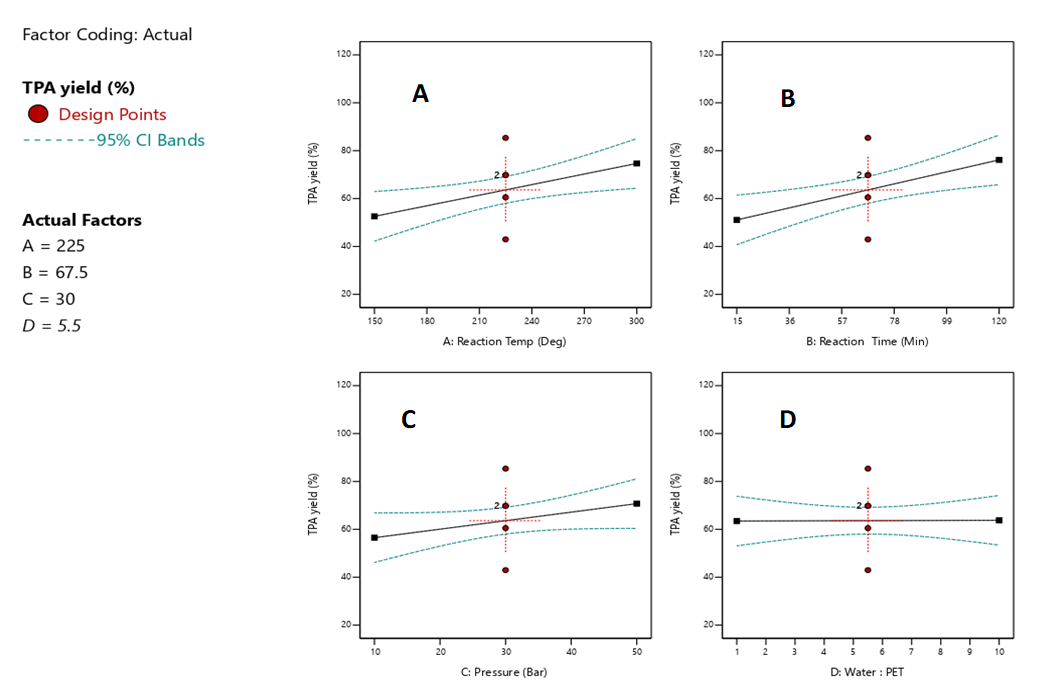
The principal effects of each independent component are depicted in Figure 11. In general, the distinct parameters caused noticeable variances in the TPA yield and PET conversion. Through an examination of the responses at both extremes and the middle point (shown by the intersection in Figure 10A and Figure 10B in the investigated range, it was clear that reaction temperature and reaction time had a greater impact on yield and conversion than pressure and the mass ratio of PET to water. It is noted that in the regression model (Equation 8), the coefficients for the main effects A and B were comparatively bigger than those for the main effects C and D.
Conclusion
This study explores response surface modelling for obtaining optimal parameters for sustainable waste PET bottle chemical recycling through neutral hydrolysis, an environmentally friendly method, to reduce the negative environmental impact of PET disposal. This research aligns with the circular economy’s principles by reducing waste and extending the life cycle of PET materials, contributing to the goal of reducing single-use plastics and promoting sustainable practices. Process simulation of PET depolymerization into TPA through neutral hydrolysis for chemical recycling which addresses challenges in product mix separation, especially in PET bottle waste was carried out. Experimental data guided the simulations using Aspen Plus software with a CSTR. Sensitivity analysis unveiled insights into increased PET conversion and TPA yield with reduction in PET pellet sizes to as low as practicable (making allowance for faster hydrolysis), with non-linear increase in pressure and with increase in the catalyst to PET ratio. Sufficient reaction time is required for PET conversion however prolonged durations may result in diminishing TPA yield or undesired byproducts. A two-hour reaction at 240°C in a CSTR at 32 bar achieved a 94.75% conversion of 20 mm post-consumer PET particles, nearing complete depolymerization. TPA and EG production rates reached 95.50% and 64.27%, respectively, and with selectivity of 0.799 and 0.201 respectively. Response Surface Methodology using a Box-Behnken design was used to optimize the hydrolysis parameters for TPA yield. Optimal hydrolysis parameters were identified as temperature of 225°C, 67.5 mins reaction time, 30 bar pressure, and a 5:1 water to PET ratio, resulting in a 94.96% TPA yield and a 96.23% PET conversion rate. These findings provide a baseline for efficient pilot production TPA from depolymerize PET via neutral analysis.
Declarations
Availability of data and materials: “All data generated or analysed during this study are included in this published article”.
Competing Interests
“The authors have no relevant financial or non-financial interests to disclose.”
Funding
“The authors declare that no funds, grants, or other support were received during the preparation of this manuscript”.
Authors’ Contributions
“OK performed process simulations and analysed the data regarding experimental Terephthalic Acid yields for response surface modelling. OO designed the study and was a major contributor in writing the manuscript. All authors read and approved the final manuscript.”
Acknowledgements
“The authors acknowledge the support of the Department of Chemical and Petroleum Engineering, Faculty of Engineering, University of Lagos”.
References
-
Nistico R (2020) Polyethylene terephthalate (PET) in the packaging industry. Polymer testing 90: 106707.
-
Dhaka V, Singh S, Anil AG, Naik TSSK, Garg S, et al. (2022) Occurrence, toxicity and remediation of polyethylene terephthalate plastics. A review. Environ Chem Lett 20: 1777-1800.
-
Kibria MG, Masuk NI, Safayet R, Nguyen HQ, Mourshed M (2023) Plastic Waste: Challenges and Opportunities to Mitigate Pollution and Effective Management. Int J Environ Res 17: 20.
-
Kehinde O, Ramonu OJ, Babaremu KO, Justin LD (2016) Plastic wastes: environmental hazard and instrument for wealth creation in Nigeria. Heliyon 6(10): e05131.
-
Olamigoke O (2023) The Presence of Microplastics in Ocean Waters and Deep Marine Sediments: Implications for the Gulf of Guinea. Current Trends in Eng Sci 3(1): 1022.
-
Beghetto V, Sole R, Buranello C, Al-Abkal M, Facchin M (2021) Recent Advancements in Plastic Packaging Recycling: A Mini-Review. Materials 14(17): 4782.
-
Benyathiar P, Kumar P, Carpenter G, Brace J, Mishra DK (2022) Polyethylene Terephthalate (PET) Bottle-to- Bottle Recycling for the Beverage Industry: A Review. Polymers 14(12): 2366.
-
Ghosal K, Nayak C (2022) Recent advances in chemical recycling of polyethylene terephthalate waste into value added products for sustainable coating solutions -hope vs hype. Mater Adv 3(4): 1974-1992.
-
Al-Sabagh M, Yehia FZ, Eshaq G, Rabie AM, ElMetwally AE (2016) Greener routes for recycling of polyethylene terephthalate. Egyptian Journal of Petroleum 25(1): 53- 64.
-
Abedsoltan H (2023) A focused review on recycling and hydrolysis techniques of polyethylene terephthalate. Polym Eng Sci 63(9): 2651-2674.
-
Guclu G, Yalcinyuva T, Ozgumus S, Orbay M (2003) Hydrolysis of waste polyethylene terephthalate and characterization of products by differential scanning calorimetry. Thermochimica Acta 404(1-2): 193-205.
-
Cata A, Miclau M, Ienascu I, Ursu D, Tanasie C, et al. (2015) Chemical recycling of polyethylene terephthalate (PET) waste using sub-and supercritical water. Rev Roum Chim 60(5-6): 579-585.
-
Pereira P, Savage PE, Pester CW (2023) Neutral hydrolysis of post-consumer polyethylene terephthalate waste in different phases. ACS Sustainable Chemistry & Engineering 11(18): 7203-7209.
-
Campanelli JR, Cooper DG, Kamal MR (1994) Catalyzed hydrolysis of polyethylene terephthalate melts. J Appl Polym Sci 53(8): 985-991.
-
Liu Y, Wang M, Pan Z (2012) Catalytic depolymerization of polyethylene terephthalate in hot compressed water. J of Supercritical Fluids 62: 226-231.
-
Warsahartanaa H, Bashir A, Keyworth A, Davies R, Falkowska M, et al. (2023) Catalytic Steam Hydrolysis of Polyethylene Terephthalate to Terephthalic Acid followed by Repolymerisation. Chemical Engineering Transactions 100: 445-450.
-
Stanica-Ezeanu D, Matei D (2021) Natural depolymerization of waste poly(ethylene terephthalate) by neutral hydrolysis in marine water. Sci Rep 11: 4431.
-
Mancini SD, Zanin M (2004) Optimization of neutral hydrolysis reaction of post-consumer PET for chemical recycling. Prog Rubber Plast Recycl Technol 20(2): 117- 132.
-
Mancini SD, Nogueira AR, Rangel EC, da Cruz NC (2013) Solidstate hydrolysis of postconsumer polyethylene terephthalate after plasma treatment. J Appl Polym Sci 127(3): 1989-1996.
-
Mishra S, Zope VS, Goje AS (2003) Kinetics and Thermodynamics of Hydrolytic Depolymerization of Poly (ethylene terephthalate) at High Pressure and Temperature. Journal of Applied Polymer Science 90(12): 3305-3309.
-
Han M (2019) 5 -Depolymerization of PET Bottle via Methanolysis and Hydrolysis, In: Thomas S, et al. (Eds.), Recycling of Polyethylene Terephthalate Bottles. William Andrew Publishing, Norwich, New York, United States, pp: 85-108.
-
Raheem BA, Edeh I (2023) Process Simulation of Terephthalic Acid Using Neutral Hydrolysis of Polyethylene Terephthalic Bottle Waste Method. Petro Chem Indus Intern 6(2): 118-130.
-
Owolabi RU, Usman MA, Kehinde AJ (2018) Modelling and optimization of process variables for the solution polymerization of styrene using response surface methodology. Journal of King Saud University - Engineering Sciences 44(4): 987-1001.
-
Wu L, Yick K, Ng S, Yip J (2012) Application of the Box-Behnken design to the optimization of process parameters in foam cup molding. Expert Systems with Applications 39(9): 8059-8065.
-
Ugduler S, Van G, Denolf R, Roosen M, Mys N (2020) Towards closed-loop recycling of multilayer and coloured PET plastic waste by alkaline hydrolysis. Green Chem 22: 5376-5394.
-
Liu F, Cui X, Yu S, Li Z, Ge X (2009) Hydrolysis reaction of poly(ethylene terephthalate) using ionic liquids as solvent and catalyst. J Appl Polym Sci 114: 3561-3565.
-
Rai A, Mohanty B, Bhargava R (2016) Supercritical extraction of sunflower oil: A central composite design for extraction variables. Food Chem 192: 647-659.
- Nigeria’s Vulnerability in the Face of Global Energy Policy
- A Simulation Study of Investigation of Optimum Oil Production Performance by Applying Various Gas Injection Methods in Oil Reservoir
- Characterization of Permo-Triassic Reservoirs through Thermal Maturity Assessment of Westphalian Source Rocks in the Cheshire Basin
- Influence of Microwax on the Rheological and Thermal Behaviour of a Wax Crude Oil
- Real-Time Monitoring and Performance Optimization of Steam Injection in Heavy Oil Reservoirs Using Fiber Optic Sensing and Integrated Predictive Simulation Models
- Rapid On-Site Determination of the Total Petroleum Hydrocarbon Content of Soils by Handheld Fourier Transform Near-Infrared Spectroscopy: Development of a Global, Site- and Scanner- Independent Calibration Model