Positive Driver Behaviours Scale: Adaptation and Validation for Brazil
The objective was to carry out an adaptation of the Positive Driver Behavior Scale for Brazilian drivers, and to see if it would be possible to propose a reduced measure. The instrument called the Positive Driving Behavior Scale, originally composed of 38 items, was applied to 204 drivers in the northeastern region of Brazil, most of them men (65.7%), with an average of 35.6 years old. The results showed the possibility of a single factor structure, consisting of a total of 19 items, and Cronbach’s alpha = 0.90, explaining 37.9% of the total variation. The relevance of this measure is highlighted, providing a tool capable of measuring behavior in traffic, supporting traffic professionals and psychologists, instrumentalizing practices, as well as offering an understanding of the transport phenomenon, which can facilitate the development of effective measures to prevent accidents.
Introduction
In the first decade of the 2000s, the Brazilian vehicle fleet had a substantial increase – according to data from the Instituto Nacional de Ciência e Tecnologia [1]. Also according to the INCT, motorcycles went from almost 34.9 million units in 2001 to 76.137.125 million in 2012, representing an increase of 218.1%, with a population growth of 11.8%, according to data from the Instituto Brasileiro de Geografia e Estatística [2].
Consequently, linked to this process, the number of victims in traffic accidents increased by approximately 40% between 2002 and 2012, according to the 2014 Map of Violence [3]. In general, the epidemiological profile of these victims is that of young people (under 30 years old), primarily males (Departamento Nacional de Infraestrutura de Transportes [DNIT, National Transportation Infrastructure Investigation Paper Department], 2011), corroborating the indication that vehicle traffic is configured as a serious global public health hazard [4].
Regarding research on factors associated with accidents and the consequent indications of traffic mortality, it is possible to verify a significant divergence. In Brazil, between 1996 and 2015, a total of 264,643 people aged 10-29 years died in traffic accidents, which means that from 1996 to 2015, an average of 36 young people died every day, reinforcing the understanding that young people are one of the most affected groups among the population [5].
Santos AMR de, et al. [6] believe that the increase in the number of accidents with elderly individuals, as well as the occurrence of deaths, can be credited to a multiplicity of factors, which are the anatomical and functional changes linked to accidents, in addition to association with possible pre-existing conditions. These indications show that the studies are not conclusive with regard to behavior in traffic, which raises the discussion about the quality of the process of obtaining a license in Brazil, although the Psychological Assessment (PA) process is indicated as an important tool in the process acquisition of the National Driver’s License (NDL), through Resolution 01/2019 of the Conselho Federal de Psicologia (CFP, Federal Council of Psychology). This is because the human factor can be seen as the main subsystem when assessing traffic [7].
Such statement can be confirmed when, for example, immature adolescent behaviors are assessed, such as feeling of omnipotence, overestimation of their abilities, little experience and ability to drive, in addition to risky behaviors, that are configured as risk factors for involvement in a traffic accident [5]. Thus, it is possible to reach the conclusion that to better understand the traffic scenario it is necessary to assess people and their behaviors.
Therefore, PA techniques used by traffic psychologists have the function of assisting in the identification of the desirable psychological attributes for correctly and safely driving a vehicle, ensuring not only the driver’s safety, but also traffic safety and of all others involved [8]. To support this process, psychological tests are resources used in order to predict the ability to drive, particularly in the sense of predicting the likelihood of an individual being involved in accidents [9]. However, there are few studies regarding the adequacy and standardization of the instruments used to assess drivers.
In Brazil, although drivers’ assessment has been mandatory for decades, there are no studies on the effectiveness of the assessment process, or even studies on the results of these tests that could help to outline a profile of drivers, which can assist in the identification of demands and construction of effective public policies. From the beginning, when the driver’s PA process was known as a psychometric test applied to traffic, psychology professionals were no longer able to accurately answer what they could observe in the tests that characterize the aptitude or lack thereof for obtaining a license [10].
In an attempt to coordinate the drivers’ psychological assessment, Resolution 01/2019 of the Conselho Federal de Psicologia defines the criteria to be considered in this assessment process, namely: information making, information processing, decision making, behavior, behavior self-assessment, and personality traits. With regard, for example, to personality traits, it is evident that with the assessment of such construct it is possible to identify groups of drivers with high-risk profiles for involvement in accidents and traffic violations [11].
Thus, it is understood that it is not possible to neglect the use of such aspects in the PA of drivers. Hence, the instrumental scientific basis of the validity of criteria seeking to demonstrate a given aspect or construct can be seen as basic and necessary in the drivers’ assessment process. However, there is no consensus on the most appropriate instruments to be used in PA in traffic, and the regional Traffic Departments decide which instruments should be used.
Regarding the assessment of behavioral aspects, it is possible to point out some psychometric instruments, such as the study by Coelho RPS, et al. [12] who translated and adapted the Motorcycle Rider Behavior Questionnaire for the Brazilian version, although not presenting their psychometric studies. Another measure is the study by Veiga HM da S, et al. [13] who adapted and validated the Driver Behavior Questionnaire (DBQ) for the Brazilian reality, presenting a complete structure, psychometric validation process, composed of three factors (errors, lapses, and violations), but that was too long, not respecting the principle of parsimony.
In the international scenario, since 1986 it has been possible to identify psychometric-based studies in the literature, such as the research by Rushton et al., [14] developing the Altruism and Aggression: The Heritability of Individual Differences measure, to assess altruistic behavior in vehicle drivers, identifying the existence or lack of a concern for the other, being possible to assess the profile of the drivers. This research seems to highlight a factor that has not been evidenced as a relevant construct in traffic, which seems to be a serious mistake, considering that the concern for others can reduce the incidence of accidents.
Another factor related to traffic behavior assessed through a scale was impulsivity, using the Impulsive Driver Behavior Scale [15], consisting of motor impulsiveness, impulsive attention, lack of impulsive planning. Impulsiveness was understood in this study as the ability to act impulsively or inconsequentially. One measure that seems to assess a similar construct is the measure by Zhang, Houston, and Wu (2016) which assesses the driver’s potential for aggressiveness.
Ostapczuk M, et al. [16] validated a version of the Driver Skills Inventory and the Driver’s Social Desire Scale for Germany. Such measures were able to assess the driving behavior dimensions, with good psychometric properties, however their focus is on the study of drivers’ personality even though it can be used in studies of applied traffic.
Özkan T, et al. [17] validated the Positive Driver Behavior Scale (PDB) measure, which measures positive traffic behaviors. This measure has a structure similar to the structure of Veiga HM Da S, et al. [13] which, although quite similar structurally and published before, was not even mentioned in the referred research. The Özkan and Lajunen measure has three factors: errors, violations, and positive behaviors, with 38 items and 34.22% of explained variance.
Based on scientific and demographic evidences that characterize the influence of motivational and behavioral aspects of young users and the probability of traffic incidents and accidents, we sought to develop a study to present an instrument that could be used in the assessment of this population [5]. The problem that supports this investigation is to identify elements that can describe the main behavioral aspects in the scenario of risk and accident behaviors. Thus, assessing the current psychometric measures capable of explaining the traffic context, the Positive Behavior Scale by Özkan T, et al. [17] was used as a reference. Therefore, the objective of this study is to adapt and validate the Positive Behavior Scale (PBS) for the Brazilian context, focusing in a more synthetic structure.
Methods
This research is part of a broader study entitled “Elaboração e desenvolvimento de um protocolo de avaliação psicológica para condutores” (Elaboration and development of a psychological assessment protocol for drivers), approved by the Research Ethics Committee of the Hospital Universitário Onofre Lopes/ Universidade Federal do Rio Grande do Norte (HUOL/UFRN, Onofre Lopes University Hospital/ Federal University of Rio Grande do Norte), Certificado de Apresentação para Apreciação Ética (CAAE, Presentation Certificate for Ethical Appreciation) No. 42846614.2.0000.5292. For its development, a process of translation and cross-cultural adaptation was necessary, considering that cultural and regional realities may present discrepancies [18].
Participants
A total of 204 subjects voluntarily participated in the research, with an average age of 35.6 years (SD = 10.12; ranging from 22 to 62 years old), mostly males (65.7%). Also 67.2% reported having completed higher education, 50% of them being single, and 82% reported being part of the middle class. Among the most used types of vehicle, most drivers reported using the car as a means of transportation (76.5%). Most of them also informed that they only drove to get around (92%), not using the vehicle for work purposes.
When asked about how much they considered themselves defensive drivers, on a scale from 0 to 10, where zero would be not defensive at all and 10 very defensive, most answers were between 8 (32.8%) and 9 (35.3%). Although 63.7% indicated that they had already been in a traffic accident.
Instruments
The Driver Behavior Questionnaire by Veiga HM Da S, et al. [13], was used as an instrumental basis for the development of this research, as well as the Positive Driver Behavior Scale by Özkan T, et al. [17] and a sociodemographic questionnaire.
- Driver Behavior Questionnaire [13]- The DBQ was used to check the correlational potential with the PDB, aiming to obtain construct validity. It consists of 67 items, divided into three factors: errors, lapses, and violation. This measure uses a six-point Likert scale (never = 1, almost never = 2, occasionally = 3, with some frequency = 4, often = 5, almost always = 6).
- Positive Driver Behavior Scale [17]- The PDB was originally composed of 38 items. It has three factors: Violations, errors, and positive behaviors. No indications of internal measure consistency were identified. However, it presented a factorial structure, having been tested and validated, and presenting an explained variance of 34.22%.
- Sociodemographic questionnaire - This tool made it possible to get to know the participants better, being able to collect data such as sex, age, education, incidence of accidents, type of vehicles driven, and how much the drivers considered themselves to be defensive drivers.
Procedures and Data Analysis
This study respected all research ethics criteria, safeguarding anonymity and voluntary participation. The self-administered measures were conducted through online collection (social networks or e-mail), using the snowball method, where people invited to participate invited their acquaintances to contribute to the research.
The initial step was the process of translating and adapting the measure. This stage was divided into three consecutive moments. In the first stage, two translations of the original version were performed, independently translating the instrument into Portuguese. One of the translators was a bilingual person with expertise in psychometrics, and the second translator was a specialist in translating texts into Portuguese. The researchers tried to consider the original structure, however, still considering the indications of the assessors, the following items were excluded: 03, 06, 10, 25, 32, and 38. In the next step, it was tried to relate the two translations by uniting them based on the interpretation of two employees. The last step consisted of a detailed reading by the researcher responsible for the study, who is a specialist in traffic psychology and psychometrics, having chosen to exclude items 22, 34, and 36, in an attempt to make the instrument more parsimonious and comprehensive.
After this process of translation and adaptation, the measure still went through a stage of semantic analysis, bringing together a group of 10 people of different ages to respond to the instrument and indicate possible misunderstood terms. The necessary adjustments were made, and one more item was excluded (29). Before responding to the instrument, the participants read the first stage of the research, the Informed Consent Form, and, only after confirming their interest in participating, the research began. For data analysis, the SPSS statistical program, version 21, was used, with analyzes of frequency, means, standard deviation, in addition to correlational analyzes, t-test, exploratory factor analysis, and internal consistency.
Results
The first stage of the analysis was an analysis of the items discriminative power, carried out using a t-statistic. Such analysis allowed the researchers to be able to identify from the total sum of responses, and the creation of a criterion group based on the median of responses. From these criteria, scores above and below the median, it was identified whether the measure could discriminate between high or low scores. In this analysis, nine items (1, 4, 5, 7, 26, 27, 30, 31, 33) were excluded, leaving a total of 19 items.
The next step was to analyze the factorability of the matrix using the Kayser-Meyer-Olkin (KMO) sample adequacy test. The KMO works with the partial correlation indicator, with results above 0.70 being marginally acceptable results [19]. The measure showed that a KMO = 0.75 was considered meritorious. In addition, Barlett’s sphericity test was 3168.264 (gl = 171, p <0.001).
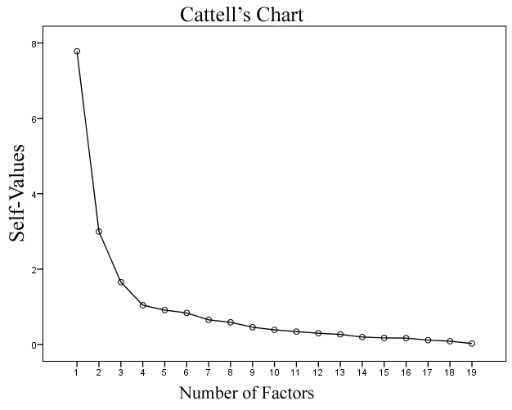
With these results, it was possible to run an exploratory factor analysis using the Main Axis Factorization method, being the first step to define the number of factors to be extracted from the measure. The criteria considered in this study were Kaiser’s criterion, Cattell’s criterion, and the Parallel Analysis criterion. In Kaiser’s criterion, it was possible to identify that the instrument could have up to four factors (7.77; 2.99; 1.65; 1.04), given that self-values equal to or greater than 1 in this criterion indicate the possibility of composing a factor. Cattell’s criterion indicated the possibility of the measure being composed of three factors, as can be seen in Figure 1.
Considering that the interpretation of the criteria already presented may not be accurate, the researchers decided to test a Parallel Analysis (Horn’s Criterion) that comprises a more efficient procedure, using the parameters of the original database (204 participants and 19 items) , running 1000 simulations, comparing the self-values generated randomly with the results obtained in the factor analysis, it was identified that the fourth simulated value is greater than the fourth value obtained in the factor analysis (1.58; 1.46; 1, 38; 1.30), indicating that the measure possibly has two factors.
The result obtained in the parallel analysis indicates that the tested measure has a structural similarity with the original measurement. However, when assessing the saturation criteria of the items, it was possible to observe that all the items saturate in the first factor, in this way, understanding that, in an attempt to make the measure more parsimonious, many items were excluded. An attempt to run a factor analysis was made, forcing the instrument to be composed of just one factor. The results can be seen in Table 1.
Through the analysis of Table 01, it is possible to identify that the instrument presented a satisfactory single factor structure, enabling researchers to verify that the 19 factors have a saturation greater than 0.40, and that the Cronbach’s alpha internal consistency index presents an excellent result (α = 0 , 90). Another important factor is that even with fewer items and a structure composed of a single factor, the measure still showed an explained variance higher than the original measure (37.9%).
After this factor analysis process, Pearson’s correlational analysis was performed, considering the sum of all items of the DBQ [13] and the general factor of the PDB, a moderate correlation of r = 0.60 was identified. Another result that drew the researchers’ attention was that, when comparing the results of motorcyclists and car drivers through a Studant t-test, it was possible to identify that motorcyclists have more expressive results (m = 2.45) than car drivers (m = 1.61), t = 7.08 and p <0.001, which may indicate that motorcyclists are more susceptible to committing infractions.
| Item | Factorial Load | h² |
|---|---|---|
| 09 - I turn right even though I can run over cyclists | 0.81 | 0.65 |
| 16 - I cutoff drivers who want to overtake me | 0.78 | 0.62 |
| 24 - I use high beam lights to disturb drivers in the opposite direction | 0.77 | 0.60 |
| 23 - I accelerate while another driver tries to overtake me | 0.72 | 0.52 |
| 14 – I overtake other drivers on the right side | 0.66 | 0.43 |
| 12 - I get angry in traffic, and I chase other drivers until I overtake them | 0.66 | 0.43 |
| 19 - I underestimate the speed of an approaching vehicle | 0.64 | 0.42 |
| 18 – I show that I am annoyed, indicating hostility | 0.62 | 0.39 |
| 02 – I brake in traffic jams, almost crashing the vehicle ahead | 0.59 | 0.35 |
| 20 - I disrespect the speed limit on the highway | 0.56 | 0.31 |
| 15 - I keep high beam lights even if the oncoming driver turns off high beam lights on his vehicle | 0.55 | 0.29 |
| 35 – I drive close to pedestrians, even if it is not my turn to move the vehicle | 0.55 | 0.30 |
| 37 - I avoid honking the horn to bother the driver ahead, waiting for the other driver to move even after the green lights | -0.54 | 0.30 |
| 13 - When someone is close to overtaking me, I accelerate at the last minute | 0.54 | 0.30 |
| 08 - I disrespect the speed limit on residential streets | 0.54 | 0.29 |
| 28 - I avoid using the horn to avoid making noise | -0.52 | 0.27 |
| 17 - I keep my high beam lights on if the other driver does not turn his vehicle’s high beam lights off | 0.49 | 0.24 |
| 21 - I reduce my speed to show that I am not pleased | 0.46 | 0.21 |
| 11 - I try to overtake even knowing that the person will turn left | 0.44 | 0.19 |
| Self-values | 7.77 | |
| Explained variance | 37.9 | |
| Number of items | 19 | |
| Cronbach’s alpha | 0.90 |
Table 1: Exploratory Factor Analysis.
Discussion
Traffic behavior assessment, although it is an extremely important phenomenon for humanity, seems to be a theme that has not been given due attention. In Brazil, there was a specific traffic psychology journal in the 1990s, which was extinguished, showing a lack of attention to an area of great relevance.
Many studies have been developed in the international context regarding the measures capable of assessing human action, its forms of commuting and consequences [20, 21], as can be identified in this research. However, the attempts of Brazilian researchers to study and unveil the peculiarities of people in traffic seem to be timid.
The results obtained in the present study demonstrate that the measure presents reliable validation results, although confirmatory studies need to be developed to test the reduced structure. It should be noted that there are no attempts in Brazil to make measures like this more parsimonious and, in addition, there is a limited number of adaptation and validation studies. More specifically regarding the structure, at first the statistical indications pointed to several different factors. However, as Pasquali (2010) points out, there is a theory behind the instrument in addition to the numerical indicators. The instrument focuses on the unwanted practices of vehicle drivers, which is a strong point. Bearing in mind that driver violations have increased in tandem with the unrestrained growth of cities, this aspect is linked to the disintegration of municipalities that do not seem to have followed urban growth, as the lack of information characterizes traffic in Brazilian cities, making it difficult to conduct actions to improve the flow of vehicles and pedestrians, as well as increasing the incidence of traffic accidents [22].
The Positive Driving Behavior Scale is of substantial value and could be used, for example, for ongoing process assessments for renewing the NDL. Such a measure would be justified because, in Brazil, the process of obtaining the NDL is extremely technical, simply assessing psychological constructs such as attention, logical reasoning, and personality, not that these variables are not relevant to be assessed, but the mere application of instruments that assess such aspects place the psychology professional in a purely technical or psych technical function, which is a serious mistake. According to Hutz CS, et al. [23] the mere application of a test is a technical process that differs from the psychological assessment. Where is the behavior assessment in the current psychological assessment process? Do drivers who get their NDLs not change over time, or remain psychologically balanced throughout their lives, and able to drive? These are questions that deserve an answer, and that a traffic behavior measure like the ECPD can help solve.
That said, the contribution of the present study is evident, however, it also has limitations. Among them, it is highlighted that the sample could have been more significant, but which is justified by the difficulty of voluntary participation in research, which is possibly associated with the size of the instrument, something that generated mortality (people quitting the study). Another negative factor was the difficulty in controlling the sample, as it was not possible to have an equal sample between men and women, which made it impossible to assess the comparisons between groups, with the same happening in relation to age groups. However, the negative aspects do not lessen the results obtained.
Conclusion
This study presents an advance toward traffic research and reckless driving behavior. The current study shows convincing evidence most traffic infringements committed by Brazilian drivers are the result of imprudence, absence of safety measures and protective equipment. Most of those behaviors can be explained by the Brazilian cultural background in order to avoid or circumvent traffic laws.
Our findings indicated that the behavioral issues should be considered in the drivers’ assessment examination process, besides of cognitive constructs already indicated in Brazilian traffic laws. Furthermore, it is recommended the validity, reliability, and applicability of different regional samples, considering specific contexts and groups, such as groups of offending drivers submitted to assessment of fitness to drive, renewal of driver’s license, or rehabilitation.
References
-
(2013) National Institute of Science and Technology [INCT]. Observatório das Metrópoles. Evolution of the Automobile and Motorbike Fleet in Brazil 2001-2012.
-
(2016) Projection of the population of Brazil and the Federation Units. IBGE.
-
Waiselfisz JJ (2014) Map of violence 2014: young people in Brazil. Ministry of Women, Family and Human Rights, pp: 187.
-
Moura Abreu DRO, Souza EM, De Mathias TAF (2018) Impact of the Brazilian Traffic Code and the Law Against Drinking and Driving on mortality from motor vehicle accidents. Cad Saúde Pública 34(8): 1-13.
-
Moreira MR., Ribeiro JM, Motta CT, Motta JIJ (2018) Mortality from traffic accidents among adolescents and young people, Brazil, 1996-2015: will we comply with SDG 3.6?. Public health science23(9): 2785-2796.
-
De Santos AMR, Rodrigues RAP, Dos Santos CB, Caminiti GB (2016) Geographical distribution of death of old people by traffic accidents. Escola Anna Nery 20(1): 130- 137.
-
Rozestraten RJA (2003) Environment, Traffic and Psychology. _In:_ Hoffmann MH, et al. (Eds.), Human Behavior in Traffic. São Paulo: Casa do Psicólogo.
-
(2019) Institutes rules and procedures for psychological expertise in the context of Trafficand repealing Resolutions CFP No. 0072009 and 009/2011: Resolution No. 1. Federal Council of Psychology.
-
Aparecida JS, Mendes DF, Silva LAM (2018) Contributions of Tests to Psychological Evaluation in Transit. Revista Psicologia e Saúde em Debate 4(1): 9-43.
-
Alchieri JC, Stroecher F (2002) Avaliação psicologia no trânsito: O estado da arte no Brasil sessenta anos depois. _In_: Cruz RM, et al. (Eds.), Avaliação e Medidas Psicológicas. São Paulo: Casa do Psicólogo, pp: 234-345.
-
Nakano TC, Sampaio MHL (2016) Performance in Intelligence, Concentrated Attention and Personality of Different Groups of Conductors. Psico-USF 21(1): 147- 161.
-
Coelho RPS, Grassi-Oliveira R, Machado M, Williams AV, Matte BC, et al. (2012) Translation and adaptation of the Motorcycle Rider Behavior Questionnaire: a Brazilian version. Cad Saúde Pública 28(6): 1205-1210.
-
Veiga HMS, Pasquali L, Silva NIA (2009) Validation of the Driver Behavior Questionnarie (DBQ) to Brazil. Aval psychol 8(2): 187-196.
-
Rushton JP, Fulker DW, Neale MC, Nias DKB, Eysenck HJ (1986) Altruism and aggression: The heritability of individual differences. APA PsycNet 50(6): 1192-1198.
-
Biçaks P, Özkan T (2016) Developing the Impulsive Driver Behavior Scale. Transportation Research Part F: Traffic Psychology and Behaviour 43: 339-356.
-
Ostapczuk M, Joseph R, Pufal J, Musch J (2017) Validação da versão em alemão do Driver Skill Inventory (DSI) e da Driver Social Desirability Scales (DSDS). Transportation Research Part F: Traffic Psychology and Behaviour 45: 169-182.
-
Özkan T, Lajunen T (2005) A new addition to DBQ: Positive Driver Behaviours Scale. Transportation Research Part F: Traffic Psychology and Behaviour 8(4- 5): 355-368.
-
Khouri NDMAA, Silva JC (2019) Narrative review: methodologies for adaptation and validation of psychological instruments. Revista Eixo 8(2): 2020-229.
-
Dancey C, Reidy J (2019) Statistics without mathematics for psychology. 7th (Edn.), Porto Alegre: Artmed.
-
Changa F, Xu P, Zhoua H, Lee J, Huanga H (2019) Identifying motorcycle high-risk traffic scenarios through interactive analysis of driver behavior and traffic characteristics. Transportation Research Part F: Traffic Psychology and Behaviour 62: 844-854.
-
Stogios C, Kasraian D, Roorda MJ, Hatzopoulou M (2019) Simulating impacts of automated driving behavior and traffic conditions on vehicle emissions. Transportation Research Part D: Transport and Environment 76: 176- 192.
-
Souza AN de, Rosa FD (2015) Development of a web platform to support traffic accident management. Transportes 23(3): 26-34.
-
Hutz CS, Bandeira DR, Trentini C (2015) Psicometria. Porto Alegre: Artmed.
- Occupational Stress and Mental Health Outcomes Among Police Officers: A Mini Review
- The Experience of Counterproductive Leadership on Mental Health and Impact on Retention in U.S. Marines: A Phenomenological Study
- Nomophobia in the Digital Age: A Study on College and University Students
- Emotional Regulation in Children with Autism and Learning Disabilities
- Antisemitism on American College Campuses and Its Impact on Jewish Students
- Exploring the Role of Empathy in the Associations of Family Functioning and Purpose in Life with Attitude towards Abortion among Undergraduates: A Moderation Analysis