Uncovering the Roots of Psychological Abuse in the Workplace in Bangladesh
The workplace is a pivotal arena in the lives of employees, where they strive for professional growth and financial stability. In Bangladesh, with its diverse workforce, the workplace plays a crucial role in shaping the lives of millions. Using the Quarterly Labour Force Survey 2016-17 data conducted by the Bangladesh Bureau of Statistics, this paper delves into the roots of psychological abuse in the workplace in Bangladesh, aiming to inform policies and interventions that promote employee wellbeing and a healthy work environment. The sample size for this study comprises 159,791 economically active individuals. For the statistical analysis, both bivariate and multivariate analyses were applied. Logistic regression analysis reveals that younger workers, females, and those with lower levels of education have a higher likelihood of experiencing workplace psychological abuse. Moreover, working in certain sectors (e.g., manufacturing and services) and occupations (e.g., elementary occupations and working as an employee) increases the likelihood of abuse, as do temporary and full-time employment, hazardous work environments, and informal job arrangements. Urban locations also correlate with a higher probability of psychological abuse, while specific divisions within Bangladesh exhibit varying risks. These insights can inform targeted interventions and policies to foster a safer and more supportive work environment in Bangladesh.
Introduction
A workplace is an ecosystem where employees devote a substantial portion of their lives to pursue professional fulfilment and economic well-being. It is also a space where dynamics of power, hierarchy, and interpersonal relationships are integral parts of daily operations. Bangladesh is a country with a diverse workforce where the significance of the workplace is magnified as it plays an important role in shaping the lives of millions. While the workplace provides chances for cooperation, innovation, and career success, it may also contain a dark aspect of working life: ‘Psychological Abuse’.
Psychological abuse often referred to as emotional abuse or workplace bullying which goes beyond traditional forms of harassment or discrimination. It involves hostile verbal and nonverbal acts excluding physical contact, aimed at adversely affecting an individual’s sense of self as a capable worker and person [1]. This form of abuse, characterized by consistent and enduring hostility [2], includes behaviours like verbal aggression, intimidation, humiliation, isolation, and manipulation. Such acts, often insidious and subtle, create a hostile and toxic work environment, eroding not only victims’ personal lives but also impacting productivity, morale, and the organization’s reputation [1]. Supervisors subjecting subordinates to psychological abuse pose significant challenges for employees [3, 4].
In both developed and emerging nations, workplace violence and aggression have become major issues, particularly in the last several years [5, 6, 7, 8]. The World Health Organization (WHO), the Occupational Safety and Health Administration (OSHA), the International Labour Organization (ILO), and other organizations have taken notice of this issue on a global scale and are working hard to create laws and regulations that will stop workplace abuse and violence. ILO Convention No. 190 (C190), which was adopted in 2019, aims to confront and stop violence and harassment in the workplace everywhere [9]. Governments who approve C190 will also implement the necessary laws and policies, which is worth emphasizing. As per the previously mentioned standard, workplace violence and harassment encompass a range of inappropriate conduct and behaviours that are either one-time or recurring, to cause physical, psychological, sexual, or financial harm. This includes harassment and violence based on gender [10].
Weak framework and law enforcement, ignorance of workplace abuse among employers and employees, and a malfunctioning human resource system only increased the problem in developing nations [11, 12]. In Bangladesh’s ready-made garment (RMG) industry, 61.7% of workers, regardless of gender, reported experiencing workplace violence. Matsuura and Teng claimed that although workers in the RMG sector were subjected to frequent insults and shouting matches, only female employees reported instances of sexual harassment. They also said that damaging activities were considered by the supervisors as an essential element in getting the workers to produce the desired results [13]. The 2006 Labour Act and Penal Code 1860 were implemented by the Bangladeshi government to safeguard workers’ rights and prevent workplace exploitation [14].
Bangladesh is a country with a diverse and dynamic workforce, where the workplace is an integral part of daily life. The impacts of psychological abuse need careful consideration. Against this backdrop, this study aims to explore and uncover the roots of psychological abuse in the workplace in Bangladesh. As the country stands at the crossroads of economic transformation and social progress, it is very important to address the issue of psychological abuse. This study aims to guide policy development and intervention approaches to ensure psychological well-being and, a sound working environment for all employees and promote their overall health condition.
To undertake policies in favour of workplace safety and security, it is imperative to explore the factors associated with psychological abuse in the workplace. In this regard, this paper particularly aims to answer the following four questions (i) are workers’ personal, household and human capital-related characteristics such as age, sex, marital status, household size, educational attainment, and so on, associated with the likelihood of being subjected to workplace psychological abuse?, (ii) are there any differences in psychological abuse in the workplace across the country’s sectors and occupations?, (iii) do workplace features such as number of people engaged in the workplace, workplace ownership, job structure, contract agreement, occupational environment, and so on, have any relation with the probability of being psychologically abused?, and (iv) do geographical characteristics such as rural-urban and divisions have any association with the likelihood of workplace psychological abuse?
Literature Review
Several studies have examined the causes of psychological abuse in workplaces worldwide. The analysis of Einarsen et al. revealed that there are some common antecedents such as power imbalances, organizational culture and lack of leadership support [15]. Bullying is strongly related to the symptoms of post-traumatic stress and mental health problems. The bullying in workplace is a major contributor to high levels of intention to quit, and low levels of job satisfaction [16]. The study found limited or no connections between being subjected to bullying and its impact on performance, sleep issues, absenteeism and core self-assessment of the individuals targeted [16].
Age can be a factor in vulnerability to psychological abuse. Employees at a young age entering the workforce may lack confidence and experience. This situation makes them more susceptible to mistreatment [17]. The type of abuse may differ depending on the perpetrator’s age. Older workers may use more covert, indirect methods, whereas younger ones may use more overt strategies [18]. Age can also be influential for employees to cope with workplace abuse. Younger individuals are more inclined to confront or leave the job in response to the abuse [17]. On the other side, older workers may adopt coping strategies to deal with the abuse because of being more experienced and financially secure [19].
In the USA, abuse by co-workers affected 2.3 million men and 1.1 million women, according to a nationally representative telephone study conducted in 1995–1996. The study found that the type of abuse varied depending on the gender of the victims. In addition, the study’s data shows that compared to female employees, male employees were less likely to disclose the incident. However, there was no difference in colleague violence observed by age, race, or educational attainment, according to this report [20]. Female employees may face higher levels of abuse which includes undermining behaviours such as withholding information, undermining opinions and excluding from important decision-making [17]. Men may express lower self-esteem and work satisfaction, whereas women may report symptoms of anxiety and depression more frequently. Female employees are more likely to take emotion-focused coping strategies to deal with the bullying in workplace and male employees take problem- focused coping strategies. The gender difference in coping mechanisms may have impacts on psychological well-being [21]. Marital status might not be much discussed as the other factors in harassment research. Divorced women face more oppression and they are at an increased risk of being harassed a work [22].
The education level of the employees is an important factor for being psychologically abused. A study showed that 32% of the workers who had experienced abuse didn’t have any formal education, 32% of them had primary education, and 31% of the workers had secondary education [23]. Gender-based violence is more prevalent in the garment sector of South and Southeast Asian nations including Bangladesh, Vietnam, Indonesia, India, and Cambodia due to power imbalances and inadequate protection [24].
According to a survey by Garment Workers Diaries in Bangladesh, 48% of workers in the garment industry, including 50% of women and 41% of men, reported experiencing verbal abuse. Among those facing psychological abuse, 13% of women and 7% of men experienced frequent verbal abuse, while 57% of women and 54% of men encountered it occasionally. The study also revealed that the workplace hierarchy played a role, with 87% of workers who experienced verbal abuse, including 85% of women and 92% of men, reporting abuse from their male superiors. In contrast, 9% of female and 10% of male workers experienced verbal abuse from their male co-workers [25].
Mayhew and Quinlan used qualitative data from surveys to show that workers in Australia who are typically engaged on a short-term contract, casual or subcontract, or as day labourers, are more vulnerable to abuse at work [26]. People who worked full-time were found to be more vulnerable to workplace bullying than those who worked part-time, according to a different study centred on public sector firms in the UK [27]. A study on white-collar workers in India found that almost 58 % of the people mentioned themselves as the victim of bullying. Other 42 % of people didn’t see themselves as the victim, even though they experienced some negative behaviour. Some of them took the negative behaviour as just a part of their workplace [28]. Physical workplace violence is less common than psychological abuse at work worldwide, according to Mayhew and Chappell [29].
Drawing from the existing literature on factors associated with workplace psychological abuse, it is apparent that no single study has comprehensively examined the various dimensions that could contribute to this issue. These dimensions include workers’ personal characteristics, household-level variables, human capital-related factors, socioeconomic aspects, workplace features, and geographical variables, all of which may significantly impact the experience of psychological abuse. Notably, there is a dearth of comprehensive research in these areas, especially when considering the specific context of Bangladesh. This paper fills the literature gaps based on the latest nationally representative survey namely the QLFS 2016–17, conducted by BBS [30]. This paper also presents unique insights that can inform policy reforms aimed at enhancing the safety and security of workers in their workplaces. These insights are derived from an individual-level perspective and offer valuable recommendations for policy development.
Method
Data
This study utilized data from the Quarterly Labour Force Survey (QLFS) 2016-17 in Bangladesh, which is a nationally representative cross-sectional random sample conducted by the Bangladesh Bureau of Statistics (BBS) during 2016- 2017. The QLFS 2016-17 provides micro-data at both household and individual levels. It contains a total of 493,886 observations and 480 variables. The study used the annual weighting provided by the BBS, as the data was collected on a quarterly basis. While the QLFS includes data at both the individual and household levels, this study specifically focused on individual-level data.
According to the QLFS 2016-17, an individual aged 15 years or older who has worked for at least one hour during the seven days preceding the survey, or has a job but is temporarily absent from work or available if work is available, is considered economically active. The data regarding psychological abuse in the workplace is associated with the primary job in the QLFS 2016-17, and thus, for the purposes of this study, the primary job is considered as the workplace. The QLFS includes a total of 159,791 observations for the economically active population, of which only 2.43%, or approximately 3,880 workers, reported experiencing psychological abuse in the workplace.
Measures
Dependent Variable: The QLFS data covers four types of abuse in the workplace-(i) constantly shouted at/ repeatedly insulted, (ii) beaten/physically hurt, (iii) sexually abused (touched), and (iv) other abuse. The outcome variable of interest is whether a worker or an individual is psychologically abused or not. Hence, based on the first type of abuse (constantly shouted at/repeatedly insulted), this study created a dichotomous variable score of 1 = yes (psychologically abused at the workplace), and 0 = no (otherwise) for the outcome measure. Therefore, the dependent variable used in this paper, psychological abuse status, takes one of the following two values:
{ 1 if the individual is psychologically abused 0 if otherwise _psy abuse =
Independent Variables: The explanatory variables used in this study include personal characteristics (such as age, female dummy, marital status dummy), human capital- related variables (such as education, training dummy), household characteristics (such as whether the individual is head of the household, household size), socio-economic factors (such as the occupation of the worker, industry where the worker is employed), workplace features (such as TPE in the workplace, type of institution, temporary vs permanent job, full time vs part-time job, occupational environment, nature of workplace agreement, informal vs formal sector job, work duration) as well as geographic location (such as urban dummy, division dummies) (Table 1).
| Broad Theme | Variable Name | Variable Description |
|---|---|---|
| Personal Characteristics | age | Age of the worker |
| female | 1=if the worker is female, 0=otherwise | |
| married | 1=if the worker is married, 0=otherwise | |
| Human capital variables | no_edu | 1=if the worker has no education-reference category |
| pri_edu | 1=if the worker has primary education | |
| sec_edu | 1=if the worker has secondary education | |
| hsec_edu | 1=if the worker has higher secondary education | |
| tertiary_edu | 1=if the worker has tertiary education | |
| madrasa_edu | 1=if the worker has madrasa education | |
| training | 1=if the worker received vocational training in the last 12 months, 0=otherwise | |
| Household characteristics | hh_head | 1=if the worker is the head of the household, 0=otherwise |
| hh_size | Number of the members in the household | |
| Socioeconomic characteristics | manuf | 1=if the worker is employed in the manufacturing sector, 0=otherwise |
| serv | 1=if the worker is employed in the services sector, 0=otherwise | |
| element_occup | 1=if occupation of the worker is elementary, 0=otherwise | |
| employee | 1=if the employment status of the worker is “employee”, 0=otherwise | |
| Workplace features | TPE_1 | 1=if total persons engaged in the workplace is 1-reference category |
| TPE_2_4 | 1=if total persons engaged in the workplace are 2-4 | |
| TPE_5_9 | 1=if total persons engaged in the workplace are 5-9 | |
| TPE_10_24 | 1=if total persons engaged in the workplace are 10-24 | |
| TPE_25_99 | 1=if total persons engaged in the workplace are 25-99 | |
| TPE_100_249 | 1=if total persons engaged in the workplace are 100-249 | |
| TPE_250+ | 1=if total persons engaged in the workplace are 250+ | |
| not_specified | 1=if total persons engaged in the workplace are not specified | |
| govt_inst | 1=if the worker is employed in the government institution-reference category | |
| NGO | 1=if the worker is employed in an NGO | |
| private_inst | 1=if the worker is employed in the private institution | |
| Household | 1=if the worker is employed in the household | |
| temp_job | 1=if the job is temporary, 0=permanent | |
| full_job | 1=if the job is full time, 0=part time | |
| occup_env | 1=if the environment of the workplace is hazardous, 0=otherwise | |
| oral_contact | 1=if the job is based on the oral agreement, 0=otherwise | |
| informal_job | 1=if the worker is employed in informal sector, 0=otherwise | |
| work_dur | Working hours of the worker in a week | |
| Geographical variables | urban | 1=if the worker is employed in urban areas, 0=otherwise |
| Mymensingh | 1=if the worker is employed in Mymensingh division, 0=otherwise | |
| Barishal | 1=if the worker is employed in Barishal division, 0=otherwise | |
| Chattogram | 1=if the worker is employed in Chattogram division, 0=otherwise | |
| Khulna | 1=if the worker is employed in Khulna division, 0=otherwise | |
| Rajshahi | 1=if the worker is employed in Rajshahi division, 0=otherwise | |
| Rangpur | 1=if the worker is employed in Rangpur division, 0=otherwise | |
| Sylhet | 1=if the worker is employed in Sylhet division, 0=otherwise |
Table 1: Variables and their description used in this study.
Source: Authors’ tabulation based on the variables used in this study. Table 1: Variables and their description used in this study.
Regression Methodology: For the statistical analysis, we follow a two-step process, beginning with bivariate analysis and then proceeding to multiple logistic regression. In the bivariate analysis, we utilize two-sample t-tests and chi- square tests to examine the relationship between each explanatory variable and the outcome of psychological abuse. This initial step helps us identify significant factors associated with psychological abuse in the workplace. These selected determinants are then included in the next stage, which is logistic regression. Logistic regression is one of the most commonly used techniques for modelling binary responses. If ω denotes the probability of an event (e.g., experiencing psychological abuse in the workplace) and { } 1 2 , .......... K X X X X = denotes the set of k independent variables, then the logistic regression model expresses the logarithm of odds of the event as follows:
0 1 1 2 2 log .......... 1 k k X X X ω α α α α ω = + + + − where are the coefficients associated with the explanatory variables and are estimated by the maximum likelihood method. A prime reason for the popularity of logistic regression is that exp i α has an intuitive interpretation in terms of the ratio of odds of the event of interest resulting from one unit change in X (when continuous) or ratio of the odds for the category of interest of X (when binary) to the odds for the reference category. Moreover, it is possible to estimate the average marginal effects, which provide insight into the probability of the event of interest happening as a result of a one-unit change in X (for continuous variables) or the probability for the specific category of X (for binary variables) in comparison to the probability for the reference category.
Results
Descriptive Statistics and Bivariate Analysis
This section outlines the fundamental characteristics and bivariate analysis of the final sample. It presents t-statistics and corresponding p-values for continuous variables, along with chi2 statistics for categorical variables. The final sample had a mean age of 37.56 years (Table 2). A two-sample t-test indicates a significant age difference between psychologically abused and not psychologically abused samples.
76.33% of the final sample were male, and 23.67% were female. Among psychologically abused workers, 56.06% were male and 43.94% were female. In contrast, among those not psychologically abused, 76.83% were male, and 23.17% were female. The gender variable is statistically significant (chi2 statistics=904.14, p-value<0.001), suggesting differences between psychologically abused and not psychologically abused samples in terms of gender.
In the overall sample, 81.08% were married, while 18.92% were unmarried. Among psychologically abused workers, 57.27% were married, and 42.73% were unmarried. In contrast, among those not psychologically abused, 81.67% were married, and 18.33% were unmarried. The p-value of less than 0.001 for marital status indicates a significant difference between psychologically abused and not psychologically abused samples.
25.28% had no education, 26.51% had primary education, 32.81% had secondary education, 7.62% had higher secondary education, 7.5% had tertiary education, and 0.28% had madrasa education in the overall sample. Among psychologically abused workers, the respective percentages were 34.66%, 30.57%, 28.48%, 4.56%, 1.57%, and 0.15%. In contrast, among not psychologically abused samples, the percentages were 25.05%, 26.41%, 32.92%, 7.69%, 7.65%, and 0.29%. The categorical variable, education status, is statistically significant, suggesting an association between psychological abuse and education levels.
Only 2.33% of the final sample received training in the last 12 months. Among psychologically abused workers, 1.26% received training, while 2.36% received training among those not psychologically abused. The training status variable is statistically significant, indicating a potential association between psychological abuse and training status.
In the final sample, 58.98% assumed the role of household head. However, among those psychologically abused, only 29.92% were household heads, whereas among the not psychologically abused, 59.7% held this position. This distinction is statistically significant (chi2 statistic=1.40E+03, p-value<0.001). The mean household size for the entire sample is 4.54, and this difference is also statistically significant.
Employment sectors revealed notable disparities within the sample. Specifically, 16.31% were from the manufacturing sector, while 83.69% were from other sectors. Among psychologically abused workers, 36.26% were in the manufacturing sector, compared to only 15.82% among those not psychologically abused. In terms of service sector distribution, 51.01% represented the overall sample, with 47.14% from the service sector among psychologically abused workers and 51.11% among the not psychologically abused. These sectoral differences are statistically significant, suggesting an association with psychological abuse.
Examining occupation status, 18.08% held elementary positions in the overall sample. Notably, the psychologically abused sample had a higher proportion (40.75%) in elementary occupations, compared to 17.52% for the not psychologically abused. In total, 47.28% were employees, with 83.97% of psychologically abused individuals falling into this category, while 46.26% of not psychologically abused individuals were employees.
In the workplaces where individuals faced psychological abuse, 29.2% had a Total Persons Engaged (TPE) of 1, 25.41% had TPE of 250+, and 20.08% had TPE of 2-4. In contrast, those not facing psychological abuse showed different percentages: 34.05% had TPE 2-4, 30.17% had TPE 1, and 6.32% had TPE 250+.
Regarding institutional affiliations, 5.64% of the overall sample was associated with government institutions, 0.71% with NGOs, 82.08% with private institutions, and 11.56% within households. Among psychologically abused samples, 1.62% were linked to government institutions, 0.62% to NGOs, 82.94% to private institutions, and 14.82% to households. Conversely, among not psychologically abused samples, 5.74% were in government institutions, 0.72% in NGOs, 82.06% in private institutions, and 11.48% within households. The type of institution variable was statistically significant (p-value<0.001), indicating differences between psychologically abused and not psychologically abused samples.
33.53% of the total samples had temporary positions, and 66.47% had permanent jobs. Among the psychologically abused sample, 47.60% had temporary jobs, and 52.4% had permanent positions. In contrast, among the not psychologically abused sample, 33.18% had temporary roles, and 66.82% had permanent positions. Job duration analysis revealed that 81.47% of the overall sample had full-time jobs, while 18.53% had part-time employment. Among psychologically abused samples, 86.65% had full- time positions, and 13.35% had part-time roles. Conversely, among not psychologically abused samples, 81.34% had full- time jobs, and 18.66% had part-time jobs. All these findings were statistically significant.
In case of occupational environment, 25.33% worked in hazardous environment and 74.67% worked in non- hazardous environment of the final sample. Among the psychologically abused sample 50.77% and 49.23% worked in hazardous and non-hazardous environment. On the other hand, among not psychologically abused sample 24.70% and 75.30% worked in hazardous and non-hazardous Broad indicators Sub-indicators Overall sample (%) (n=159,791) Gender Female 37,829 (23.67) 1,705 (43.94) 36,124 (23.17) 904.14 0 Male 121,962 (76.33) 2,175 (56.06) 119,787 (76.83) Marital status Married 129,554 (81.08) 2,222 (57.27) 127,332 (81.67) 1.50E+03 0 Not married 30,237 (18.92) 1,658 (42.73) 28,579 (18.33) Education Training status Received 3,723 (2.33) 49 (1.26) 3,674 (2.36) 19.9 0 Not received 156,068 (97.67) 3,831 (98.74) 152,237 (97.64) Head of the household head Head 94,244 (58.98) 1,161 (29.92) 93,083 (59.70) 1.40E+03 0 Not head 65,547 (41.02) 2,719 (70.08) 62,828 (40.30) Household size Mean household size* 4.54 4.33 4.54 6.8 0 Manufacturing sector Manufacturing 26,066 (16.31) 1,407 (36.26) 24,659 (15.82) 1.20E+03 0 Other sectors 133,725 (83.69) 2,473 (63.74) 131,252 (84.18) environment respectively.
In the overall sample, 80.56% held formal jobs, with 19.44% in informal employment. Among those facing psychological abuse, 96.29% were in formal jobs, contrasting with 80.16% for those not facing abuse. The mean weekly work duration was 54.52 hours for the overall sample, 56.18 hours for those facing psychological abuse, and 54.48 hours for those not facing abuse.
50.91% were from urban areas, and 49.09% were from rural areas in the overall sample. Those facing psychological abuse had 66.21% from urban areas and 33.79% from rural areas, while those not facing abuse had 50.53% and 49.47%, respectively. In the divisional breakdown, individuals facing psychological abuse were 37.84% from Dhaka, 24.95% from Chattogram, 14.66% from Rangpur, 8.92% from Khulna, 7.84% from Rajshahi, 3.51% from Sylhet, 2.19% from Barishal, and 0.10% from Mymensingh. For those not facing abuse, the percentages were 26.41%, 16.46%, 14.9%, 13.66%, 12.02%, 7.56%, 7.51%, and 1.48%, respectively.
Not psychologically abused samples (n=155,911)
Psychologically abused samples (n=3,880)
t/chi2 statistics P-value
Age Mean age* 37.56 27.81 37.8 46.94 0
No education 40,394 (25.28) 1,345 (34.66) 39,049 (25.05)
Primary education 42,357 (26.51) 1,186 (30.57) 41,171 (26.41)
Secondary education 52,426 (32.81) 1,105 (28.48) 51,321 (32.92)
423.5 0 Higher secondary education 12,173 (7.62) 177 (4.56) 11,996 (7.69)
Tertiary education 11,988 (7.50) 61 (1.57) 11,927 (7.65)
Madrasa education 453 (0.28) 6 (0.15) 447 (0.29)
| Services sector | Services | 81,515 (51.01) | 1,829 (47.14) | 79,686 (51.11) | 23.89 | 0 |
|---|---|---|---|---|---|---|
| Other sectors | 78,276 (48.99) | 2,051 (52.86) | 76,225 (48.89) | |||
| Occupation status | Elementary | 28,895 (18.08) | 1,581 (40.75) | 27,314 (17.52) | 1.40E+03 | 0 |
| Other occupations | 130,896 (81.92) | 2,299 (59.25) | 128,597 (82.48) | |||
| Employment status | Employee | 75,390 (47.18) | 3,258 (83.97) | 72,132 (46.26) | 2.20E+03 | 0 |
| Other employment | 84,401 (52.82) | 622 (16.03) | 83,779 (53.74) | |||
| Total Persons Engaged (TPE) | TPE_1 | 48,179 (30.15) | 1,133 (29.20) | 47,046 (30.17) | 2.50E+03 | 0 |
| TPE_2_4 | 53,870 (33.71) | 779 (20.08) | 53,091 (34.05) | |||
| TPE_5_9 | 15,884 (9.94) | 374 (9.64) | 15,510 (9.95) | |||
| TPE_10_24 | 11,049 (6.91) | 265 (6.83) | 10,784 (6.92) | |||
| TPE_25_99 | 7,818 (4.89) | 188 (4.85) | 7,630 (4.89) | |||
| TPE_100_249 | 3,039 (1.90) | 135 (3.48) | 2,904 (1.86) | |||
| TPE_250+ | 10,845 (6.79) | 986 (25.41) | 9,859 (6.32) | |||
| Not specified | 9,107 (5.70) | 20 (0.52) | 9,087 (5.83) | |||
| Type of institution | Government | 9,020 (5.64) | 63 (1.62) | 8,957 (5.74) | 151.23 | 0 |
| NGO | 1,139 (0.71) | 24 (0.62) | 1,115 (0.72) | |||
| Private | 131,155 (82.08) | 3,218 (82.94) | 127,937 (82.06) | |||
| Household | 18,477 (11.56) | 575 (14.82) | 17,902 (11.48) | |||
| Temporary vs permanent | Temporary | 53,582 (33.53) | 1,847 (47.60) | 51,735 (33.18) | 353.23 | 0 |
| Permanent | 106,209 (66.47) | 2,033 (52.40) | 104,176 (66.82) | |||
| Full time vs part time | Full time | 130,177 (81.47) | 3,362 (86.65) | 126,815 (81.34) | 70.74 | 0 |
| Part time | 29,614 (18.53) | 518 (13.35) | 29,096 (18.66) | |||
| Occupational environment | Hazardous | 40,474 (25.33) | 1,970 (50.77) | 38,504 (24.70) | 1.40E+03 | 0 |
| Non-hazardous | 119,317 (74.67) | 1,910 (49.23) | 117,407 (75.30) | |||
| Job agreement | Oral contact | 52,453 (32.83) | 2,624 (67.63) | 49,829 (31.96) | 2.20E+03 | 0 |
| Written contract | 107,338 (67.17) | 1,256 (32.37) | 106,082 (68.04) | |||
| Formal vs informal job | Informal job | 128,721 (80.56) | 3,736 (96.29) | 124,985 (80.16) | 628.4 | 0 |
| Formal job | 31,070 (19.44) | 144 (3.71) | 30,926 (19.84) | |||
| Work duration (hours in a week) | Mean work duration* | 54.52 | 56.18 | 54.48 | -4.91 | 0 |
| Spatial | Urban | 81,346 (50.91) | 2,569 (66.21) | 78,777 (50.53) | 372.65 | 0 |
| Rural | 78,445 (49.09) | 1,311 (33.79) | 77, (49.47) | |||
| Division | Dhaka | 42,644 (26.69) | 1,468 (37.84) | 41,176 (26.41) | 740.88 | 0 |
| Mymensingh | 2,316 (1.45) | 4 (0.10) | 2,312 (1.48) | |||
| Barishal | 11,793 (7.38) | 85 (2.19) | 11,708 (7.51) | |||
| Chattogram | 26,631 (16.67) | 968 (24.95) | 25,663 (16.46) | |||
| Khulna | 21,638 (13.54) | 346 (8.92) | 21,292 (13.66) | |||
| Rajshahi | 23,529 (14.72) | 304 (7.84) | 23,225 (14.90) | |||
| Rangpur | 19,314 (12.09) | 569 (14.66) | 18,745 (12.02) | |||
| Sylhet | 11,926 (7.46) | 136 (3.51) | 11,790 (7.56) |
Findings of the Logit Analysis
Table 3 presents the estimated coefficients, odds ratio and average marginal effects derived from logit estimates. The estimated coefficients of the logit model show the log odds of the workers experiencing psychological abuse in the workplace compared to those who do not. Among personal characteristics, age and marital status exhibit highly significant and negative associations with workplace psychological abuse, while the female gender has a highly significant and positive association. As worker’s age increases, the log odds of experiencing psychological abuse decrease by 0.06. Conversely, being female increases the log odds by 0.56, and being married decreases it by 0.19.
In terms of human capital variables, education levels demonstrate highly significant and negative associations with workplace psychological abuse. Workers with primary, secondary, higher secondary, tertiary, and madrasa education have log odds reductions of 0.66, 0.80, 0.97, 1.53, and 1.18, respectively. On the other hand, the coefficient for training is negative and statistically insignificant.
Household characteristics reveal that being the head of a household and larger household sizes are highly significant and negatively associated with workplace psychological abuse. Being the head decreases the log odds by 0.48, while each additional member in the household decreases it by 0.04.
Work-related variables show that workers in manufacturing, services, elementary occupations, and employees exhibit highly significant and positive associations with reporting psychological abuse. Workers in the manufacturing sector have a 0.49 increase in log odds, while those in the services sector increase by 0.98. Workers in elementary occupations experience a 1.10 increase, and “employee” employment status results in a 1.15 increase.
Regarding workplace features, workplaces with 2 to 4 workers, 5 to 9 workers, or 10 to 24 workers have a highly significant and negative relationship with workplace psychological abuse compared to single-worker workplaces. The log odds decrease by 0.51, 0.43, and 0.34, respectively. Conversely, workplaces with over 250 workers have a highly significant and positive association, with log odds increasing by 0.34. Moreover, working in NGOs, private companies, or households instead of government institutions increases the log odds by 0.88, 0.62, and 0.83, respectively.
Variables such as temporary jobs, full-time jobs, hazardous occupational environments, informal jobs, and longer work durations exhibit highly significant and positive associations with experiencing psychological abuse. Temporary jobs increase the log odds by 0.11, full-time jobs by 0.12, hazardous environments by 0.84, informal jobs by 0.35, and each additional hour of work per week by 0.01.
Geographical factors indicate that the urban environment is highly significant and positively associated with experiencing psychological abuse, with log odds increasing by 0.16. Among divisional dummies, Mymensingh, Barishal, Khulna, Rajshahi, and Sylhet show highly significant and negative associations, while Chattogram and Rangpur exhibit highly significant and positive associations with psychological abuse.
| -1 | -2 | -3 | |
|---|---|---|---|
| Variables | Coefficient | Odds Ratio | Average Marginal Effects |
| age | -0.0633*** | 0.939*** | -0.00133*** |
| -0.00235 | -0.0022 | -5.12E-05 | |
| female | 0.563*** | 1.755*** | 0.0118*** |
| -0.0467 | -0.082 | -0.000987 | |
| married | -0.185*** | 0.831*** | -0.00388*** |
| -0.0409 | -0.034 | -0.000862 | |
| pri_edu | -0.663*** | 0.516*** | -0.0172*** |
| -0.0482 | -0.0249 | -0.00133 | |
| sec_edu | -0.803*** | 0.448*** | -0.0198*** |
| -0.0508 | -0.0227 | -0.00136 | |
| hsec_edu | -0.986*** | 0.373*** | -0.0228*** |
| -0.092 | -0.0343 | -0.0018 |
tertiary_edu -1.525* 0.218* -0.0294*** -0.15 -0.0327 -0.00189
madrasa_edu -1.184* 0.306* -0.0256*** -0.422 -0.129 -0.00556
training -0.162 0.85 -0.00341 -0.157 -0.134 -0.00331
hh_head -0.478* 0.620* -0.0101*** -0.0508 -0.0315 -0.00107
hh_size -0.0392* 0.962* -0.000826*** -0.0106 -0.0102 -0.000224
manuf 0.490* 1.632* 0.0103*** -0.0763 -0.124 -0.00161
serv 0.981* 2.667* 0.0206*** -0.059 -0.157 -0.00126
element_occup 1.100* 3.004* 0.0231*** -0.0457 -0.137 -0.000989
employee 1.150* 3.157* 0.0242*** -0.0761 -0.24 -0.00162
TPE_2_4 -0.510* 0.600* -0.0108***
-0.0613 -0.0368 -0.00138 TPE_5_9 -0.426* 0.653* -0.00934***
-0.0778 -0.0508 -0.00169 TPE_10_24 -0.340* 0.712* -0.00770***
-0.0866 -0.0617 -0.00191 TPE_25_99 -0.169 0.845 -0.00408*
-0.103 -0.0867 -0.00242 TPE_100_249 0.126 1.134 0.00342
-0.118 -0.134 -0.00329 TPE_250+ 0.336* 1.400* 0.00988***
-0.0907 -0.127 -0.00275 not_specified -3.184* 0.0414* -0.0283***
-0.237 -0.0098 -0.00127 NGO 0.876* 2.402* 0.0162***
-0.253 -0.608 -0.00569 private_inst 0.620* 1.858* 0.0102***
-0.148 -0.275 -0.00191 household 0.829* 2.292* 0.0150***
-0.16 -0.368 -0.00239 temp_job 0.108* 1.114* 0.00228***
- Standard error in parentheses. See Table 1 for abbreviations.
- * p<0.01, p<0.05, * p<0.1
Table 4: Logit estimates of psychological abuse in the workplace.
One of the key reasons why logistic regression is widely used is because the term “exp” (αi) has a straightforward interpretation. A higher odds ratio signifies an increased likelihood of a worker experiencing psychological abuse, with an odds ratio exceeding 1 indicating higher odds, and those below 1 suggesting lower odds.
1,59,791 The estimated odds ratio suggests that with the increase in the age of the workers, the workers have 0.94 times fewer odds to be experiencing psychological abuse. It is seen that if the worker is female, the odds of her experiencing psychological abuse are 1.76 times more than that of a male worker. Married workers have 0.83 times lower odds to be experiencing psychological abuse than unmarried workers.
Turning our attention to education levels, we find that workers with primary, secondary, higher secondary, tertiary, and madrasa education experience odds that are 0.52, 0.45, 0.37, 0.22, and 0.31 times lower, respectively, compared to those with no primary schooling. This suggests a significant educational impact on the likelihood of experiencing psychological abuse.
Household dynamics play a crucial role as well. If the individual is the head of the household, the odds of his/ her experiencing psychological abuse are 0.62 times lower odds than the worker who is not the head of the household. With the increase in the size of the households, the workers have 0.96 times fewer odds to be experiencing psychological abuse.
When we explore employment sectors, we find that workers in the manufacturing sector have 1.63 times higher odds of experiencing psychological abuse, while those in the services sector face odds that are 2.67 times higher. Workers employed in elementary occupations encounter significantly higher odds, approximately 3.00 times greater, compared to their counterparts in other sectors. Similarly, “employee” employment status leads to 3.16 times higher odds.
A worker employed where 2–4, 5–9, and 10–24 employees are engaged in a firm, as opposed to 1 worker, is at lower odds but a worker employed where more than 250 employees is at higher odds to be experiencing psychological abuse. Moreover, those engaged in NGO, private, and household employment have around 2.40, 1.86, and 2.29 times, respectively greater odds of being abused as opposed to a worker employed in a government institution.
Job attributes also have a marked impact. Temporary jobs result in 1.11 times higher odds of experiencing psychological abuse, while full-time employment leads to 1.13 times higher odds. Working in a hazardous environment corresponds to 2.33 times higher odds and informal sector employment results in odds that are 1.41 times higher. Furthermore, with each additional hour worked per week, the odds increase by a factor of 1.00.
Geographical factors play a role too. Workers in urban areas face odds that are 1.18 times higher than their rural counterparts. Among divisional dummies, Mymensingh, Barishal, Khulna, Rajshahi, and Sylhet have lower odds, whereas Chattogram and Rangpur exhibit higher odds of experiencing psychological abuse in the workplace.
Despite the odds ratio allowing us to quantify the associations of the explanatory variables with the likelihood that the outcome variable will take on the value of one, average marginal effects is a more relevant means of presenting data, as differences in probability are measured on a probability scale and not on the odds scale. It allows us to compute the average effects of explanatory variables on probabilities that are non-linear as the probability must be between the range of 0 and 1, conditional on covariates. The last column of Table 3 presents the average marginal probabilities, which can be interpreted as percentage points changes when multiplied by 100.
The estimate of average marginal effects shows that as the age of a worker increases, the probability of that worker facing psychological abuse decreases by 0.13 percentage points. That is, younger workers are more at risk of being victimized in their respective workplaces in the country. When it comes to gender, the probability of being psychologically abused increases by 1.18 percentage points if the worker is female as opposed to male. The likelihood of being psychologically abused decreases by 0.39 percentage points if the worker is married. Moreover, we see that if a worker has primary education as opposed to receiving no formal education at all, it is 1.72 percentage points less likely that he/she will be psychologically abused. However, if a worker has secondary, higher secondary, tertiary, or madrasa education, the probability of experiencing workplace psychological abuse decreases by 1.98, 2.28, 2.94, and 2.56 percentage points, respectively.
The likelihood of being psychologically abused decreases by 1.01 percentage points if the worker is the head of the household. With the increase in the size of the household, the probability of a worker in the household decreases by 0.08 percentage points. If a worker is employed in the manufacturing sector, services sector, elementary occupation or employed as an employee, the likelihood of experiencing workplace psychological abuse increases by 1.03, 2.06, 2.31, or 2.42 percentage points, respectively.
A U‐shaped pattern is seen while observing the probability of being psychologically abused along with the change in the number of workers employed in a workplace. The results depict that the likelihood of being abused decreases by 1.08 percentage points if 2–4 workers are employed in a firm, decreases by 0.93 percentage points if 5–9 workers share a workplace at a time, and decreases by 0.77 percentage points when 10–24 workers are employed by a firm, respectively, instead of only 1 worker. However, the probability of being psychologically abused increases by 0.99 percentage points when 250+ employees are employed in an institution as opposed to having only 1 employee.
Based on the type of institution the worker is employed at, it can be said that if a worker works at an NGO instead of working at a government institution, the probability of that worker being the victim of workplace psychological abuse increases by 1.62 percentage points. Again, the likelihood of facing psychological abuse increases by 1.02 percentage points when the worker is employed at a private institution and the same increases by 1.50 percentage points when he/ she is employed in a household.
The result also shows that if the job is temporary instead of permanent, then a worker is 0.23 percentage points more likely to be psychologically abused and if the type of employment is full-time as opposed to part-time, it is 0.25 percentage points more likely that the worker may be psychologically abused. The probability of psychological abuse of the worker who works in a hazardous environment can increase by 1.78 percentage points, and the worker employed in an informal job is 0.73 percentage points more likely to be abused than a worker employed in a formal sector job. With the increase in the duration of work in a week, workers become 0.02 percentage points more likely to be psychologically abused. If a worker is employed in urban areas as opposed to rural areas, the probability of that worker being psychologically abused increases by 0.34 percentage points. Robustness Check of the Logit Estimates The logistic regression employs maximum likelihood, an iterative method. The logit model in this paper reached results after the seventh successive iteration. The first iteration (iteration 0) represents the log-likelihood of the “null” model, one without predictors, and its log-likelihood is -18258.47. In subsequent iterations, predictors are added, causing the log-likelihood to increase, aiming for maximization. Convergence occurs when the difference between successive iterations is very small, prompting the cessation of iteration, and the results are presented. The log- likelihood value for the final model is -13672.354, based on 159,791 observations.
The likelihood ratio (LR) test indicates an LR chi2 (39) statistic value of 9172.23, with 39 degrees of freedom. The Prob>chi2 value, representing the probability of obtaining the chi2 statistic assuming the null hypothesis (predictors have no effect), is 0.0000, less than 0.05. This high statistical significance implies that one or more predictors significantly impact the dependent variable. The pseudo R2 is 0.2512.
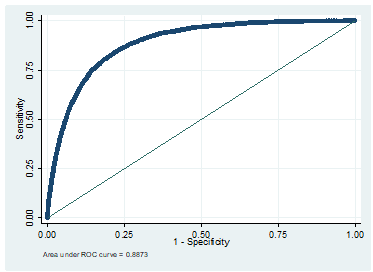
Source: Authors’ estimation after the logit estimates. Figure 1: ROC curve for the logit estimates.
Although the logit model is statistically significant, it is necessary to understand the accuracy of the estimated model. The accuracy can be measured with the help of the receiver operating characteristics (ROC) curve. The ROC curve is a graph of sensitivity versus one minus specificity as the cutoff c is varied— and calculates the area under it [31]. Figure 1 presents the ROC curve for the estimated logit regression. It shows that the logit model correctly specifies 88.73% of the exposure events, showing a high level of accuracy.
| estat classification | |||
|---|---|---|---|
| Logistic :rr.od.el for psy_abuse | |||
| --- True -- | |||
| Classified | D | -D | Total |
| + | 60 | 73 | 133 |
| - | 3820 | 155838 | 159658 |
| Total | 3880 | 155911 | 159791 |
| Classified + if predicted Pr (D) >= .5 | |||
| True D defined as psy_abuse != 0 | |||
| Sensitivity | Pr ( + I D) | 1.55% | |
| Specificity | Pr(-I ~D) | 99.95$ | |
| Positive Predictive Value | Pr(DI +) | 45.11% | |
| Negative Predictive Value | Pr(~DI -) | 97.61% | |
| False + rate for true -D | Pr ( + l~D) | 0.05% | |
| False - rate for true D | Pr ( -I D) | 98 .45% | |
| False + rate for classified + | Pr (-DI + ) | 54 .89% | |
| False - rate for classified - | Pr ( DI -) | 2 .39% | |
| Correctly classified | 97.56% |
Table 5: Estat classification results.
Source: Authors’ estimation after the logit estimates. Table 4: Estat classification results.
Table 4 shows that the overall rate of correct classification is estimated to be 97.56, with 99.95% specificity and only 1.55% sensitivity.
Logistic model for psy abuse , goodness -of -fit test number of observations 159791 number of covar iate patterns 152844 Pear son chi2 ( 152804) 134953.32 Prob > chi2 1.0000
- Source: Authors’ estimation after the logit estimates.
Table 6: Pearson Goodness-of-fit test.
Table 5 presents the Pearson chi2 goodness-of-fit test for the fitted model. The Pearson chi2 goodness-of-fit test is a test of the observed against the expected number of responses using cells defined by the covariate patterns. The Pearson chi2 value of 134953.32 and Prob>chi2 value of 1.0000 indicates that our model fits reasonably well.
Discussion
This study aimed to investigate the influencing factors of workplace psychological abuse in Bangladesh. Both bivariate and multivariate analyses were employed to reach our findings. We found that younger individuals have a greater likelihood of experiencing psychological abuse in the workplace than their older colleagues. This result aligns with the research conducted by Aquino, et al. [17] and by others [6, 23], but it contradicts the findings of Tjaden, et al. [20], who found no connection between age and workplace psychological abuse.
Our study revealed that female workers are more likely to experience psychological abuse compared to their male counterparts. These findings are consistent with previous studies [6, 17, 20, 23, 25]. Moreover, married workers are less likely to encounter abuse at work in comparison to unmarried workers, which is consistent with the conclusions of Ahmed, et al. [23].
We found that as individuals progress in their education, they are less likely to experience psychological abuse. These results are in line with the findings of Ahmed, et al. [23]. Another significant finding is that household heads are less likely to experience psychological abuse compared to non-head households. This finding corresponds to earlier research that linked age to this outcome [17].
A substantial portion of Bangladesh’s population works in the manufacturing sector. Among the individuals who reported experiencing psychological abuse, over a third of them came from this sector. Our analysis revealed that workers in the manufacturing sector are more likely to experience psychological abuse than those in other sectors. This finding is consistent with previous research [23, 25], which highlighted the severity of verbal abuse in the readymade garments sector, the largest manufacturing sector in the country. Similar patterns were found among workers in the services sector, aligning with prior research [28].
Occupation type significantly influences the likelihood of experiencing psychological abuse in the workplace. Elementary job holders are more likely to be psychologically abused than non-elementary job holders. Likewise, employees face a higher risk of psychological abuse compared to individuals in other employment types, consistent with previous studies [6, 23].
Our study indicated that the probability of psychological abuse is lower when workplaces have 2-24 employees compared to single-worker setups. However, when the number of employees exceeds 250, the risk of abuse increases, a finding consistent with previous research [23]. Moreover, the type of institution is related to workplace psychological abuse, with NGO workers, private institution workers, and household workers facing a higher risk compared to those in government institutions. A similar conclusion was made by Ahmed, et al. [23].
Hazardous work environments, job duration, contract type, and job permanency also play roles in workplace psychological abuse. Full-time workers are more likely to be psychologically abused than part-time workers, in line with previous findings [23, 27]. Employees who are contacted orally and those with temporary employment contracts face a greater risk of being abused, which aligns with observations from previous studies [23, 26]. Our study also concludes that as the duration of work increases, the probability of a worker being psychologically abused also increases, and job informality raises the risk of abuse. Additionally, workers in urban areas are more likely to experience psychological abuse than those in rural areas [31].
One limitation of the study is the inability to explore the associations between various psychometric characteristics and workplace psychological abuse. Factors such as the motives of perpetrators, work time periods (daytime, nighttime, and overtime), workplace violence regulations, perspectives of managers and supervisors on workplace violence and its handling within organizations, among others, may also be linked to workplace psychological abuse. Unfortunately, the study could not incorporate these elements due to data unavailability. There is potential for future research to delve into these aspects and provide a more comprehensive understanding of the subject.
Conclusion
The workplace, a central part of employees’ lives, serves as a platform for professional growth and economic stability. Understanding the dynamics of psychological abuse within this context is essential for fostering a healthy work environment and ensuring the well-being of millions of workers in Bangladesh. Using the latest Quarterly Labour Force Survey (QLFS) 2016-17, conducted by BBS, this research unravelled critical insights. Logistic regression analysis unveiled significant determinants of psychological abuse in the workplace. It was evident that age, gender, education, household dynamics, employment sector, workplace size, job attributes, and geographic location all play crucial roles in influencing the likelihood of experiencing psychological abuse at work.
Among these findings, certain groups faced higher risks. Younger workers, females, and those with lower educational attainment were particularly vulnerable. Furthermore, the choice of employment sector, job attributes, and workplace size also had significant implications. Factors like temporary and full-time employment, hazardous work environments, and informal job arrangements emerged as risk factors for abuse. The geographic location of workplaces also proved to be a significant factor, with urban areas showing a higher probability of psychological abuse. Additionally, specific divisions within Bangladesh exhibited varying risks, emphasizing the need for tailored interventions.
Based on the findings, several targeted policy recommendations emerge to address and mitigate the identified risk factors. Policymakers can consider implementing comprehensive training programs for employers and supervisors to raise awareness about the detrimental effects of psychological abuse and foster a culture of respect and dignity in the workplace. Additionally, establishing clear reporting mechanisms and whistleblower protections can empower victims to come forward without fear of retaliation.
Specific interventions tailored to vulnerable groups, such as younger workers, females, and those with lower educational attainment, are essential. Initiatives promoting inclusivity, equal opportunities, and gender sensitivity in hiring and promotions can contribute to a more equitable work environment. Moreover, recognizing and addressing the risk factors associated with employment sectors, job attributes, and workplace size can guide targeted interventions. For instance, enhancing safety measures in hazardous work environments, regulating informal job arrangements, and ensuring appropriate supervision in various sectors can significantly contribute to reducing the incidence of psychological abuse. Geographically, efforts should be concentrated on urban areas, where a higher probability of psychological abuse was identified. Implementing awareness campaigns, workplace interventions, and community outreach programs can effectively address this issue in urban settings. Furthermore, recognizing the varying risks in specific divisions within Bangladesh calls for localized strategies and interventions that consider the unique dynamics of each region.
• Conflict of Interest: The authors declare no conflicts of interest.
• Funding: The authors received no funding to conduct this study.
• Data Availability Statement: The data that support the findings of this study are available from the corresponding author upon reasonable request.
References
-
Keashly L, Harvey S (2005) Emotional Abuse in the Workplace. In: Fox S, Spector PE (Eds.), Counterproductive work behavior: Investigations of actors and targets pp: 201-235.
-
Keashly L, Harvey S (2006) Workplace Emotional Abuse. In: Kelloway EK, Barling J, et al. (Eds.), Handbook of Workplace Violence.
-
Johnson PR, Indvik J (2006) Sticks and stones: Verbal abuse in the workplace. Journal of Organizational Culture, Communications and Conflict Proceedings 11(1): 121.
-
Crawshaw L (2009) Workplace bullying Mobbing Harassment Distraction by a thousand definitions. Consulting Psychology Journal: Practice and Research 61(3): 263.
-
Hoel H, Sparks K, Cooper CL (2001) The cost of violence/ stress at work and the benefits of a violence/stress-free working environment. Geneva: International Labour Organization 81.
-
Mayhew C, Chappell D (2007) Workplace violence: an overview of patterns of risk and the emotional/stress consequences on targets. International journal of law and psychiatry 30(4-5): 327-339.
-
Nielsen MB, Einarsen SV (2018) What we know, what we do not know, and what we should and could have known about workplace bullying: An overview of the literature and agenda for future research. Aggression and Violent Behavior 42: 71-83.
-
Vittorio DIM (2002) Workplace violence in the health sector: Country case studies, Brazil, Bulgaria, Lebanon, Portugal, South Africa, Thailand and an additional Australian study: Synthesis report (p. 42). International Labour Organization (ILO) pp: 4-49.
-
International Labour Organization (ILO) (2022) Eliminating violence and harassment in the world of work.
-
International Labour Organization (ILO) (2019) Convention C190—Violence and harassment convention. 190.
-
Billah MM, Uddin AR (2004) Workplace environment for women: Issues of harassment and need for interventions. Centre for Policy Dialogue (CPD) 65: 1-24.
-
Hasan MI, Hassan MZ, Bulbul MMI, Joarder T, Chisti MJ (2018) Iceberg of workplace violence in health sector of Bangladesh. BMC Research Notes 11(1): 702.
-
Matsuura A, Teng C (2020) Understanding the gender composition and experience of ready‐made garment (RMG) workers in Bangladesh. International Labour Organization (ILO) pp: 64.
-
Seen AM (2021) Bangladesh and ILO violence and harassment convention 2019. The Daily Star.
-
Einarsen S, Hoel H, Zapf D, Cooper C (2020) The concept of bullying and harassment at work. Bullying and harassment in the workplace developments in theory. Research, and practice pp: 3-39.
-
Nielsen MB, Einarsen S (2012) Outcomes of exposure to workplace bullying: A meta-analytic review. Work & Stress 26(4): 309-332.
-
Aquino K, Thau S (2009) Workplace victimization: Aggression from the target’s perspective. Annual review of psychology 60: 717-741.
-
Ng TW, Feldman DC (2013) Age and innovation‐related behavior: The joint moderating effects of supervisor undermining and proactive personality. Journal of organizational behavior 34(5): 583-606.
-
Bal PM, De Lange AH, Jansen PG, Van Der Velde ME (2008) Psychological contract breach and job attitudes: A meta- analysis of age as a moderator. Journal of vocational behavior 72(1): 143-158.
-
Tjaden PG, Thoennes N (2001) Coworker violence and gender. American Journal of Preventive Medicine 20(2): 85-89.
-
Lutgen‐Sandvik P, Tracy SJ, Alberts JK (2007) Burned by bullying in the American workplace: Prevalence, perception, degree and impact. Journal of Management Studies 44(6): 837-862.
-
Adikaram AS (2018) An opportunity for other men and a threat to other women: Workplace harassment at the intersection of marital status and gender in Sri Lanka. Human Resource Development International 21(3): 186-211.
-
Ahmed MT, Islam S (2023) Factors associated with abuse in the workplace in Bangladesh: An empirical investigation. Aggressive Behavior 49(3): 288-300.
-
Morris J, Rickard S (2019) Violence and harassment, including sexual harassment, in garment factories and supply chains. WOW Helpdesk Query No. 22.
-
Karimi C, Lesser D (2023) Workplace Hazards and Abuse. Garment Worker Diaries.
-
Mayhew C, Quinlan M (2002) The relationship between precarious employment and patterns of occupational violence. In: Isaksson KC, Hogstedt, et al. (Eds.), Health effects of the new labour market pp: 183-205.
-
Hoel H, Giga SI (2006) Destructive interpersonal conflict in the workplace: The effectiveness of management interventions (Report). Manchester Business School.
-
Savapandit N (2022) Workplace bullying in the service sector. Indian Journal of Social Psychiatry 38(2): 143- 147.
-
Mayhew C, Chappell D (2007) Workplace violence: An overview of patterns of risk and the emotional/stress consequences on targets. International Journal of Law and Psychiatry 30(4-5): 327-339.
-
Green DM, Swets JA (1966) Signal detection theory and psychophysics. New York: Wiley, US, 1: 1969-2012.
-
Boateng P, Amponsah E, Akaffo V, Yamoah P (2015) Sexual harassment and human resource development. European Journal of Business and Management 7(33): 134-144.
- Occupational Stress and Mental Health Outcomes Among Police Officers: A Mini Review
- The Experience of Counterproductive Leadership on Mental Health and Impact on Retention in U.S. Marines: A Phenomenological Study
- Nomophobia in the Digital Age: A Study on College and University Students
- Emotional Regulation in Children with Autism and Learning Disabilities
- Antisemitism on American College Campuses and Its Impact on Jewish Students
- Exploring the Role of Empathy in the Associations of Family Functioning and Purpose in Life with Attitude towards Abortion among Undergraduates: A Moderation Analysis