A Study to Assess the Level of Nomophobia among Students of Selected Colleges in Nadiad City with a View to Distribute Guideline
Introduction: Nomophobia, the irrational fear of being without a mobile phone, was coined during a 2008 study by the UK Post Office and YouGov. This term highlights the anxiety experienced by mobile phone users, especially with the advent of smartphones. Objectives: The study aimed to assess the level of Nomophobia among students in selected colleges of Nadiad city and to determine the association between Nomophobia levels and selected demographic data. Methodology: A non-experimental descriptive research design was employed. The study involved 200 students from selected colleges in Nadiad city, chosen through non-probability convenient sampling. Data was collected using a Modified Nomophobia Questionnaire (NMP-Q). Results: Among the 200 students, 3 (1.5%) had an absent level of Nomophobia, 60 (30%) had a mild level, 115 (57.5%) had a moderate level, and 22 (11%) had a severe level. Significant associations were found between Nomophobia levels and demographic variables such as gender, monthly income, hours spent on mobile phones, frequency of notification checks, and preferred social media content. These associations were analyzed using the Chi-Square test. Conclusion: The study reveals varying levels of Nomophobia among college students in Nadiad. While many students were unaware of the term "Nomophobia," a significant number experienced it. This underscores the need for targeted educational interventions to raise awareness about Nomophobia and its implications.
Introduction
Technology and its changes play a vital role in the life of an individual. The latest trend of the society is to adapt every change in the communication technology field. The mobile phones are blessing of this century. Mobile phones are considered as an integral communication device and become an important part of the society. It is not only a communication tool but also a mandatory social accessory.
Smart phones or mobile phones are mandatory for everyone to keep in touch with family, friends through using e-mails, messages and internet connectivity. Advancement in technology switched the trend completely and made mobile phone as depository for data, camera, and music player and also as a gaming gadget [1]. The mobile industry has experienced tremendous growth and innovation since the introduction of the first smartphone in 2007, with substantial technological improvements transforming the sector and dramatically changing how we interact, access information, and utilize mobile technology [2]. Currently, young people are familiar with developing, communicating, interacting, playing and having fun with other people through digital media. Some young people state that they prefer digital contact to physical contact [3]. Individual appear to prefer indirect communication and more revealing in virtual reality, because behind the screen make them feel more sheltered. In numerous cases, seeking confirmation through communication with other people leads to overuse of and dependence on the mobile phone [4].
Mobile phones have now become smartphones which has all the smart features to abide by the 21st century so called techno culture and social lives thus becoming an integral part of this generation, especially among the youngsters [5]. Smartphone has become essentials rather than accessories, due to their capacity to perform many tasks with features including advanced operating systems, touch screen, and internet access [6]. due to increasing technological advance, mobile phones (now referred to more commonly as “smartphones”) have become an indispensable tool, because they offer a variety of convenient functions such as internet surfing and a wide variety of application [7].
New technologies have become crucial parts of our lives. Smartphones, rapidly spreading worldwide, now play a vital role in social interactions, personal expression, information sharing, and skill development. They have transformed from optional gadgets to essential devices due to their advanced features like sophisticated operating systems, touch screens, and internet connectivity [8]. Overuse of smartphone among today’s generation has assumed an epidemic proportion [9]. In this technological spectrum, the Internet cannot be forgotten as a technology whose access has been enhanced with the expansion of mobile device. This has caused addiction to both mobile and internet access. These new addictions, typical of the digital era, trend to proliferate in economically developed regions, where citizens have the resources and means to have the necessary technology [10].
Results
College students frequently use the internet’s social media platform in ways that could have a detrimental effect on several aspects of their lives. Social media addiction is marked by an irresistible urge to constantly check and use social media platforms, an excessive preoccupation with online interactions, and a disproportionate allocation of time and energy towards social media, ultimately disrupting important areas of life, such as relationships, work, and personal well-being [11]. Young adults primarily utilize their smartphones for online activities such as internet browsing, video streaming, and social media engagement, with a focus on staying updated on various social networking sites [12].
No mobile phone phobia (Nomophobia) refers to the specific terms associated with the fear of losing one’s mobile phone and connectivity, which was first introduce in 2008 to examine anxiety among mobile phone users [13]. The term no-mobile-phone-phobia was coined during a 2008 study by the UK post office who commissioned YouGov a UK based research organization to evaluate anxieties experienced by mobile phone users. on this small electronic device since the appearance of smart phones [14].
Material and Methods
This descriptive study was conducted after institutional ethical committee approval. A Modified Standard Nomophobia Questionnaires was circulated to 200 college students from the selected colleges of Nadiad city by Non probability convenient sampling technique from 01/07/2024 to 03/07/2024. Written inform consent was obtained from all the participants, for Nomophobia questionnaires, the total minimum score is 20 and total maximum score is 140. The category was calculated as 20 indicates, absence of nomophobia level, 21 ≤ to < 60 Mild, 60 ≤ to < 100 Moderate, 100 ≤ to ≤ 140 Severe. The students were included Undergraduate and post graduate students of Microbiology and 2nd year BSc chemistry Students from J and J science college, Nadiad.
| Sr no. | Demographic Data | Frequency | Percentage |
|---|---|---|---|
| 1 | Age in years | ||
| A. 18-19 years | 124 | 62% | |
| B. 20-21 years | 65 | 32.50% | |
| C. 22-23 years | 9 | 4.50% | |
| D. Above 23 years | 2 | 1% | |
| 2 | Gender | ||
| A. Male | 99 | 49.50% | |
| B. Female | 101 | 50.50% | |
| C. Transgender | 0 | 0% | |
| 3 | Residential area | ||
| A. Urban | 69 | 34.50% | |
| B. Rural | 131 | 65.50% | |
| 4 | Types of family | ||
| A. Nuclear family | 38 | 19% | |
| B. Joint family | 158 | 79% | |
| C. Extended family | 4 | 2% | |
| 5 | Family monthly income | ||
| A. 5000-15000 Rs | 74 | 37% | |
| B. 15001- 25000 Rs | 50 | 25% | |
| C. Above 25000 Rs | 76 | 38% | |
| 6 | Marital status | ||
| A. Married | 18 | 9% | |
| B. Unmarried | 182 | 91% | |
| C. Widow/widower | 0 | 0% | |
| D. Divorced | 0 | 0% | |
| 7 | Pursuing course | ||
| A. PG | 14 | 7% | |
| B. UG | 186 | 93% | |
| 8 | Do you have your personal smartphone? | ||
| A. Yes | 200 | 100% | |
| B. No | 0 | 0% | |
| 9 | Number of mobile phones? | ||
| A. 1 | 185 | 92.50% | |
| B. 2 | 12 | 6% | |
| C. More than 2 | 3 | 1.50% | |
| 10 | Duration of using mobile phone? | ||
| A. < 1 hour | 50 | 25% | |
| B. 1-2 hour | 66 | 33% | |
| C. 2-3 hour | 36 | 18% | |
| D. > 3 hours | 48 | 24% | |
| 11 | Monthly spent of your money on mobile recharge? | ||
| A. < 200 Rs | 52 | 26% | |
| B. 201-400 Rs | 112 | 56% | |
| C. 401-600 Rs | 20 | 10% | |
| D. > 600 Rs | 16 | 8% | |
| 12 | How many times you frequently check your mobile phone for any notification? | ||
| A. 1-5 times in an hour | 105 | 52.50% | |
| B. 6-10 times in an hour | 46 | 23% | |
| C. 11-15 times in an hour | 23 | 11.50% | |
| D. Constantly | 26 | 13% | |
| 13 | Content prefers on social media? | ||
| A. Motivational | 25 | 12.50% | |
| B. News | 11 | 5.50% | |
| C. Web-series | 11 | 5.50% | |
| D. Comedy | 8 | 4% | |
| E. Reels | 15 | 7.50% | |
| F. All of the above | 130 | 65% | |
| 14 | Years of using mobile phone? | ||
| A. < 5 years | 145 | 72.50% | |
| B. 5-10 years | 27 | 13.50% | |
| C. > 10 years | 28 | 14% | |
| 15 | Aware of the term nomophobia? | ||
| A. Yes | 45 | 22.50% | |
| B. No | 155 | 77.50% |
Table 1: Frequency and percentage distribution of selected demographic variables of college students (n= 200).
Table 1 shows the demographic data of 200 students were normally distributed. In that, 124(62%) in 18-19 years, 101(50.5%) are female, 131(65.5%) are living in the rural area, 158(79%), are living in joint family, 76(38%) having above 25000 family monthly income, 182( 91%) were unmarried, 186(93%) of students were undergraduate,200(100%) students were having their personal smart phone, 185(92.5%) were having only 1 mobile phone, 66(33%) were using their mobile phone for 1-2 hours, 112(56%) were paying 201-400 rupees for their mobile phone recharge, 105(52.5%) students were frequently checking their mobile phone notification in 1-5 times in an hour, 130(65%) students prefer motivation, news, web-series, comedy and reels on social media platform, 145(72.5%) were using their mobile phone for less than 5 years, 155(77.5%) were unaware of term Nomophobia.
| Level of Nomophobia | Frequency | Percentage |
|---|---|---|
| Absent | 3 | 1.50% |
| Mild | 60 | 30% |
| Moderate | 115 | 57.50% |
| Severe | 22 | 11% |
Table 2: Frequency and distribution of level of nomophobia among college students.
Table 2 shows that in the distribution and frequency of level of nomophobia among college students, there are 3(1.5%) students having Absent level of nomophobia, 60(30%) students having mild level of nomophobia, 115(57.5%) students having moderate level of nomophobia, and 22(11%) students having severe level of nomophobia.
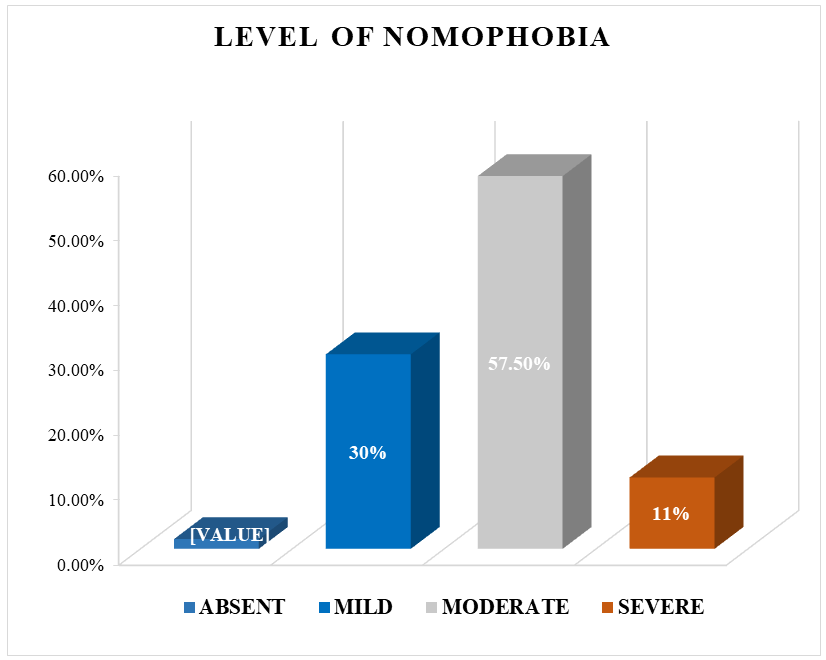
Graph 1: Shows the level of nomophobia among the students.
| Demographic Variable | NOMOPHOBIA LEVEL | |||||||||||||
|---|---|---|---|---|---|---|---|---|---|---|---|---|---|---|
| Absent | Mild | Moderate | Severe | Total | DF | X2 | TV | NS | ||||||
| F | % | F | % | F | % | F | % | |||||||
| Age | 18-19 | 0 | 0% | 38 | 19% | 72 | 36% | 14 | 7% | 124 | 9 | 9.89 | 16.92 | NS |
| 20-21 | 3 | 1.5 % | 19 | 9.5% | 37 | 18.5% | 6 | 3% | 65 | |||||
| 22-23 | 0 | 0% | 3 | 1.5% | 5 | 2.5% | 1 | 0.5% | 9 | |||||
| Above 23 | 0 | 0% | 0 | 0% | 1 | 0.5% | 1 | 0.5% | 2 | |||||
| Gender | Male | 3 | 1.5% | 34 | 17% | 56 | 28% | 6 | 3% | 99 | 3 | 8.672 | 7.82 | S |
| Female | 0 | 0% | 26 | 13% | 59 | 29.5% | 16 | 8% | 101 | |||||
| Trans-gender | 0 | 0% | 0 | 0% | 0 | 0% | 0 | 0% | 0 | |||||
| Residential area | Urban | 1 | 0.5% | 23 | 11.5% | 37 | 18.5% | 8 | 4% | 69 | 3 | 0.70 | 7.82 | NS |
| Rural | 2 | 1% | 37 | 18.5% | 78 | 39% | 14 | 7% | 131 | |||||
| Family | Nuclear | 0 | 0% | 9 | 4.5% | 24 | 12% | 5 | 2.5% | 38 | 6 | 2.601 | 12.59 | NS |
| Joint | 3 | 1.5% | 50 | 25% | 88 | 44% | 17 | 8.5% | 158 | |||||
| Extended | 0 | 0% | 1 | 0.5% | 3 | 1.5% | 0 | 0% | 4 | |||||
| Monthly income | 5,000-15,000 Rs. | 0 | 0% | 26 | 13% | 43 | 21.5% | 5 | 2.5% | 74 | 6 | 12.84 | 12.59 | S |
| 15,001- 25,000 Rs. | 3 | 1.5% | 13 | 6.5% | 26 | 13% | 8 | 4% | 50 | |||||
| Above 25,000 Rs | 0 | 0% | 21 | 10.5% | 46 | 23% | 9 | 4.5% | 76 | |||||
| Marital Status | Married | 0 | 0% | 4 | 2% | 13 | 6.5% | 1 | 0.5% | 18 | 3 | 1.975 | 7.82 | NS |
| Un-married | 3 | 1.5% | 56 | 28% | 102 | 51% | 21 | 10.5% | 182 | |||||
| Widow Widower | 0 | 0% | 0 | 0% | 0 | 0% | 0 | 0% | 0 | |||||
| Divorced | 0 | 0% | 0 | 0% | 0 | 0% | 0 | 0% | 0 | |||||
| Pursuing course | PG | 0 | 0% | 3 | 1.5% | 8 | 4% | 3 | 1.5% | 14 | 3 | 2.083 | 7.82 | NS |
| UG | 3 | 1.5% | 57 | 28.5% | 107 | 53.5% | 19 | 9.5% | 186 | |||||
| Number of Smart phone | 1 | 3 | 1.5% | 53 | 26.5% | 109 | 54.5% | 20 | 10% | 185 | 6 | 3.823 | 12.59 | NS |
| 2 | 0 | 0% | 5 | 2.5% | 5 | 2.5% | 2 | 1% | 12 | |||||
| more than 2 | 0 | 0% | 2 | 1% | 1 | 0.5% | 0 | 0% | 3 | |||||
| Hours spent on Mobile phone | <1 Hour | 3 | 1.5% | 14 | 7% | 32 | 16% | 1 | 0.5% | 50 | 9 | 20.492 | 16.92 | S |
| 1-2 Hours | 0 | 0% | 21 | 10.5% | 38 | 19% | 7 | 3.5% | 66 | |||||
| 2-3 Hours | 0 | 0% | 11 | 5.5% | 22 | 11% | 3 | 1.5% | 36 | |||||
| More than 3 Hours | 0 | 0% | 14 | 7% | 23 | 11.5% | 11 | 5.5% | 48 | |||||
| Monthly Re charge | < 200 Rs | 3 | 1.5% | 13 | 6.5% | 35 | 17.5% | 1 | 0.5% | 52 | 9 | 40.204 | 16.92 | NS |
| 201- 400 Rs | 0 | 0% | 38 | 19% | 63 | 31.5% | 11 | 5.5% | 112 | |||||
| 401- 600 Rs | 0 | 0% | 2 | 1% | 9 | 4.5% | 9 | 4.5% | 20 | |||||
| More than 600 Rs | 0 | 0% | 7 | 3.5% | 8 | 4% | 1 | 0.5% | 16 | |||||
| Check notication in an Hours | 1-5 times | 1 | 0.5% | 34 | 17% | 68 | 34% | 2 | 1% | 105 | 9 | 36.62 | 16.92 | S |
| 6- 10 times | 2 | 1% | 10 | 5% | 27 | 13.5% | 7 | 3.5% | 46 | |||||
| 11-15 times | 0 | 0% | 7 | 3.5% | 13 | 6.5% | 3 | 1.5% | 23 | |||||
| Con-stantly | 0 | 0% | 9 | 4.5% | 7 | 3.5% | 10 | 5% | 26 | |||||
| Content on Social- media | Motivational | 0 | 0% | 7 | 3.5% | 17 | 8.5% | 1 | 0.5% | 25 | 15 | 38.817 | 24.99 | S |
| News | 2 | 1% | 2 | 1% | 7 | 3.5% | 0 | 0% | 11 | |||||
| Web-series | 1 | 0.5% | 1 | 0.5% | 9 | 4.5% | 0 | 0% | 11 | |||||
| Comedy | 0 | 0% | 4 | 2% | 4 | 2% | 0 | 0% | 8 | |||||
| Reels | 0 | 0% | 5 | 2.5% | 8 | 4% | 2 | 1% | 15 | |||||
| All of the above | 0 | 0% | 41 | 20.5% | 70 | 35% | 19 | 9.5% | 130 | |||||
| Year of using Mobile- phone | < 5 Years | 3 | 1.5% | 45 | 22.5% | 82 | 41% | 15 | 7.5% | 145 | 6 | 6.272 | 12.59 | NS |
| 5-10 Years | 0 | 0% | 9 | 4.5% | 17 | 8.5% | 1 | 0.5% | 27 | |||||
| > 10 Years | 0 | 0% | 6 | 3% | 16 | 8% | 6 | 3% | 28 | |||||
| Aware NMP | Yes | 0 | 0% | 14 | 7% | 27 | 13.5% | 4 | 2% | 45 | 3 | 1.193 | 7.82 | NS |
| No | 3 | 1.5% | 46 | 23% | 88 | 44% | 18 | 9% | 155 |
Table 3: Association between Level of Nomophobia with selected demographic variables.
Table 3 shows that there is association of level of nomophobia with selected demographic variables. Gender, Monthly income, Hours spent on mobile phone, Frequent notification check on mobile phone, Content prefer on social media shows significant association with the scores but other variables don’t show any significant association. The association is done with the help of chi square test.
Discussion
The present study states that college students have moderate level of nomophobia suggesting that students are unaware about the term nomophobia but some students were aware of term nomophobia. A Study conducted by Kawalijeet Kaur had Conducted to assess level of nomophobia among students of selected colleges in Amritsar. The sample size consists of 100 students of selected college. A convenient sampling technique was used for the data collection. The results of this study shows that 11% of students were suffering from the mild level of Nomophobia, 53% of students suffering from moderate level of Nomophobia and 36% of students suffering from the severe level of Nomophobia [15]. Another study was done by Monika Thakur and Vijaya Bharti had conducted a study to assess the levels of nomophobia among nursing students in Kumarhatti - Solan. Descriptive Non-Experimental research design was used for the study, and 125 samples were selected by the non -probability convenient sampling technique. The data was collected by Google forms where the data collection tool was standardized NMP-Q. The results showed that highest number 83(66%) of nursing students lie in moderate level, 18(14.4%) students lie in mild level whereas 24% students lie in severe levels of nomophobia and not a single (0%) student lies in absence of nomophobia [16]. According to Binu Joe and Linson CC had conducted a descriptive study to assess the prevalence of nomophobia among school going children from Rajkot and Surendra Nagar districts of Gujarat. And the result of his study showed that out of 1145 participants which were selected by the convenience sampling technique 52.58% of the participants had moderate level of nomophobia, 32.58% had mild level of nomophobia, 14.40% had severe level of nomophobia and only 0.44% had no signs of nomophobia [17]. According Ravi Kumar, Supriya kumri et al. had conducted the study to determine the level of nomophobia in the Indian population aged between 15 and 35 years. Out of 2061, 74.8% of the respondents were moderate level of nomophobia, 18.9% were severe of nomophobia, and 6.3% were mild level of nomophobia [18].
Conclusion
According to finding of this study, maximum students were unaware of term nomophobia. The study highlights the assessment of level of Nomophobia among students of selected colleges. Although the majority of students in this study shows the moderate level of nomophobia. There are significant association between demographic variables like Gender, Monthly income, Hours spent on mobile phone, Frequent notification check on mobile phone, Content prefer on social media, while other demographic variables are not significantly associated with the help of chi square test. This emphasizes the need for targeted educational intervention in a form of guideline to improve the understanding level of the students regarding the term Nomophobia.
Limitation
Since the study focuses only on 200 college students in specific Nadiad city, the finding may not be applicable to the general population. The students who were present at the time of data collection, and the student who were willing to participate in the research study. The study might have been conducted within a limited timeframe which can impacted the depth of data collection and analysis, as a longer duration may allow for a comprehensive study. As a descriptive study the study only shows the level of nomophobia among the college students.
Consent and Ethical Consideration
Ethical approval for the present study was obtained from Institutional Ethics Committee (IEC) for Human Research of Maganbhai Adenwala Mahagujarat University, Nadiad. The Ethical Approval Number is (Approval No: MAM Uni/ IECHR/2024/42) (Ref. No: IEC-MAM Uni/2023-24/42). And the Formal written consent was gathered from the samples prior to data collection.
Acknowledgement
We acknowledge the professional support in approval, data analysis and manuscript by editorial committee. Special thanks to all participants college students of study, all faculties who validate the tool, college principal to permitted us to conduct study in their college, and research guide for their constant support and instruction.
Competing of Interest
Authors have declared that no competing of interest exists.
References
-
(2024) Nomophobia.
-
Jamshidifar S, Aliabadi PK, Musavi SJ, Ershad A, Elyasi F (2023) Prevalence of Nomophobia and Associated Factors in Adolescent Female Students: A Cross-sectional Study in Northern Iran. Iran J Psychiatry Behav Sci 17(3): e132909.
-
Buiza-Aguado C, Garcia-Calero A, Alonso-Canovas A, Ortiz- Soto P, Guerrero-Diaz M, et al. (2017) Los videojuegos: una aficion con implicaciones neuropsiquiatricas. Educ Psychol 23(2): 129-136.
-
Shalom JG, Israeli H, Markovitzky O, Lipsitz JD (2015) Social anxiety and physiological arousal during computer mediated vs. face to face communication. Comput Hum Beha 44: 202-208.
-
Caba-Machado V, Díaz-López A, Baridon-Chauvie D, Machimbarrena JM, Ortega-Barón J, et al. (2024) González-Cabrera J. Nomophobia in Mexico: validation of the Nomophobia Questionnaire (NMP-Q) and cross- cultural comparison with Spain. Curr Psychol 43(3): 2091-2103.
-
Notara V, Vagka E, Gnardellis C, Lagiou A (2021) The Emerging Phenomenon of Nomophobia in Young Adults: A Systematic Review Study. Addict Health 13(2): 120- 136.
-
Adawi M, Bragazzi NL, Argumosa-Villar L, Boada-Grau J, Vigil-Colet A, et al. (2018) Translation and Validation of the Nomophobia Questionnaire in the Italian Language: Exploratory Factor Analysis. JMIR M Health UHealth 6(1): e9186.
-
Qutishat M, Rathinasamy LE, Razmy AM, Packianathan S (2020) University students’ nomophobia prevalence, sociodemographic factors and relationship with academic performance at a University in Oman. Int J Afr Nurs Sci 13: 100206.
-
Rodríguez-García AM, Moreno-Guerrero AJ, López Belmonte J (2020) Nomophobia: An Individual’s Growing Fear of Being without a Smartphone-A Systematic Literature Review. Int J Environ Res Public Health 17(2): 580.
-
Ruiz-Palmero J, Sanchez-Rodriguez J, Trujillo-Torres JM (2016) Utilizacion de Internet y dependencia a telefonos moviles en adolescentes. Rev Latinoam Cienc Soc Niñez Juv 14(2).
-
Ranjan R, Das D (2023) Problematic Use Of Smartphone And Nomophobia Among Medical And Nursing Undergraduate Students Of A Tertiary Care Referral Hospital In India And Its Association With Quality Of Life: A Cross-Sectional Observational Study. Psychiatr Danub 3: 407-417.
-
Buctot DB, Kim N, Kim SH (2020) The role of nomophobia and smartphone addiction in the lifestyle profiles of junior and senior high school students in the Philippines. Soc Sci Humanit Open 2(1): 100035.
-
Yildirim C, Correia AP (2015) Exploring the dimensions of nomophobia: Development and validation of a self- reported questionnaire. Comput Hum Behav 49: 130- 137.
-
Lin CY, Griffiths MD, Pakpour AH (2018) Psychometric evaluation of Persian Nomophobia Questionnaire: Differential item functioning and measurement invariance across gender. J Behav Addict 7(1): 100-108.
-
Kaur K (2023) A Descriptive Study to Assess the Level of Nomophobia Among the Students of Selected College of Amritsar, (Punjab). Int J Indian Psychol 11(2).
-
Thakur M, Bharti V (2022) A Study To Assess The Levels Of Nomophobia Among Nursing Students In M.M College Of Nursing, Kumarhatti- Solan. 10(4).
-
Joe B, Cc L (2020) A Descriptive Study to Assess the Prevalence of Nomophobia among School going Children in Selected Districts of Gujarat. Indian J Holist Nurs 11(4): 1-4.
-
Kumar R, Kumari S, Bharti P, Sharma D (2021) Nomophobia: A rising concern among Indian students. Ind Psychiatry J 30(2): 230-233.
- Occupational Stress and Mental Health Outcomes Among Police Officers: A Mini Review
- The Experience of Counterproductive Leadership on Mental Health and Impact on Retention in U.S. Marines: A Phenomenological Study
- Nomophobia in the Digital Age: A Study on College and University Students
- Emotional Regulation in Children with Autism and Learning Disabilities
- Antisemitism on American College Campuses and Its Impact on Jewish Students
- Exploring the Role of Empathy in the Associations of Family Functioning and Purpose in Life with Attitude towards Abortion among Undergraduates: A Moderation Analysis