Peptide Bond Planarity
2D Electric resistivity imaging and Induced polarization (IP) techniques were used to characterize Iron Ore deposit at Diddaye-Potiskum area of Yobe State, Northeastern Nigeria. The area lies between latitudes 110 46' 00'' and 110 56' 00'' N, and longitude 110 00' 00'' and 110 10' 00'' E. The survey was targeted at determining resistivity and chargeability values that are associated with the iron ore deposit and determining possible depth, thickness of the deposit. The protocol chosen were the Wenner-Schlumberger array and dipole-dipole for 2D resistivity and induced polarization imaging respectively. Data processing and interpretation were done using RES2DINV software. This research had characterized the alluvium deposit in the study area into two: the alluvium deposit that is enriched iron ore and alluvium deposit with disseminated iron ore. The portion of the models characterized by resistivity and chargeability values of 32 Ωm to 886Ωm and 0.376 m sec to 2.4 m sec respectively is inferred as highly enriched iron ore alluvium; the other part is the portion of alluvium with disseminated iron ore. The range of resistivity and chargeability values of this portion are respectively 252Ωm to 1161 Ωm and 1.28 m sec to 12.11 msec. The study delineated high resistive medium to coarse sandstone with resistivity value that range from 3182 Ωm to 124309 Ωm at fringes of depth range between 9 m to 11 m at models of profile one, four and six. The fracture inferred in this research has been suggested to be filled with the resistive medium to coarse sandstone. This fracture zone cannot be mapped with IP since it is sensitive to disseminated iron ore that the zone probably contains. It can be concluded that the occurrence of iron ore deposit is probably more at northeast and southwest direction of the survey area that is profile one to six. It can also be inferred that the iron ore deposit is striking in the Northeast-Southwest direction.
Introduction
One of the most fundamental assumptions in protein structure is the peptide bond being planar described in 1953 by Corey and Pauling that (i) N-C bond has 40% double bond character and (ii) planarity of the peptide bond is a “sound structural principle” [1]. The way the electron orbital’s interact in this conjugated resonance system, double bond has restrictions for rotation, as this weakens the resonance interaction. This implied that the peptide unit is largely locked into one of two conformations i.e. cis_, where the alpha carbons are on the same side of the peptide unit and trans, _where they are opposite.
Distortions of individual peptide units from planarity have been examined by both semi-empirical and ab initio techniques for small systems [2, 3, 4, 5, 6, 7]. People’s group used high level Hartree-Fock ab initio calculations to show that peptide bonds exhibit significant flexibility about the N-C bond in the gas phase with little energetic cost [8]. Even Pauling, _et a_l. was aware of the deviations from 180° or 0° could occur with an energetic cost [1, 9].
MacArthur and Thornton and others surveyed peptide and protein databases to show that experimentally derived structures show significant deviation from planar peptide bonds which may be related to handedness of the protein chain [9]. They also calculated peptide bond energy wells around ω=180° from ω angle distributions using Maxwell-Boltzmann relationship, which were further updated by Edison [9]. Some computational and experimental investigations have focused on the entity of peptide bond distortions and on the role that the local context plays in this phenomenon [10, 11, 12, 13, 14, 15]. The deformations in ω have also been explained in terms of pyramidalization, i.e. the extent of tetrahedral sp3 geometry at the carbonyl carbon or the nitrogen atom or at both carbon & nitrogen atoms of the peptide bond and the pyramidalization of carbonyl carbon has been claimed to depend on the main chain ψ torsion angle only [3, 16, 17, 18].
Surprisingly, Chellapa and Rose argued that default restrictions on the peptide planarity angle ω can significantly reduce apparent deviations from peptide unit planarity without consequent increase in R-factors [19]. It may be mentioned here that a model allowing non- planarity has more degrees of freedom than one in which planarity is enforced. Bererton & Karplus using the same set of structures analyzed by Chellapa & Rose carried out the parallel refinements to evaluate the consequences of applying standard ω restraints and tight restraints on peptide planarity [19, 20]. They emphasized the importance of inspecting electron density maps when investigating the agreement between a model and its experimental data.
Mathews has recently put forward the logic that the quality of a refined model of a protein should not be just assessed from its R-factors but together with “Fo-Fc” difference electron density maps [21]. Thus the choice of model is very crucial.
Little attention has been paid to the hybridization of carbonyl carbon and amide nitrogen in terms of the bond angles and N-Cα-C angles when high resolution protein structures are available. Further, the definition of ω involves the Cα atoms of two consecutive amino acids. The deviations of bond angles around Cα can also affect the peptide bond torsion angle ω. Here, we have examined a number of high resolution X-ray crystallographic structures of peptides/proteins to address: (i) the hybridization around carbonyl carbon and amide nitrogen (ii) Cα‘s maintain the sp3 hybridization or not, (iii) the peptide bonds planarity (iv) Δτ and Δω dependence on Φ & Ψ values and (v) there is a relation between deviation’s in ω (Δω) and deviation’s in the angle N-Cα-C (Δτ) or not (Table 1).
- PDB
- Code
- Peptide/Protein
- Resl./
- A°
- 2° Structure
- 2GUD
- Griffithisin
- 0.94 β-sheets
- 2OV0
- Amicyanin
- 0.75 β-sheets
- 1EJG
- Crambin
- 0.54
- Helices
- 1HJE
- Α-conotoxin SI
- 0.75 -S-S- linkage
- 2X7R Fusion intermediate of HIV-1
- 2
- Helices
- 1IRO
- Rubredoxin
- 1.1
- Helices & β sheets
- 1RGE
- Guanyloriboneclease
- 1.15
- Helices & β sheets
- 1LKS
- Lysozyme(hen)
- 1.1
- Helices & β sheets
- 3QL9 ATRX ADD bound to histone
- H3K9me3
- 0.93
- Helices & β sheets
- 1BOY
- Human Tissue factor
- 2.2 β-sheets
- 1IJV β-defensin- chain A
- 1.2
- Helices & β sheets
- 1ZMP α-defensin5-chain-C
- 1.65 β-sheets
- 3LOE α-defensin-1
- 1.56 β-sheets
- 2PNE Snow Flea Antifreeze Protein 0.98
- PPII
- 1YJO
- AmyloidlikePeptides
- 1.3
- -
- 2OL9
- 0.85
- -
- 2OLX
- 1.42
- -
- 2ON9
- 1.51
- -
- 2ONV
- 1.61
- -
- 2ONW
- 1.51
- -
- 2ONX
- 1.52
- -
- 3DGJ
- 1.8
- -
- 4K7T
- Bacitracin-A
- 1.1 Cyclic peptide
- 4BTB
- Pro9
- 1.9 Cyclic peptide
- N(rch)5
- -
- Peptoid(21)
- 1CWA
- Cyclosporine-A
- 2.1 N-methylated
Table 1: Atomic resolution structures used for analysis.
Methods
PDB structures of proteins/peptides containing only helices, only beta sheets, rich in helices, rich in beta sheets, having minimum secondary structure elements, fibril forming peptides, cyclic peptides, peptoids and peptides rich in N-methylated amino acids were downloaded (Table 1). The analysis was done manually.
Results and Discussion
The concept of peptide bond planarity with ω=180° or 0° is thought to be based on, that each angle around carbonyl carbon and amide nitrogen being 120°and each Cα atoms being in ideal sp3 hybridization.
1EJG Deviations in ω from 180°or 0° are interpreted as distortions of individual peptide units from planarity. Analysis of the high resolution crystal structures in terms of; (a) deviation in peptide bond torsion angle (Δω), (b) deviation in bond angle N-Cα-C (Δτ) and, (c) bond angles around carbonyl carbons and amide bond nitrogen for the pdb structures 1EJG & 2GUD are summarized in Table 2. The results for some other pdb structures are presented in (Table ST1).
| Residue | Δτ | Δω | C iα-C i- N i+1 | C iα–C i-O i | O-C-N i i i+1 | C i-N i+1-Cα | C-N -H i i+1 | H-N i+1-Cαi+1 | ||||||||||||||||||
|---|---|---|---|---|---|---|---|---|---|---|---|---|---|---|---|---|---|---|---|---|---|---|---|---|---|---|
| 1-T | -2.7 | -3.8 | 118.3 | 118.8 | 122.9 | - | - | - | ||||||||||||||||||
| 2-T | -1.7 | 2.7 | 112.7 | 124.1 | 123.2 | 128.2 | 120.2 | 111.5 | ||||||||||||||||||
| 3-C | -2.2 | 4.2 | 117.8 | 119.5 | 122.7 | 122.4 | 118.8 | 118.8 | ||||||||||||||||||
| 4-C | 1.3 | 6.7 | 115.7 | 121.4 | 122.9 | 119.7 | 120 | 120.3 | ||||||||||||||||||
| 5-P | 5.3 | 0.5 | 117.7 | 118.6 | 123.7 | 119.6 | 127.5 | 111.8 | ||||||||||||||||||
| 6-S | -2.3 | 4 | 114.4 | 122 | 123.6 | 122.5 | 118.7 | 118.7 | ||||||||||||||||||
| 7-I | 1.8 | -4.8 | 116.6 | 116 | 127.4 | 124.2 | 117.6 | 118.2 | ||||||||||||||||||
| 8-V | 4.9 | 8.1 | 120.3 | 117.9 | 121.2 | 125.5 | 117.8 | 117.7 | ||||||||||||||||||
| 9-A | 0.9 | -4.3 | 117.4 | 119.8 | 122.8 | 119.3 | 120.3 | 120.4 | ||||||||||||||||||
| 10-R | 2.4 | -0.3 | 117.7 | 120.2 | 122.1 | 119.9 | 120.1 | 120 | ||||||||||||||||||
| 11-S | 1.2 | -0.6 | 116.1 | 121.7 | 122.2 | 118.8 | 120.5 | 120.7 | ||||||||||||||||||
| 12-N | 1.3 | -4.2 | 118 | 118.8 | 123.2 | 118.7 | 118.5 | 122.8 | ||||||||||||||||||
| 13-F | 0.8 | 2.7 | 115.8 | 121.1 | 123.1 | 121.4 | 119.3 | 119.3 | ||||||||||||||||||
| 14-N | 2.5 | -6.1 | 118.3 | 119.8 | 121.9 | 118.7 | 120.7 | 120.6 | ||||||||||||||||||
| 15-V | 1.1 | -2.3 | 116.5 | 121.1 | 122.4 | 119.2 | 120.4 | 120.4 | ||||||||||||||||||
| 16-C | 2.4 | 2.1 | 116.6 | 120.7 | 122.8 | 120.6 | 119.8 | 119.6 | ||||||||||||||||||
| 17-R | 3.9 | 5.5 | 119.9 | 118.6 | 122.4 | 120.6 | 119.7 | 119.7 | ||||||||||||||||||
| 18-L | 4.2 | -1.7 | 121.3 | 118.7 | 120 | 119.9 | 120.2 | 119.9 | ||||||||||||||||||
| 19-P | 4.6 | -0.5 | 117.8 | 118.5 | 123.6 | 119.1 | 128 | 111.6 | ||||||||||||||||||
| 20-G | 5.8 | 0.4 | 117.3 | 119.4 | 123.3 | 122 | 118.9 | 119.1 | ||||||||||||||||||
| 21-T | -0.2 | 0.2 | 118.4 | 119.4 | 122 | 122.6 | 118.6 | 118.8 | ||||||||||||||||||
| 22-P | 0.7 | -4.6 | 120.2 | 119.1 | 121.6 | 125.6 | 126.1 | 107 | ||||||||||||||||||
| 23-E | 1.1 | 5.5 | 118.2 | 119.4 | 122.3 | 122.9 | 119.8 | 117.3 | ||||||||||||||||||
| 24-A | 2.5 | -4 | 117.2 | 120.7 | 122.1 | 119 | 120.6 | 120.4 | ||||||||||||||||||
| 25-I | 1.3 | -2.9 | 116.9 | 121.3 | 121.8 | 120.5 | 119.9 | 119.6 | ||||||||||||||||||
| 26-C | 2.7 | -3 | 117.4 | 119.5 | 123.1 | 117 | 121.6 | 121.4 | ||||||||||||||||||
| 27-A | 1.2 | -0.5 | 118.1 | 119.2 | 122.7 | 121.7 | 119.2 | 119.1 | ||||||||||||||||||
| 28-T | 2.1 | -1.3 | 118.5 | 119.5 | 122.1 | 116.5 | 122.7 | 120.8 | ||||||||||||||||||
| 29-Y | 2.7 | 10.6 | 117.3 | 119.7 | 122.9 | 120 | 119.9 | 120.1 | ||||||||||||||||||
| 30-T | 5.9 | 11.4 | 117.5 | 117.5 | 124.7 | 122.3 | 118.8 | 118.9 | ||||||||||||||||||
| 31-G | 4.5 | -9.1 | 118.6 | 118.8 | 122.5 | 121.3 | 119.4 | 119.2 | ||||||||||||||||||
| 32-C | -0.5 | 4 | 114.4 | 121.2 | 124.4 | 120.3 | 120 | 119.7 | ||||||||||||||||||
| 33-I | -0.7 | -6.2 | 113.9 | 122.2 | 123.9 | 122 | 118.9 | 119.1 | ||||||||||||||||||
| 34-I | -2.2 | -3 | 116.6 | 119.6 | 123.8 | 123.1 | 118.8 | 118.2 | ||||||||||||||||||
| 35-I | -1.9 | -0.6 | 116.7 | 121.6 | 121.6 | 121.1 | 119.3 | 119.6 | ||||||||||||||||||
| 36-P | 2.5 | -2.7 | 117.6 | 117.7 | 124.8 | 119.7 | 125.8 | 112.4 | ||||||||||||||||||
| 37-G | 1.1 | 3.7 | 113.9 | 122.8 | 123.3 | 123.6 | 118.8 | 117.6 | ||||||||||||||||||
| 38-A | 2.9 | 9.1 | 117.4 | 119 | 123.6 | 122.6 | 118.3 | 119.1 | ||||||||||||||||||
| 39-T | 0.6 | 1.1 | 116.9 | 120.2 | 122.9 | 121.2 | 119.4 | 119.4 |
Table 2: Deviation in bond angle, N-Cα-C (Δτ) & bond angles around carbonyl carbons and amide nitrogen atoms together with the de
| 40-C | 0.4 | -0.1 | 116.5 | 120.7 | 122.8 | 120.2 | 120 | 119.8 |
|---|---|---|---|---|---|---|---|---|
| 41-P | 3 | 5.8 | 114.9 | 122.1 | 123 | 119.6 | 127.6 | 112.8 |
| 42-G | 6.4 | -2.9 | 118.6 | 118.6 | 124.7 | 121.4 | 119.3 | 119.3 |
| 43-D | 2.6 | -10 | 116.7 | 118.6 | 124.7 | 122.4 | 118.8 | 118.8 |
| 44-Y | -1.6 | 13.3 | 113.1 | 122.3 | 124.5 | 122 | 118.7 | 119.3 |
| 45-A | 6.7 | 5.4 | 116.8 | 119.1 | 124.2 | 122.7 | 118.8 | 118.5 |
| 46-N | - | - | - | - | - | 123.8 | 118.3 | 117.9 |
Table 3: Deviation in bond angle, N-Cα-C (Δτ) & bond angles around carbonyl carbons and amide nitrogen atoms together with the de
| Residue | Δτ | Δω | C iα-C i- N i+1 | C iα–C i-O i | O-C-N i i i+1 | φ | ψ | C i-N i+1-Cα | ||||||||||||||||||
|---|---|---|---|---|---|---|---|---|---|---|---|---|---|---|---|---|---|---|---|---|---|---|---|---|---|---|
| 1 | -1.5 | 2 | 117.8 | 120.8 | 123.4 | - | 120.3 | 121.6 | ||||||||||||||||||
| 2 | 2 | 1 | 115.9 | 120.4 | 123.7 | -77.9 | 130.1 | 121.4 | ||||||||||||||||||
| 3 | -0.6 | -9.8 | 115.4 | 122.6 | 122 | -154.8 | -177.6 | 120.9 | ||||||||||||||||||
| 4 | -1.1 | -0.7 | 114.1 | 121.9 | 124 | -149.1 | 156 | 122.1 | ||||||||||||||||||
| 5 | -1 | -4.8 | 114.1 | 121.7 | 124 | -140.1 | 137.1 | 123.9 | ||||||||||||||||||
| 6 | 0 | -2.2 | 115.5 | 121.3 | 123.2 | -99.4 | 136.4 | 124.2 | ||||||||||||||||||
| 7 | -3.2 | -4.6 | 117.3 | 120.4 | 122.2 | -126.7 | 142.6 | 121.8 | ||||||||||||||||||
| 8 | 3.1 | 8.8 | 113.9 | 121.6 | 124.4 | 107.8 | -163.1 | 121.5 | ||||||||||||||||||
| 9 | 1.8 | -8.2 | 115.3 | 121.1 | 123.6 | 100.5 | -167.1 | 122.3 | ||||||||||||||||||
| 10 | 8.1 | 2 | 118.9 | 119.5 | 121.7 | -98.1 | -1.8 | 122.8 | ||||||||||||||||||
| 11 | 7.3 | -2.8 | 112.1 | 124 | 123.9 | -84.6 | -176.2 | 122 | ||||||||||||||||||
| 12 | 2.1 | -0.9 | 112.9 | 124.3 | 122.8 | 80.7 | -179.3 | 123.4 | ||||||||||||||||||
| 13 | -1.4 | 2.2 | 118.3 | 119.5 | 122.1 | 112.6 | 141.7 | 120.1 | ||||||||||||||||||
| 14 | 5.6 | -8.8 | 115.3 | 119.6 | 125.2 | -65.6 | 148 | 121 | ||||||||||||||||||
| 15 | -0.8 | 8.3 | 113.6 | 112.4 | 124 | -139.2 | 168.1 | 121.8 | ||||||||||||||||||
| 16 | 1.1 | -5.2 | 115.4 | 121.2 | 123.3 | -115.5 | 146.5 | 121.9 | ||||||||||||||||||
| 17 | 7 | -1.5 | 117.6 | 117.8 | 124.6 | -69.9 | -15.5 | 124.3 | ||||||||||||||||||
| 18 | -0.8 | 6.7 | 117.4 | 119.6 | 122.9 | -98.7 | 117.4 | 124 | ||||||||||||||||||
| 19 | 7.9 | 2 | 119.4 | 119.3 | 121.3 | -114.4 | -33 | 118.8 | ||||||||||||||||||
| 20 | 1 | -2.1 | 115 | 122.2 | 122.8 | -157.5 | 157.4 | 123.3 | ||||||||||||||||||
| 21 | -0.6 | -16 | 116.7 | 121.3 | 121.9 | -138.7 | 138 | 123.9 | ||||||||||||||||||
| 22 | -3.2 | -7 | 116.6 | 120.8 | 122.5 | -137.4 | 169.2 | 121.2 | ||||||||||||||||||
| 23 | -0.4 | -23 | 115.1 | 121.4 | 123.3 | -136.3 | 158.7 | 120.1 | ||||||||||||||||||
| 24 | -3.4 | 3.8 | 116.4 | 120.2 | 123.4 | -104.4 | 136.1 | 119.2 | ||||||||||||||||||
| 25 | 3.1 | -8.1 | 113.9 | 121.9 | 124.1 | -147.4 | 153.2 | 124.2 | ||||||||||||||||||
| 26 | -3.4 | -4.4 | 116.6 | 120.8 | 122.5 | -144.8 | -112.1 | 121.6 | ||||||||||||||||||
| 27 | 2.1 | -3.6 | 117 | 120.3 | 122.7 | -73.9 | -23.5 | 123.1 | ||||||||||||||||||
| 28 | -1.6 | -23 | 116.3 | 121.7 | 121.9 | -125.4 | 159.2 | 120.2 | ||||||||||||||||||
| 29 | -1.4 | -7.3 | 116.5 | 121.2 | 122.4 | -82.1 | 112.6 | 123.6 | ||||||||||||||||||
| 30 | 3.6 | 3.9 | 117.4 | 121 | 121.5 | -71.3 | -32.3 | 121.3 | ||||||||||||||||||
| 31 | -1.1 | -15 | 114.6 | 121.2 | 124 | -160.6 | 158.4 | 120.8 | ||||||||||||||||||
| 32 | -2.5 | -2.8 | 115.5 | 121.6 | 122.8 | -121.6 | 142 | 123.1 | ||||||||||||||||||
| 33 | -4.1 | 7.8 | 116.2 | 121.4 | 122.4 | -119.4 | 113.1 | 121.6 | ||||||||||||||||||
| 34 | -2.8 | 3.5 | 116.6 | 121.6 | 121.7 | -114.7 | 118.4 | 121.5 | ||||||||||||||||||
| 35 | 1.8 | -1.7 | 116.1 | 120.9 | 122.9 | 56.7 | 36 | 123.5 | ||||||||||||||||||
| 36 | 5.3 | 7.2 | 118.5 | 118.7 | 122.7 | 90.3 | -16 | 122.4 | ||||||||||||||||||
| 37 | -0.2 | 4.4 | 115.8 | 122.4 | 121.8 | -89.5 | 123.4 | 123.7 | ||||||||||||||||||
| 38 | 4.4 | -5.7 | 116 | 120.5 | 123.4 | -82.8 | 133.9 | 121.6 | ||||||||||||||||||
| 39 | 0 | 0.4 | 116.2 | 120.3 | 123.5 | 133.7 | 112 | 122.5 | ||||||||||||||||||
| 40 | 1.2 | 7.1 | 115.1 | 121.7 | 123.1 | 131.2 | -161.5 | 122.5 | ||||||||||||||||||
| 41 | 2.3 | 6.1 | 115 | 122 | 123 | -94.5 | -168.4 | 123.4 | ||||||||||||||||||
| 42 | 5.9 | -2.1 | 116.2 | 121 | 122.8 | -109.2 | 2.7 | 120.6 |
Table 4: Deviation in bond angle, N-Cα-C (Δτ) & bond angles around carbonyl carbons and amide nitrogen atoms together with the de
| 43 | 3.8 | 1.6 | 115 | 122.4 | 122.6 | -76.6 | -178.4 | 121 |
|---|---|---|---|---|---|---|---|---|
| 44 | 3.5 | 1.2 | 114.8 | 120.8 | 124.4 | 65.7 | -162.3 | 122.4 |
| 45 | -1.8 | 1 | 115.9 | 120.5 | 123.6 | -124.8 | 143.8 | 121 |
| 46 | 2 | -5.7 | 116.7 | 120.4 | 123 | -60.7 | 125.1 | 122.1 |
| 47 | 1.3 | -16 | 116.9 | 120 | 122.9 | -70.9 | 161.7 | 119.2 |
| 48 | 0 | -3.4 | 114.8 | 122.4 | 122.8 | -59 | 159.3 | 121.8 |
| 49 | 1.5 | -7.2 | 114.6 | 120.5 | 125 | -88.1 | 131.7 | 123 |
| 50 | -1.9 | 1 | 116 | 119.9 | 124.1 | -95.7 | 117.1 | 120.9 |
| 51 | -2 | -0.2 | 115.4 | 120.9 | 123.7 | -109.9 | 123.9 | 120.5 |
| 52 | 0.4 | -10 | 115.5 | 121.4 | 123.1 | -69.7 | 131.6 | 120.3 |
| 53 | 1.9 | -4.1 | 114.8 | 123.3 | 121.9 | -75.8 | 175.4 | 119.9 |
| 54 | 1.4 | 0.8 | 116.5 | 120.9 | 122.6 | -58.8 | 129 | 122.7 |
| 55 | 5.9 | -0.2 | 117.6 | 119.9 | 122.5 | 69.1 | 12.5 | 120.8 |
| 56 | 0.9 | 1.7 | 115.2 | 120.8 | 123.9 | -98.8 | 137.8 | 120.7 |
| 57 | -0.5 | -5.8 | 115.2 | 121.3 | 123.5 | -150.1 | 159.1 | 120.2 |
| 58 | -0.6 | -1.6 | 114.8 | 120.2 | 125 | -69 | 124.5 | 124.8 |
| 59 | 5.2 | -3 | 117.2 | 120.2 | 122.6 | -106.9 | -21 | 120.9 |
| 60 | -2.6 | 0.1 | 116.1 | 120.4 | 123.5 | -150.5 | 147.1 | 119.6 |
| 61 | 0.2 | -5.2 | 114.8 | 120.9 | 124.3 | -153.7 | 144.5 | 121.9 |
| 62 | -1.9 | -1.6 | 114.3 | 120.4 | 125.2 | -123.5 | 123.3 | 121.8 |
| 63 | -2.4 | -13 | 116 | 120.6 | 123.4 | -120.5 | 130.3 | 120 |
| 64 | -2.5 | 3 | 118.1 | 119.8 | 122 | -99.1 | 134.3 | 119.7 |
| 65 | -1.1 | -6 | 112.9 | 120.6 | 126.4 | -153.4 | 162.6 | 123.5 |
| 66 | -2.2 | -2.1 | 117.9 | 120.3 | 121.6 | -150.7 | -112.6 | 121.7 |
| 67 | -2.2 | -2.1 | 117.1 | 117.4 | 125.5 | -12.4 | -24.8 | 123 |
| 68 | -1.6 | -14 | 115.4 | 121.7 | 122.9 | -126.6 | 178.9 | 120.6 |
| 69 | -2.5 | -0.2 | 115.6 | 121.3 | 123.2 | -81.1 | 115.3 | 121.8 |
| 70 | 2.3 | 11.3 | 117.5 | 120.6 | 121.8 | -82.3 | -35.7 | 119.2 |
| 71 | -2.8 | -11 | 115.2 | 121.9 | 122.9 | -160.7 | 145.3 | 122 |
| 72 | 0.3 | -11 | 114.2 | 122.6 | 122.9 | -133 | 145.2 | 122.7 |
| 73 | -3 | -6.7 | 116.8 | 120.6 | 122.6 | -145.3 | 148.9 | 119.6 |
| 74 | 0.9 | -6.7 | 114.5 | 123 | 122.4 | -149 | 164.4 | 122.5 |
| 75 | -3.8 | -0.3 | 114 | 122 | 124 | -134 | 148.7 | 119.5 |
| 76 | 2.2 | -5.1 | 114.1 | 121.9 | 124.1 | -100.5 | 171.2 | 119.2 |
| 77 | 3.3 | -2.1 | 118.6 | 120.8 | 120.5 | -59.4 | -22.7 | 123.8 |
| 78 | 3.2 | -1.8 | 117.4 | 121 | 121.6 | -86.3 | 2.9 | 122.8 |
| 79 | 4.4 | -3.1 | 118.3 | 119.4 | 122.2 | 79.8 | 11.5 | 120.6 |
| 80 | 0.3 | 6.5 | 115.9 | 121.9 | 122.2 | -86.5 | 147.1 | 123.2 |
| 81 | 0.2 | -8.7 | 113.5 | 122.7 | 123.7 | -117.7 | 145.3 | 124.1 |
| 82 | -2.4 | -2.7 | 116.2 | 120.9 | 122.9 | -124.1 | 125.5 | 120.1 |
| 83 | 0.8 | 6.2 | 116 | 122.7 | 121.2 | 82.1 | -167.2 | 121 |
| 84 | 3.7 | -9.9 | 114.6 | 120.2 | 125 | -64 | 147.4 | 123 |
| 85 | -1.8 | -0.3 | 115.4 | 120.9 | 123.8 | -132 | 137.9 | 122.2 |
| 86 | 0.7 | 5.9 | 114.9 | 120.9 | 124.2 | 118.6 | -159.5 | 123.8 |
| 87 | 4.8 | 9.3 | 115.8 | 121.2 | 123.1 | -107.8 | 168.2 | 123.2 |
| 88 | 4.3 | -1 | 117.6 | 119.4 | 123.1 | -122.4 | 1 | 122.4 |
| 89 | 4.3 | -1.8 | 114.9 | 122.5 | 122.6 | -75 | -176 | 120.6 |
| 90 | 4.8 | -3.9 | 114.4 | 121.7 | 123.8 | 73.7 | -157 | 120 |
| 91 | -2.2 | 7 | 117.2 | 120.3 | 122.5 | -137.1 | 150.9 | 122.6 |
| 92 | 2.2 | -9.6 | 114.4 | 123.5 | 122 | -93.2 | 143.1 | 122.6 |
| 93 | -3 | 4.1 | 116.5 | 120.5 | 123 | -138.9 | 147.3 | 122.1 |
| 94 | 1.7 | -14 | 114.4 | 121.5 | 123.8 | -129.5 | 142 | 123.1 |
| 95 | -2.7 | 2.3 | 116.7 | 120.3 | 122.9 | -105.5 | 137.6 | 122.1 |
| 96 | -0.7 | -1.3 | 116.3 | 119.7 | 124 | -135.9 | 143.4 | 122 |
| 97 | 1.7 | -0.7 | 114.3 | 122.6 | 123.1 | 56.1 | 49.3 | 120.8 |
| 98 | 0.2 | -16 | 114.1 | 122.5 | 123.4 | -117.3 | 175.3 | 122.6 |
| 99 | -4.1 | -1.2 | 117.6 | 120.2 | 122.2 | -131.5 | 108.9 | 119 |
| 100 | -0.9 | 0.7 | 114.3 | 120.6 | 125.1 | -74.6 | 129.7 | 123.6 |
| 101 | 2.4 | 2.6 | 118.4 | 119 | 122.5 | -98.5 | -39.6 | 120.6 |
| 102 | -1.3 | -6.7 | 114.1 | 121.1 | 124.7 | -157.9 | 156.5 | 124.2 |
| 103 | -1.4 | -12 | 115.5 | 120.6 | 123.9 | -126.1 | 116.1 | 122.5 |
| 104 | -3 | -4.1 | 118.7 | 121 | 120.4 | -110.2 | 179.5 | 119.4 |
| 105 | 2.6 | -2.5 | 115 | 120.7 | 124.3 | 175.3 | -162 | 120.8 |
| 106 | -2.3 | 4.3 | 115.5 | 120.1 | 124.4 | -143.9 | 141.9 | 118.8 |
| 107 | 0.4 | -5.6 | 114.2 | 121.7 | 124 | -150.4 | 153 | 123.2 |
| 108 | -2.2 | -12 | 116.7 | 121.4 | 122 | -134.7 | -113.1 | 119.8 |
| 109 | 4 | -3.1 | 116 | 120 | 124 | -71.4 | -24.6 | 122 |
| 110 | -1.5 | -7.2 | 115.3 | 120.8 | 123.9 | -128.1 | 178 | 121.1 |
| 111 | -3 | 2 | 116.3 | 120.6 | 122.8 | -86.9 | 102.7 | 122.5 |
| 112 | 2.6 | 7.2 | 117.3 | 120 | 122.7 | -71.3 | -44.6 | 119.8 |
| 113 | 0.7 | -7.4 | 114.2 | 122.4 | 123.4 | -155.6 | 156.2 | 124.8 |
| 114 | -0.2 | -8 | 115.1 | 120.9 | 124 | -125.2 | 140.1 | 124.1 |
| 115 | -2.6 | 5.1 | 115.8 | 119.2 | 124.7 | -115.6 | 106.2 | 122 |
| 116 | -1.9 | -2.4 | 116 | 120.4 | 123.6 | -98.2 | 124.2 | 122.3 |
| 117 | -3.2 | 10.3 | 116.5 | 120.2 | 123.3 | -107.4 | 125.9 | 119.6 |
| 118 | 0.3 | -11 | 114.4 | 121.4 | 124.6 | -154.3 | 161.1 | 121.7 |
| 119 | -2 | -2.1 | 116.4 | 121 | 122.6 | -99.1 | 131.9 | 123.4 |
| 120 | 0.4 | -1.1 | 116.9 | 119.7 | 123.4 | -97.3 | 117.8 | 123.2 |
| 121 | -0.2 | - | - | - | - | -101.9 | - | - |
Table 5: Deviation in bond angle, N-Cα-C (Δτ) & bond angles around carbonyl carbons and amide nitrogen atoms together with the de
The deviation in bond angles Cα-C-N around carbonyl carbon and C-N-Cα around amide nitrogen from 120° will lead to changes in position of carbonyl oxygen and amide A careful look at the results in tables 2 & ST1 reveals that: (i) there is a substantial deviation in the value of peptide bond torsion angle ω from 180°& 0° and the magnitude of Δω is greater than the magnitude of Δτ. To see the dependence of Δτ and Δω on the φ, ψ values, the plot of Δτvsφ & Δω v sφ and Δτ vs ψ & Δω vs ψ is shown in Tables 2 & ST1 and Figure 1 for 2GUD & Figure S1 for 2PNE. It is obvious from the plots that there is some similarity between the Δτ vs φ & Δω vs φ plots and likewise between the Δτ vs ψ & Δω vs ψ plots. This reflects the dependence of Δτ and Δω on φ, ψ values i.e. on secondary structures.
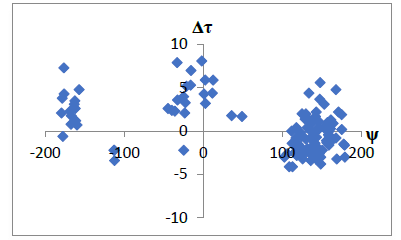
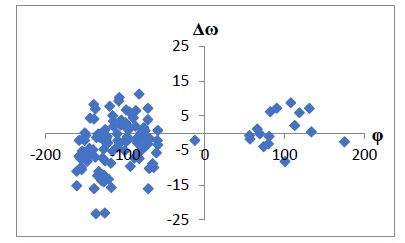
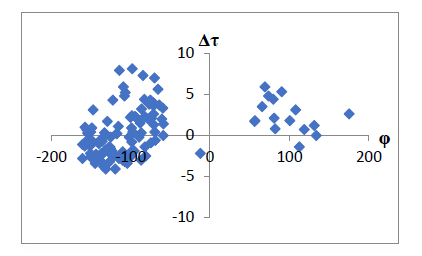
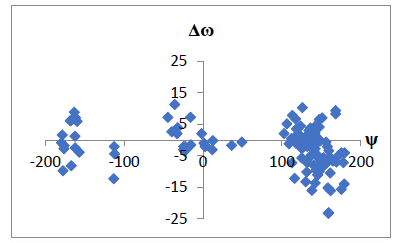
Figure1: Plot of Δτ vs φ & Δω vs φ and Δτ vs ψ & Δω vs ψ for 2GUD showing the similarities of Δτ/Δω vs φ and ψ.
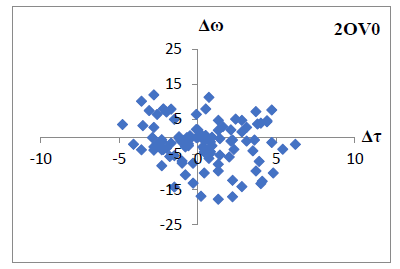
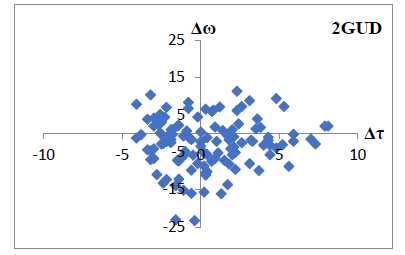
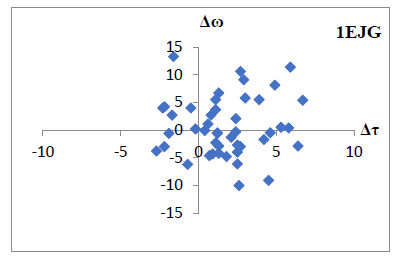
Figure2: Plot between Δτ and Δω (in degrees) for the PDB structure 2GUD, 2OV0 and 1EJG showing the relationship between the two which depends on the secondary structure element and compactness of the structure.
Plots of the deviation in N-Cα-C(Δτ) vs the deviation in ω for structures (2GUD, 2PNE, 2OV0,1EJG,1LKS,2X7R,1IJV,1ZMP) having different secondary structure elements (only helices, only beta sheets, rich in helices, rich in beta sheets, the structure having minimum secondary structure elements)are shown in (Figures 2 & S2). This may points to the relation between Δτ and Δω but the relation is not linear. This may be attributed to involvement of two Cα and local effects. The analysis of data in table’s together with the graphical views of the pdb structures point out that the Δτ and Δω values are minimum for helical segments and compact structures and maximum in loops/turns region & terminal residues of helices.
Conclusions
Analysis of the high resolution pdb structures for angles around carbonyl carbons, amide nitrogen’s and Cα atoms rules out the change in hybridization of these atoms. Hence, the six atoms i.e. two consecutive Cα’s, carbon, oxygen, nitrogen and hydrogen (C in peptoids & N-methylated peptides) remain in the same plane and the peptide bond is planar. The changes in the position of Cα’s, carbonyl carbon’s & amide nitrogen’s due to the changes in the back bone angles around these atoms will alter their positions and this will be clearly reflected in the electron density difference map “ Fo-Fc“. The deviations in Δτ and Δω values are found to be minimum for helical segments and compact structures and maximum in loops/turns region & terminal residues of helices.
References
-
Corey RB, Pauling L (1953) Fundamental dimensions of polypeptide chains. Proc R Soc Lond B Biol Sci 141(902): 10-20.
-
Momany FA, McGuire RF, Burgess AW, Scheraga HA (1975) Energy parameters in polypeptides: VII. Geometric parameters, partial atomic charges, non bonded interactions, hydrogen bond interactions, intrinsic torsional potentials for the naturally occurring amino acids. J Phys Chem 79(22): 2361- 2381.
-
Winkler FK, Dunitz J (1971) The non-planar amide group. J Mol Biol 59(1): 169-182.
-
Ramakrishnan C, Balasubramanian R (1972) Stereochemical Criteria for Polypeptide And Protein Chain Conformations. Chemical Biology & Drug Design 4(2): 79-90.
-
Ramachandran GN, Kolaskar AS (1973) The non- planar peptide unit: Comparison of theory with crystal structure data. Biochimica et Biophysica Acta 303(12): 385-388.
-
Renugopala krishnan V, Rein R (1976) Energetics of Deformation of a Peptide Unit -Semiempirical Molecular-Orbital and Ab-Initio Study of N-Methyl Acetamide and N-Acetyl-L-Alanine N-Methyl Amide. Biochim Biophys Acta 434(1): 164-168.
-
Head-Gordon T, Head-Gordon M, Frisch MJ, Brooks CL, Pople JA (1991) Theoretical study of blocked glycine and alanine peptide analogs. J Am Chem Soc 113(16): 5989-5997.
-
Edison AS, Pauling L (2001) The planar peptide bond. Nat Strut Biol 8(3): 201-202.
-
MacArthur MW, Thornton JM (1996) Deviations from planarity of the peptide bond in peptides and proteins. J Mol Biol 264(5): 1180-1196.
-
Berkholz DS, Driggersa CM, Shapovalovc MV, Dunbrack RL, Karplus PA (2012) Nonplanar peptide bonds in proteins are common and conserved but not biased toward active sites. Proc Natl Acad Sci USA 109(2): 449-453.
-
Chakrabarti P, Bernard M, Rees DC (1986) Peptide- bond distortions and the curvature of alpha-helices. Biopolymers 25(6): 1087-1093.
-
Ramek M, Yu CH, Sakon J, Schaefer L (2000) Ab initio study of the conformational dependence of the non planarity of the peptide group. J Phys Chem A 104(42): 9636-9645.
-
Buck M, Karplus M (1999) Internal and Overall Peptide Group Motion in Proteins: Molecular Dynamics Simulations for Lysozyme Compared with Results from X-ray and NMRS spectroscopy. J Am Chem Soc 121(41): 9645-9658.
-
Rick SW, Cachau RE (2000) The non planarity of the peptide group: Molecular Dynamics Simulations with a polarizable two-state model for the peptide bond. J Chem Phys 112: 5230-5241.
-
Esposito L, Vitagliano L, Zagari A, Mazzarella L (2000) Pyramidalization of backbone carbonyl carbon atoms in proteins. Protein Sci 9(10): 2038-2042.
-
Roberto I, Luigi V, Luciana E (2011) Peptide Bond Distortions from Planarity: New Insights from Quantum Mechanical Calculations and Peptide/Protein Crystal Structures. PLoS ONE 6(9): e24533.
-
Luciana E, Nicole B, Alfonso De S, Rita B, Luigi V (2013) Inter play between Peptide Bond Geometrical Parameters in Non globular Structural Contexts. Bio Med Research International.
-
Brereton AE, Karplus PA (2016) On the reliability of peptide non planarity seen in ultra-high-resolution crystal structures. Protein Science 25(4): 926-932.
-
Chellapa GD, Rose GD (2015) On interpretation of protein X-ray structures: Planarity of the peptide unit. Proteins 83(9): 1687-1692.
-
Mathews BW (2016) How planar is planar peptide bond. Protein Science 25(4): 776-777.
-
Cindy WWu, Ken AD, Ronald NZ (2003) Structural and Spectroscopic Studies of Peptoid Oligomers with α-Chiral Aliphatic Side Chains. J Am Chem Soc 125(44): 13525-13530.
- Sense, Gravity, Parity & Chirality in Mathematical Physics
- Quantum Lattice Simulations PHYSICS: Microcircuit Particle Formation and Observable Macroscopic Irreversible Time - A Discrete Lagrangian with Cellular Automata Framework
- Quantum Biology from Biomacromolecule to Cell, and Central Dogma Described by Quantum Theory
- Focus, Agility, Speed and Technology (FAST) for Sustainability and Growth
- Square Root Metric Geometry and Pati-Salam Model in Curved Space-Time
- A Simple System Demonstrating the Mpemba Effect in Classical Mechanics