Machine Learning-Based Sentiment Analysis of Tweets about COVID-19 Vaccines
The objectives of the study were two-fold: (1) To group mindsets related to COVID-19 vaccinations and examine their distribution by country. Then, based on this distribution, the study aimed to compare the number of vaccinations, deaths, and cases and analyze the relationship between these numbers and the mindset of the society. (2) To analyze people's tweets about the vaccine and compare them with the number of people vaccinated, in order to determine if there was a significant result. The study analyzed data from 17 countries among the top 20 countries with the highest gross national product in 2020. Machine learning methods such as multinomial logistic regression, random forest, naive Bayes, and ridge classification were used to evaluate the performance of predictive models. The accuracy achieved by these models were as follows: naive Bayes (76%), random forest (85.03%), ridge classification (85.72%), and multinomial logistic regression (86.67%). In conclusion, the study found that with increasing vaccination rates, positive interpretations of vaccines differed more than other moods. The study contributes to advancing awareness of the public's perception of COVID-19 vaccinations and supports the goal of eliminating coronavirus from the planet.
Introduction
COVID-19 is caused by the SARS-CoV-2 virus and has resulted in millions of illnesses and deaths worldwide [1]. The pandemic has also impacted daily life, with many people experiencing disruptions in education, travel, and social activities [2]. SARS-CoV-2 was discovered in late 2019 at a common seafood bazaar in China, infecting millions of people [3]. Public decisions and the direction of present and future plans are largely influenced by public opinion of COVID-19. Natural language processing has been used to public interaction data from online surveys and social media in order to acquire insights into how public opinion is changing today. Social media is presently the best tool to convey emotions, and Twitter® can assist you in understanding what’s going on in people’s minds. The sheer volume and variety of data on Twitter® is of interest to many researchers. Social media data can be used to measure people’s opinions on various topics, but the amount of data can often be too large for visual inspection and interpretation. By using social media data, not only current opinions but also various inferences for the future can be obtained. One of the important reasons for analysis is that people write their own opinions in any three posts.
In general, the reasons why people prefer Twitter® range from speed, easy access, instant notification, accurate sources and entertainment. People are now able to get news instantly. As they took advantage of the opportunities provided by the technological age, they started to spend most of their time with this technology [4]. If emotions, behaviors, or their effects are not purposeful, then such behaviors can be seen as deviations; if they are intended, then those behaviors can be read as violations. With social media and content management systems, we can obtain a continuous stream of information that can help us gain insights into various aspects of our society. This data has the potential to inform and support the processes involved in social policy decision-making. In addition to providing timely insights that help decision-makers, the emotional factors included in Twitter® streams may also provide real-time warning signs that necessitate closer observation or more thorough analysis [5].
The objectives of the study were two-fold: (1) To group mindsets related to COVID-19 vaccinations and examine their distribution by country. Then, based on this distribution, the study aimed to compare the number of vaccinations, deaths, and cases and analyze the relationship between these numbers and the mindset of the society. (2) To analyze people’s tweets about the vaccine and compare them with the number of people vaccinated, in order to determine if there was a significant result. The remaining sections are organized as follows. Section 2 provides a summary of the subjective literature that is relevant to the study. Section 3 includes the dataset and a thorough explanation of how machine learning techniques were used. Section 4 of a research paper describes the methodology and techniques used in the study. We present our findings and recommendations for further study in the concluding section.
Background
Despite the extensive research in this area, there is still much to learn and no single effective answer to fully understand human behavior. This is due to the fact that human behavior involves various fields of study, including philosophy, personality, social and behavior [6]. Therefore, it is necessary to analyze people’s attitudes when negative situations arise. The worldwide catastrophe triggered by COVID-19 altered global perspective, altered how people responded with a large-scale tragedy, and imposed a major psychological load on individuals [7]. Especially after the vaccine studies started, the society was divided into two and different ideas were put forward. While some people argued that the vaccine would not be beneficial, others argued that the vaccine was beneficial.
In order to find relevant tweets within a two-week period from January 14 to January 28, 2020, Ridhwan and Hargreaves created a list of COVID-19-related hashtags [8]. By using an API, tweets were retrieved and saved as plain text. The frequency-related terms were selected and examined, including vaccination, racial prejudice, and infection prevention techniques. The next step was to do sentiment analysis to determine each tweet’s emotional valence (positive, negative, or neutral) and prevailing emotion (anger, disgust, fear, joy, sadness, or surprise). In the end, an unsupervised machine learning algorithm was used to identify and track relevant themes in tweets over time.
In the Philippines, a Naive Bayes algorithm was used to categorize English and Filipino tweets in order to perform a sentiment analysis on the COVID-19 immunization. They discovered that the majority of tweets from the Philippines were in support of vaccination [9]. In another study Villavicencio C, a sentiment analysis was performed on 154 items from blogs and online media published during the COVID-19 epidemic using TextBlob. The authors concluded that more than 90% of the publications expressed support for vaccines [10]. Melton CA, et al. performed Latent Dirichlet Allocation topic modeling and sentiment analysis on textual data. Data about COVID-19 vaccinations was gathered from thirteen Reddit groups [11]. They discovered that there were often more positive than negative attitudes in these groups. Furthermore, they discovered no discernible shift in public opinion since December 2020. A sentimental analysis model was used on Twitter to define Indian individuals’ attitudes regarding COVID-19 vaccinations. The authors discovered that 35 percent of the tweets were favorable towards COVID-19 vaccine, whereas 16.65 percent were negative [12].
Sattar and Arifuzzaman performed sentiment analysis and natural language processing tools to gather information on public perceptions of the COVID-19 vaccination campaign [13]. Their findings indicate that rather than some negative side effects of various vaccinations, people had favorable attitudes regarding receiving the COVID-19 vaccine. The study conducted by Kwok et al. used machine learning techniques to extract subjects and sentiments about the COVID-19 immunization on Twitter [14]. The researchers gathered 31,100 English tweets from Australian Twitter users between January and October 2020 that contained COVID-19 vaccine-related keywords.
Materials and Methods
The Dataset
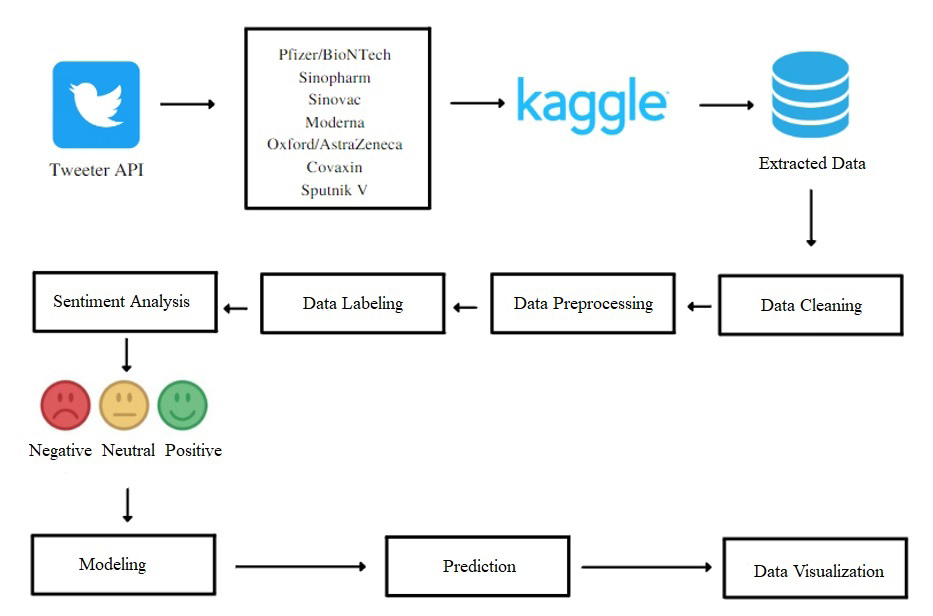
The dataset for the performed study was obtained from Kaggle website, which includes various sorts of tweets on the COVID-19 vaccines [15]. The dataset includes a variety of variables, such as user name, user followers, location, and other information, in addition to the tweet and user ratings, such as the total number of people who marked the tweet as a favorite. We concentrate primarily on three of these: the tweet text, user location and the date when the tweet was created column. The original dataset underwent the following preprocessing processes. First, since a tweet’s location is crucial information for our study, we first eliminated any tweets that lacked location data, leaving us with 294,853 tweets. The remaining tweets were then updated to eliminate any missing content and dates. We ultimately received 183,182 tweets for our purpose of data analysis. The dates between January 1, 2020 - November 1, 2020 and January 1, 2022 - March 4, 2022 were not included in the analysis dates due to the small amount of tweets compared to the entire data. Thus, the data were analyzed for the period between November 1, 2020, and January 1, 2022. In addition, the data were analyzed for 17 countries among the 20 countries with the highest gross national product in 2020. These countries are listed as India, the United Kingdom, the United States, Germany, Canada, the Netherlands, Turkey, China, Russia, Brazil, Australia, Italy, Spain, Switzerland, Saudi Arabia, Mexico and Indonesia. The sequence of study steps was represented in Figure 1.
Data Preprocessing
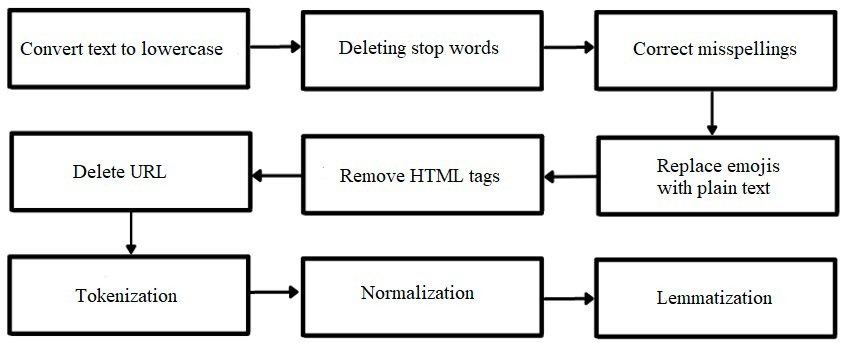
In order to apply machine learning algorithms to the data, the raw data must go through a preprocessing phase. Firstly, the text data was converted to lower case. This is because even though it is the same word, Python recognizes it as a different word when some letters are bigger than others. For this reason, converting texts to lower case is an important step, called “normalization” in the literature. Punctuation marks in sentences were deleted because they did not make sense. Then special characters and numeric expressions were removed from the text. With the tokenization process, which is described as separating sentences into tokens in the literature, sentences were divided into parts. Words in stop lists, called “stopwords”, are deleted from the text because they have no measurable value. Some common “stopwords” are: “that, and, for, is”. A list of stop words was defined in the “Python nltk” library and applied to all data. A spell check was done to avoid confusion, to correct misspelled words. Lemmatization helps to separate words into their roots. In this way, only the root structure of words found at different times was left in the text. Another step is the replacement of emojis with their corresponding meanings. For instance, “:) / :-)” in English is like “smiley”. The data preprocessing steps are given in Figure 2.
Sentiment Analysis
Sentiment analysis is the process of analyzing and assessing a text’s sentiment. The main objective is to determine if user content reflects positive, negative, or neutral feelings. In other words, sentiment analysis can track users’ actions as they interact with various social media services, which helps us understand how individuals feel [16].
Whether using deep learning or conventional machine learning techniques, cleaning and preprocessing the text data is a crucial step in creating an effective sentiment analysis model. White space, punctuation marks, non-characters, Retweet (RT), “@ links,” and stop words are common in tweets. Python libraries might be used to exclude these characters because they don’t include any data that would be relevant for sentiment analysis. After cleaning the tweets, the next step is often to tokenize the text data into individual words. These words can then be lemmatized or stemmed to reduce them to their root form. Once the text data has been preprocessed, it can be transformed into numerical vectors using methods such as word embedding or term frequency-inverse document frequency (TF-IDF). The TF- IDF is a statistical metric that indicates how essential a word is in a collection or corpus of documents. This measurement takes into account both the word’s frequency in the target document and its frequency in the corpus’s other texts. The more frequently a term appears in a target document and the less frequently it appears in other texts, the more significant it is. The scikit-learn library’s vectorizer class is typically used to compute TF-IDF [17].
Machine Learning Algorithms
A branch of artificial intelligence known as “machine learning” uses algorithms and statistical models to let computers learn from data without having to be explicitly programmed. Machine learning employs a variety of learning paradigms, such as reinforcement learning, unsupervised learning, and supervised learning (Figure 3) [18]. Common machine learning models include classification, regression, clustering and decision making. The implementation of suitable machine learning algorithms may increase the effectiveness of data analysis and processing while also resolving certain practical issues given the growing amount of data in various fields [19]. In several excellent texts, machine learning is discussed in detail [20, 21, 22]. The study employed four supervised learning algorithms: multinomial logistic regression, random forest, naive Bayes, and ridge classification.
![Figure 3: Types of Machine Learning [23].](/fulltextimages/11497/fig_3.png)
Naïve Bayes Algorithm: The term “Naïve Bayesian” refers to a set of machine learning classification methods based on the Bayes theorem. The Naive Bayes algorithm is based on two major assumptions. The first assumption is that each feature (or characteristic) being categorized is independent of the others. This is known as the “naive” assumption, as in reality, features may be correlated with each other. The second assumption is that each feature contributes independently and equally to the output. In other words, the algorithm assumes that each feature has the same weight in determining the output, which may not always be the case. Two key premises underlie these algorithms: first, that each pair of qualities being classified is independent of the other; second, that each contributes equally and independently to the outcome. Despite its simplicity, the NB provides a high level of capability [24, 25]. NB formula is given as:
( ) ( )() () \ \ P B A P A P A B P B = (1)
where P(A|B) is the posterior probability of A given B, P(B|A) is the likelihood of B given A, P(A) is the prior probability of A, and P(B) is the prior probability of B (also known as the evidence).
Multinomial Logistic Regression: Multinomial Logistic Regression (MLR) is a supervised learning approach that may be used to solve a range of tasks, including text classification [26]. It is a type of regression model that extends logistic regression to classification issues where the output has more than two potential values [26]. The binomial logistic regression model is a very basic extension of the MLR model, and both models largely rely on logit analysis or logistic regression. Multinomial logistic regression, like binary logistic regression, predicts the likelihood of category membership using maximum likelihood estimation. The independent variables might be binary or continuous (ratio in scale or interval) [27].
Ridge Classification: The subspace assumption, on which the ridge classification technique is predicated, asserts that samples of a given class are linearly distributed across subspaces, and that a new test sample for a category will be defined as a linear combination of training samples from the relevant class [28]. The Ridge Classifier is a binary classifier that works by converting the label data to [-1, 1] and then using the Ridge regression method to solve the problem. In the Ridge Classifier, the class with the greatest prediction value is selected as the target class. This means that the Ridge Classifier is a binary classifier, meaning it can only classify between two classes [29]. Finally, the confusion matrix is used to calculate the accuracy of this model.
Random Forest: The Random Forest technique is effective not just in regression and classification, but also in variable selection [30, 31]. The idea of ensemble learning is used in random forest to include many trees into one algorithm [32, 33]. The forecast for a new observation is then computed by adding the expected values provided by each individual tree in the forest. The three primary parameters for random forest algorithms are “the number of trees,” “the minimum number of observations in the terminal node,” and “the number of suitable features for splitting” [34, 35]. In the literature, there exist detailed mathematical explanations for random forests [30].
Performance Metrics
The true positive (TP), true negative (TN), false positive (FP), and false negative (FN) matrices are the four basic matrices used to predict performance evaluations. True positives are instances where the outcome is projected to be positive but really turns out to be positive as well. Cases that are properly expected as negative are considered true negatives. False positives are cases that were expected to be positive but turned out to be negative. False negative instances are those that have been reported as negative but are actually positive.
Accuracy: The percentage of all correctly anticipated transactions is known as the accuracy rate [30].
Accuracy = ( TP + TN) / (TP + FP + FN + TN) (2) Precision: The percentage of correct positive (fraud) predictions [36].
Precision = TP / (TP + FP) (3) Recall (Sensitivity): The percentage of positive observed values that were accurately forecasted as positive. It is also known as the True Positive Rate (TPR) [36].
Recall = TP / (TP + FN) (4) F-measure: The F-measure provides test accuracy, which translates to providing experiment accuracy. It calculates its value using both accuracy and recall. Value 1 is regarded as the ideal value for the f1 score [37].
F1-Score = 2 x [ (Precision x Recall) / (Precision + Recall) ] (5)
Results and Discussion
Timeline of Tweet Reactions
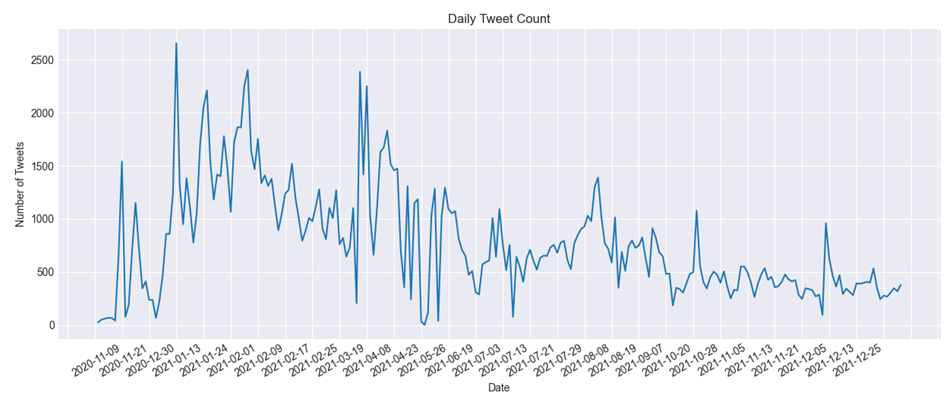
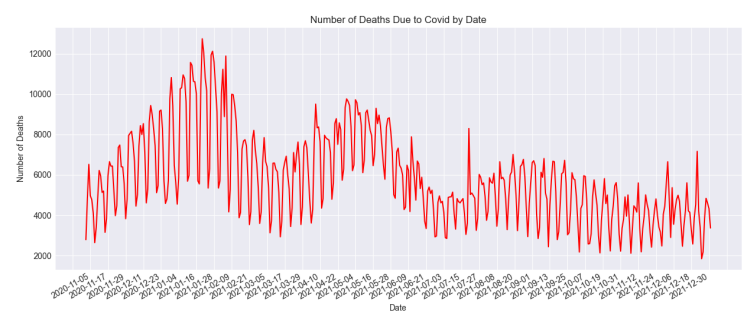
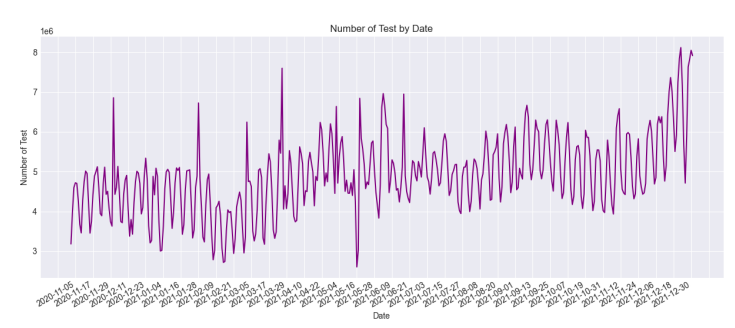
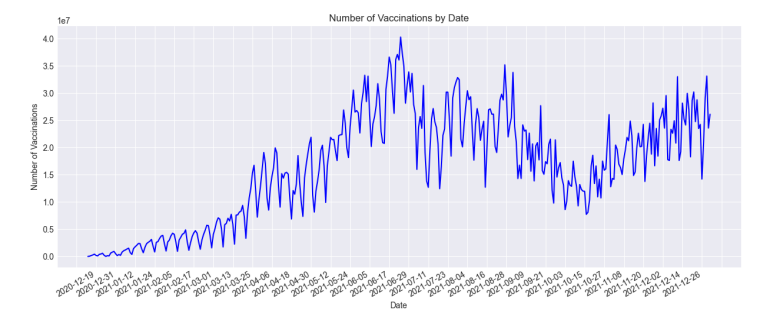
The amount of tweets changes throughout time. By analyzing Figure 4, we can see how the number of tweets related to the vaccination procedure has changed over time. This can provide insights into how public opinion or interest in the vaccination procedure has evolved over time, and can also help identify trends or patterns in the data. From November 2021 to the end of December 2021, the number of tweets related to vaccines was less than 500; from the end of December 2021, it increased to about 3000, showing that when the clinical studies were finished and the vaccinations were going to be distributed widely, people were quite enthusiastic about them. Tweets concerning COVID-19 vaccinations have ranged from 2500 to 500 every month from March 2021 to the present, demonstrating people’s shifting opinions towards them. During the same timeline, Figures 5, 6, and 7 provide detailed information about deaths, number of tests, and number of vaccinations from November 2021 to the end of December 2021.
Sentiment Analysis and Evaluation
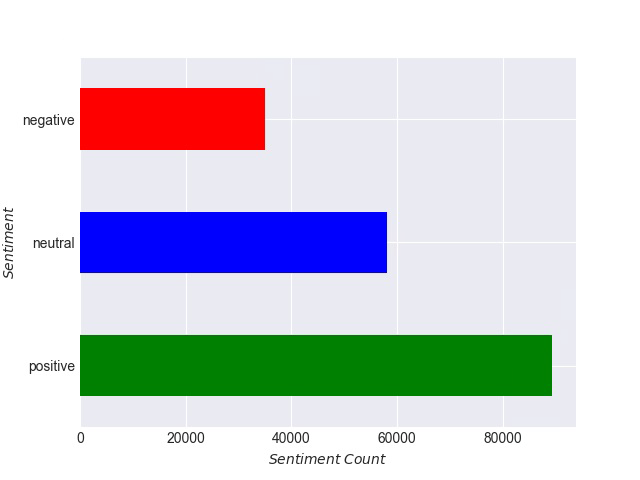
Numbers of Sentiment Criteria: Green, red, and blue bar charts depict the number of tweets categorised as positive, negative, and neutral in Figure 8. In colored bar charts used for sentiment analysis, the x-axis represents the number of tweets or text samples that have been analyzed, while the y-axis represents the different sentiment classes that have been assigned to those tweets or text samples. With the use of the lexicon-based VADER, 182,546 tweets from the datasets were evaluated and divided into three categories: positive, negative, and neutral. Here, 89,394 positive tweets (48.97%), 34,968 negative tweets (19.16%), and 58,184 neutral tweets (31.87%) were found after the analysis. The bulk of tweets were positive; negative reactions were less frequent, showing that confusion, disagreements, and questions about COVID-19 immunization methods remained.
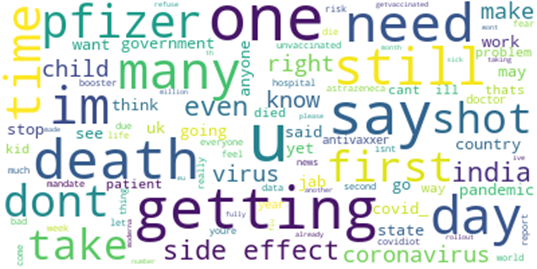
Country-Wise “Prevalent Word” Usage: The most popular terms in the USA are displayed in Figure 9a, including “Pfizer,” which is not a vaccine manufactured there. “Pfizer” was more commonly used than “Moderna,” followed by “side effect,” “shot,” “need,” “time,” and other significant phrases indicating people’s mixed opinions about COVID-19 vaccines. Figure 9b depicts the important phrases utilized in Chinese tweets. Here, the words “covidvaccination,” and “coronavaccine,” were very commonly used. Figures 9c and 9d depict the most often used phrases in Germany and Italy. Vaccine names including “astrazeneca,” “biontech,” “pfizer,” and “moderna” appeared often in their tweets, as did phrases like “corona,” “pandemic,”, “shot,” “first,” and “covid.” Figure 9e depicts the most often used terms in Turkey, such as “coronavirus,” “first,” “case,” “astrazeneca,” and “moderna.”
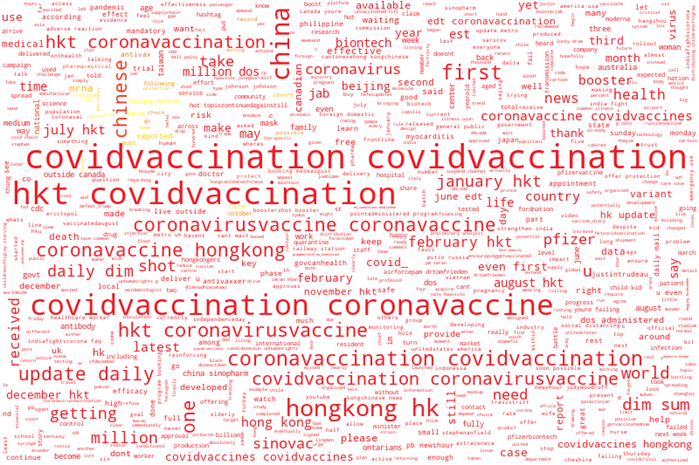
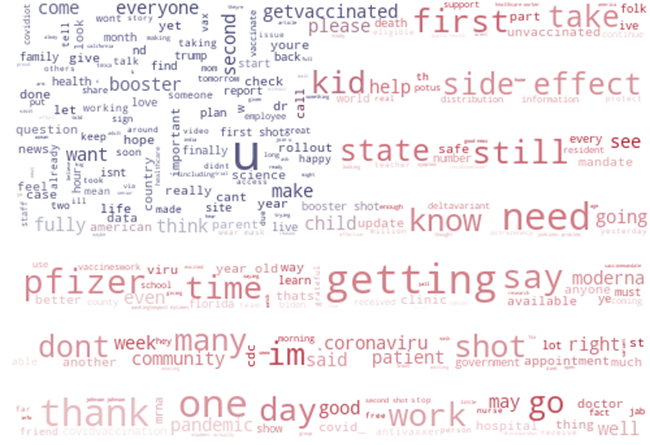
a) Prevalent words in tweets from USA b) Prevalent words in tweets from China
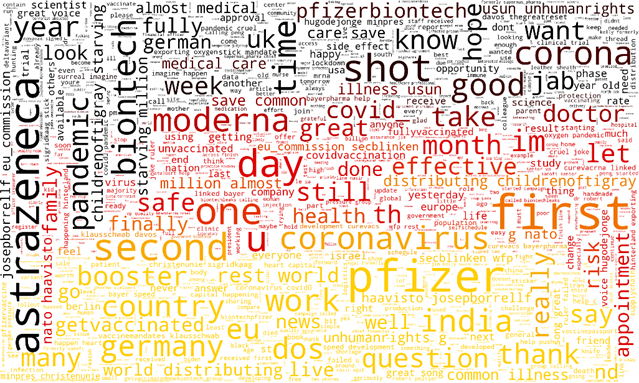
c) Prevalent words in tweets from Germany d) Prevalent words in tweets from Italy
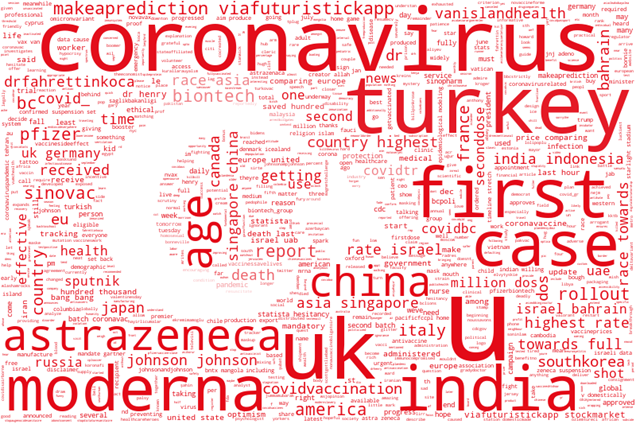
e) Prevalent words in tweets from Turkey Figure 9: Terms used most in different countries.
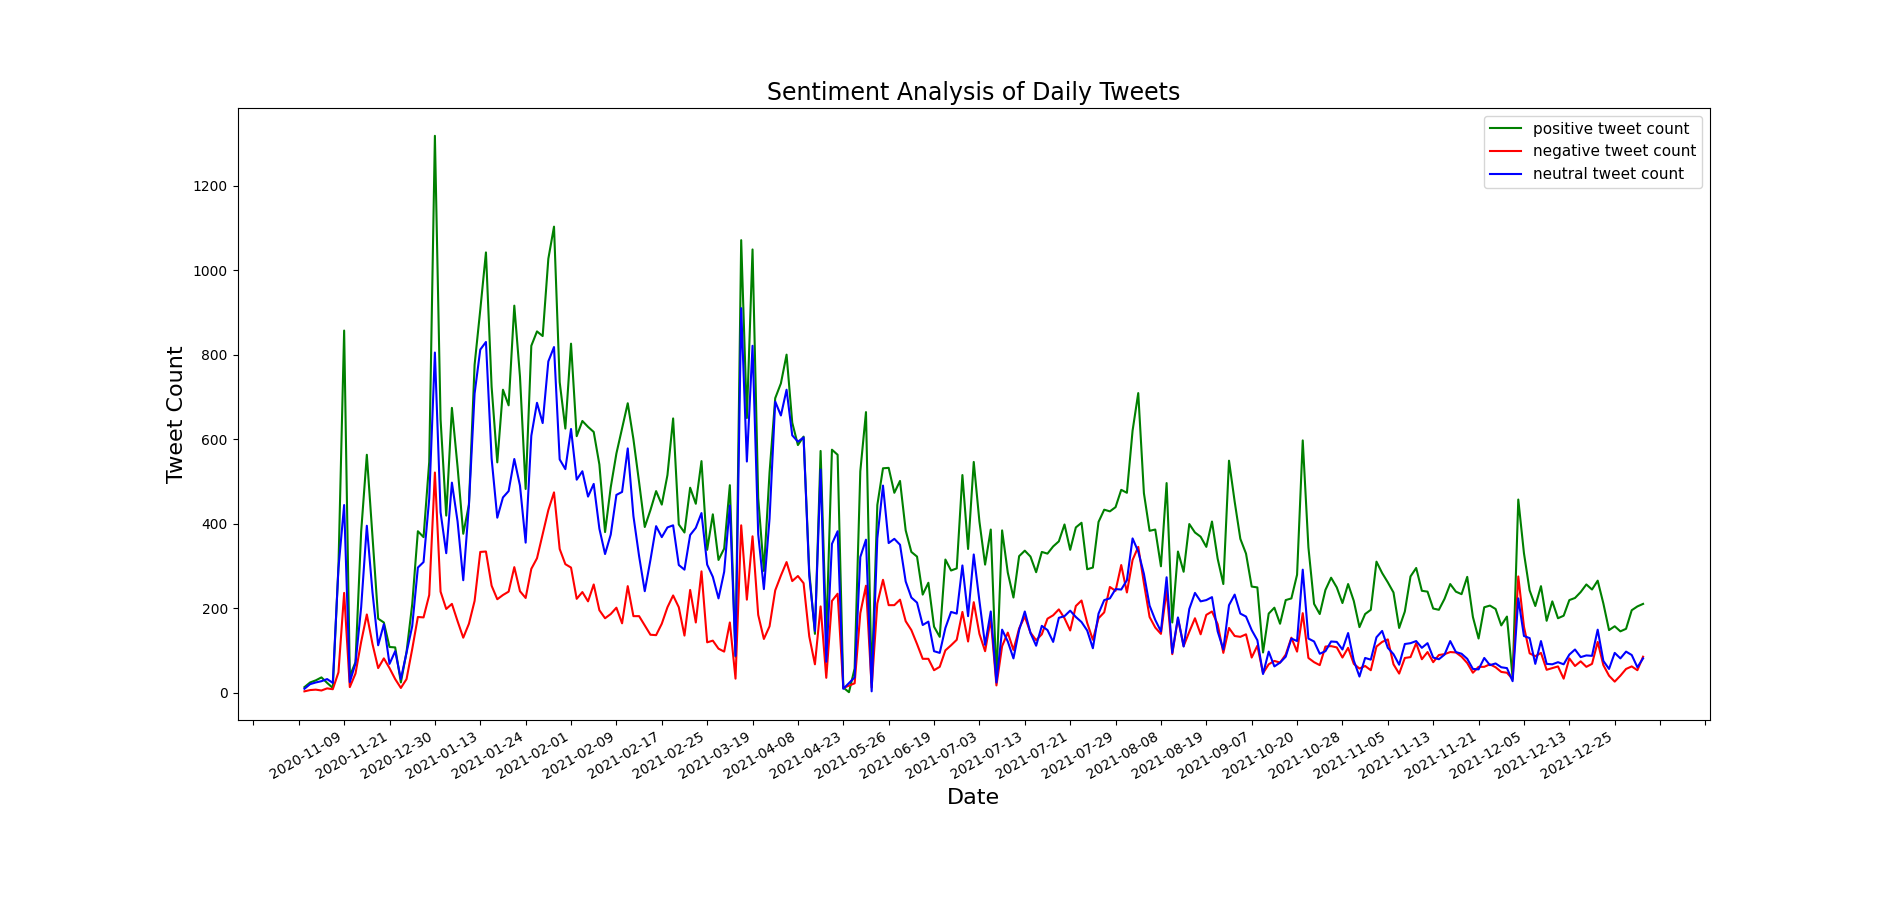
Timeline of Sentiments: How opinions evolved or were rearranged over time is seen in Figure 10. Three distinct colors are used to represent the three sentiment classes. Green, red, and blue are used to represent positive, negative, and neutral sentiments, respectively. Figure 10 demonstrates the pandemic’s changing patterns of feelings or attitudes throughout time. It is obvious that the feelings peaked when the first vaccination trial began at the end of December 2020. Neutral sentiments had a higher polarity than negative sentiments until July 2021 then they followed close fluctuations in recent times.
Sentiment Words according to Polarities: WordCloud was used to organize certain words or concepts into polarity categories. The words used to express positive sentiments
are displayed in Figure 11a. The neutral sentiment words are given in Figure 11c, while Figure 11b displays the words with a negative sentiment.
(a) (b) Prevalent words in tweets (positive sentiment) Prevalent words in tweets (neutral sentiment)
c) Prevalent words in tweets (neutral sentiment) Figure 11: Words according to (a) positive, (b) negative, and (c) neutral polarities.
Modeling
The dataset to be modeled consists of 5 columns and 182,546 rows. The names of these columns are: “user_ location”, “date”, “text”, “polarity_score”, “sentiment_label”. Due to the large dataset, cross validation takes a long time to train the model and the training is interrupted. For this reason, hold out method was used instead of cross validation approach. Using hold out method, the dataset was divided into two parts as 20% testing and 80% training.
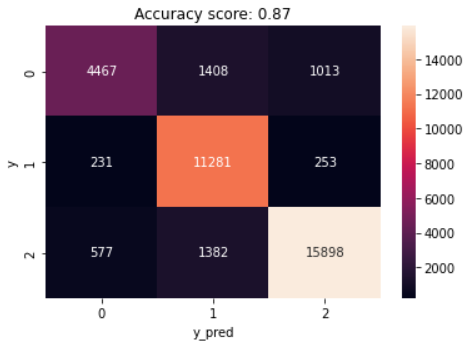
Multinomial Logistic Regression Model Results: Figure 12 shows the confusion matrix for multinomial logistic regression model with the three different polarities. It also corresponds to 0: negative, 1: neutral, and 2: positive. The model correctly classified 15,898 positive sentiments. Although 1,382 and 577 sentiments were mistakenly categorized as neutral and negative, respectively, the positive sentiment was accurately predicted. The confusion matrix correctly identified 11,281 sentiments as neutral, representing the true positive rate, whereas 4,467 were correctly labeled as negative. Additionally, 253 neutral and 1013 negative sentiments were mistakenly categorized as positive, with the largest percentages occurring in the 1,408 negative and 1,382 positive sentiments under the “neutral” sentiment category.
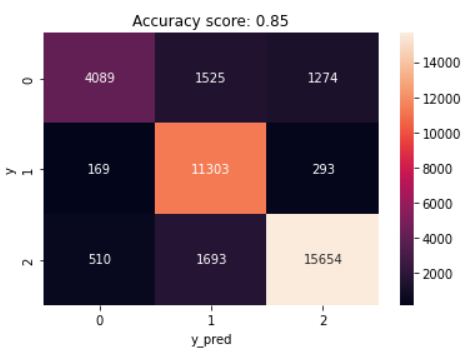
Random Forest Analysis Results: Figure 13 depicts the confusion matrix for the random forest model with three distinct polarities. The model correctly classified 15,654 positive sentiments. Positive sentiment was successfully predicted, however 1,693 and 510 sentiments were incorrectly labeled as neutral and negative, respectively. According to the confusion matrix, 11,303 sentiments were correctly identified as neutral, representing the true positive rate, whereas 4,089 were correctly labeled as negative. The largest percentages were in the neutral emotion category, where 1,525 negative and 1,693 positive thoughts were misclassified as neutral and 1,274 negative and 293 neutral sentiments were misclassified as positive.
Naïve Bayes Analysis Results: The confusion matrix for the naïve bayes model with the three distinct polarities is illustrated in Figure 14. The model detected 15,944 positive sentiments accurately. Positive sentiments were successfully predicted, however 1,220 and 693 attitudes were misclassified as neutral and negative, respectively. The confusion matrix correctly identified 8,416 sentiments as neutral, representing the true positive rate, whereas 3,557 were correctly labeled as negative. Furthermore, 1,120 negative and 1,220 positive sentiments were incorrectly categorized as neutral, where the highest percentages of misclassification were in the positive sentiment category, with 2,211 negative and 2,928 neutral sentiments being misclassified as positive.

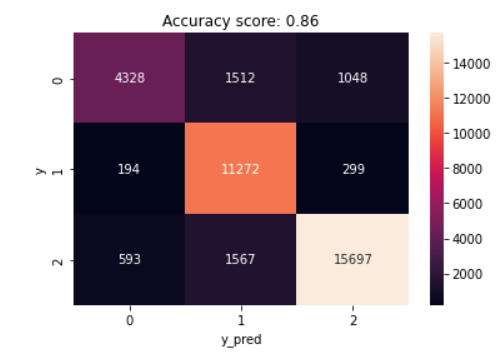
Ridge Classification Analysis Results: The confusion matrix for the ridge classification model with the three distinct polarities is shown in Figure 15. The model detected 15,697 positive sentiments accurately. Positive sentiments were successfully predicted, however 1,567 and 593 attitudes were misclassified as neutral and negative, respectively. In the confusion matrix, 11,272 feelings were correctly identified as neutral, representing the true positive rate, while 4,328 were correctly identified as negative. In addition, 1,048 negative and 299 neutral sentiments were misclassified as positive, meaning that the sentiment analysis algorithm incorrectly assigned these tweets to the positive sentiment class, where the highest percentages of misclassification were in the neutral sentiment category, with 1,512 negative and 1,567 positive sentiments being misclassified as neutral.
Model Performance Comparison
Evaluating the performance of machine learning algorithms is an important step in determining the usefulness and accuracy of sentiment analysis models. In the current study, performance metrics were used to evaluate the algorithms on the same basis, meaning that they were evaluated using the same criteria or standards. Based on the comparison of performance metrics, multinomial logistic regression model achieving an accuracy of 86.67% outperformed other machine learning approaches (Table 1).
| Performance Metrics | Multinomial Logistic Regression | Random Forest | Naive Bayes | Ridge Classification |
|---|---|---|---|---|
| Training Accuracy Score | 0.873 | 0.9971 | 0.7725 | 0.8632 |
| Testing Accuracy Score | 0.8667 | 0.8503 | 0.7646 | 0.8572 |
| Precision Score | 0.8711 | 0.8572 | 0.7656 | 0.8631 |
| Recall Score | 0.8667 | 0.8503 | 0.7646 | 0.8572 |
| F1-Score Score | 0.864 | 0.846 | 0.7574 | 0.8541 |
Table 1: Comparison of algorithm performance.
All of the analyzes we have made as a result of the application take place between 01-11-2020 and 01-01- 2022. Our aim is to compare the moods we obtained in this date range with the mortality rate, vaccination rate and the number of people who have been tested. When the sentiment is analyzed, it is observed that the positive comments of tweets about vaccination in the general dataset are higher than other sentiments in every time period. We clearly see that the number of deaths decreases as the number of vaccinations increases. In parallel with the vaccine, the number of people getting tested has also increased. The result we obtained in the sentiment analysis against vaccination, which we have determined as our study objective, is that as vaccination increases, positive comments against vaccines differ more than other moods.
Conclusions
In the performed study, natural language processing (NLP) methods and machine learning methods were used to analyze tweets about the vaccine for 17 countries among the 20 countries with the highest gross national product in 2020. In this context, machine learning methods such as multinomial logistic regression, random forest, naïve bayes, and ridge classification methods were performed to evaluate the performance of the predictive models, with naïve bayes achieving accuracy of 76%, random forest achieving accuracy of 85.03%, ridge classification achieving 85.72% and multinomial logistic regression achieving 86.67%. The sentiment analysis conducted in this study revealed that as vaccination rates increase, positive remarks about vaccines differ more than other moods. This finding is valuable in understanding public perception and attitudes towards vaccinations. To further improve the analysis, future studies can consider expanding the sentiment analysis to include other social media platforms and languages. This would provide a more comprehensive understanding of global sentiments towards vaccines. Additionally, incorporating emotion analysis into the study can provide more precise insights into people’s emotional responses towards vaccines. Emotion analysis can provide a deeper understanding of the underlying feelings and reactions related to vaccinations.
Lastly, exploring the application of various hybrid machine learning algorithms can enhance prediction accuracy. By combining different techniques and models, researchers can potentially improve the performance of predictive models used in analyzing sentiments and attitudes towards vaccines. These proposed improvements can strengthen the findings of the study and contribute to our understanding of public sentiment and perceptions related to COVID-19 vaccinations.
This study can be a valuable resource for public authorities, companies, governments, and healthcare officials, including the WHO, to monitor and improve the effectiveness of COVID-19 vaccines, especially in countries with different mindsets towards vaccinations [38]. The regular evaluation of vaccines’ efficacy through clinical trials, post-marketing surveillance, and disease outbreak analysis is crucial for ensuring public health and safety. Contributing in any way possible to the frontline workers’ efforts to combat coronavirus is important, and this study’s findings could help in that regard. We all have a role to play in the fight against COVID-19, and sharing accurate and relevant information can be one of the most effective ways to support the healthcare community.
Conflict of Interest
The authors declare no competing interests.
References
-
Çakıt E (2022) A Systematic Review of Fuzzy Logic Applications for the COVID-19 Pandemic. Big Data Analytics and Artificial Intelligence in the Healthcare Industry, pp: 101-128.
-
Liu R, Han H, Liu F, Lv Z, Wu K, et al. (2020) Positive rate of RT-PCR detection of SARS-CoV-2 infection in 4880 cases from one hospital in Wuhan, China, from Jan to Feb 2020. Clinica chimica acta 505: 172-175.
-
Velavan TP, Meyer CG (2020) The COVID‐19 epidemic. Tropical medicine & international health 25(3): 278-280.
-
Andrews R (2009) Twitter® Brings Back UK SMS; Vodafone First, Others to Follow. The Guardian.
-
Çakıt E, Karwowski W, Servi L (2020) Application of soft computing techniques for estimating emotional states expressed in Twitter® time series data. Neural Computing and Applications 32(8): 3535-3548.
-
Arru M, Negre E (2017) People behaviors in crisis situations: Three modeling propositions. In 14th International Conference on Information Systems for Crisis Response and Management (ISCRAM 2017) pp: 139-149.
-
Fauci AS, Lane HC, Redfield RR (2020) Covid-19- navigating the uncharted. New England Journal of Medicine 382(13): 1268-1269.
-
Ridhwan KM, Hargreaves CA (2021) Leveraging Twitter® data to understand public sentiment for the COVID‐19 outbreak in Singapore. International Journal of Information Management Data Insights 1(2): 100021.
-
Villavicencio C, Macrohon JJ, Inbaraj XA, Jeng J, Hsieh J (2021) Twitter sentiment analysis towards covid-19 vaccines in the Philippines using naïve bayes. Information 12(5): 204.
-
Bhagat KK, Mishra S, Dixit A, Chang CY (2021) Public opinions about online learning during COVID-19: a sentiment analysis approach. Sustainability 13(6): 3346.
-
Melton CA, Olusanya OA, Ammar N, Shaban-Nejad A (2021) Public sentiment analysis and topic modeling regarding COVID-19 vaccines on the Reddit social media platform: A call to action for strengthening vaccine confidence. Journal of Infection and Public Health 14(10): 1505-1512.
-
Praveen SV, Ittamalla R, Deepak G (2021) Analyzing the attitude of Indian citizens towards COVID-19 vaccine–A text analytics study. Diabetes & Metabolic Syndrome 15(2): 595-599.
-
Sattar NS, Arifuzzaman S (2021) COVID-19 vaccination awareness and aftermath: Public sentiment analysis on Twitter data and vaccinated population prediction in the USA. Applied Sciences 11(13): 6128.
-
Kwok SWH, Vadde SK, Wang G (2021) Tweet topics and sentiments relating to COVID-19 vaccination among Australian Twitter users: machine learning analysis. Journal of medical Internet research 23(5): e26953.
-
Kash (2022) Covid Vaccine Tweets, Kaggle.
-
Ji X, Chun SA, Geller J (2016) Knowledge-based tweet classification for disease sentiment monitoring. Sentiment analysis and ontology engineering 639: 425- 454.
-
Dang NC, Moreno-García MN, De la Prieta F (2020) Sentiment analysis based on deep learning: A comparative study. Electronics 9(3): 483.
-
Shirzadi A, Soliamani K, Habibnejhad M, Kavian A, Chapi K, et al. (2018) Novel GIS based machine learning algorithms for shallow landslide susceptibility mapping. Sensors 18(11): 3777.
-
Lou R, Lv Z, Dang S, Su T, Li X (2021) Application of machine learning in ocean data. Multimedia Systems pp: 1815-1824.
-
Mohri M, Rostamizadeh A, Talwalkar A (2018) Foundations of machine learning. MIT press, pp: 1-427.
-
Shalev-Shwartz S, Ben-David S (2014) Understanding machine learning: From theory to algorithms. Cambridge university press, pp: 1-449.
-
Flach P (2012) Machine learning: the art and science of algorithms that make sense of data. Cambridge university press, USA.
-
Swamynathan M (2019) Mastering machine learning with python in six steps: A practical implementation guide to predictive data analytics using python. Apress Berkeley, USA.
-
McCallum A, Nigam K (1998) A comparison of event models for naive bayes text classification. AAAI-98 workshop on learning for text categorization 752(1): 41- 48.
-
Zhang D (2019) Bayesian Classification. In Fundamentals of Image Data Mining, pp: 161-178.
-
Ramadhan WP, Novianty SA, Setianingsih SC (2017) Sentiment analysis using multinomial logistic regression. 2017 International Conference on Control, Electronics, Renewable Energy and Communications (ICCREC), pp: 46-49.
-
Hosmer Jr DW, Lemeshow S, Sturdivant RX (2013) Applied logistic regression. John Wiley & Sons Inc 398:1-510.
-
He J, Ding L, Jiang L, Ma L (2014) Kernel ridge regression classification. 2014 International Joint Conference on Neural Networks (IJCNN) pp: 2263-2267.
-
Jain D, Yadav V, Kumari M, Chandravansi K, Reddy GK, et al. (2022) Cardiovascular Disease Predictor. Proceedings of The International Conference on Emerging Trends in Artificial Intelligence and Smart Systems, THEETAS 2022, 16-17 April 2022, Jabalpur, India.
-
Breiman L (2001) Random forests. Machine learning 45(1): 5-32.
-
Genuer R, Poggi JM, Tuleau-Malot C (2010) Variable selection using random forests. Pattern recognition letters 31(14): 2225-2236.
-
Cun W, Mo R, Chu J, Yu S, Zhang H, et al. (2021) Sitting posture detection and recognition of aircraft passengers using machine learning. AI EDAM 35(3): 1-11.
-
Aksu ŞH, Çakıt E (2023) A machine learning approach to classify mental workload based on eye tracking data. Journal of the Faculty of Engineering and Architecture of Gazi University 38(2): 1027-1039.
-
Çakıt E, Dağdeviren M (2023) Comparative analysis of machine learning algorithms for predicting standard time in a manufacturing environment. AI EDAM 37: e2.
-
Çakıt E, Dağdeviren M (2022) Predicting the percentage of student placement: A comparative study of machine learning algorithms. Education and Information Technologies 27(1): 997-1022.
-
Awoyemi JO, Adetunmbi AO, Oluwadare SA (2017) Credit card fraud detection using machine learning techniques: a comparative analysis. Proceedings of the IEEE international conference on computing, networking and informatics, ICCNI 2017 2017: 1-9.
-
Hordri NF, Yuhaniz SS, Azmi NFM, Shamsuddin SM (2018) Handling class imbalance in credit card fraud using resampling methods. International Journal of Advanced Computer Science and Applications 9(11): 390-396.
-
WHO (2021) UN set out steps to meet world covid vaccination targets.
- hMPV: Is It Another Covid-19 Like Situation?
- Streptomyces: Sources of Novel Discoveries in Antibiotic Research to Combat Antimicrobial Resistance
- A Review of Mosquitoes (Diptera: Culicidae) and Their Biodiversity, Medical and Veterinary Importance
- Past and Current Immunotherapy in Cancer
- Hematological Cancer and Viral Infection
- The Growing Threat of Antimicrobial Resistance in India: Challenges and Solutions