Designing of Dual Pulse Photoacoustic Tomography for Imaging of Drug-Response and Tumor Growth
Detection of the real-time growth rate of cancer and visualization of the effectiveness of chemotherapy using the live cell imaging technique are yet to be invented though these could be conducive to monitoring the cancer treatment more precisely. In the present article, a new technique is proposed that will be able to accomplish the aforementioned necessity. The recent development and success of the use of organometallic carbonyl clusters as photoacoustic contrast agents and cancer drugs have fetched a few freedoms for the fate of new technologies towards the invention of Dual pulse photoacoustic tomography (DP-PAT) that could ease the detection and treatment of cancer using advanced clinical chemotherapy. This approach could be extended for monitoring and efficacy test of any kind of drugs provided that their optical absorption before and after drug action fall within the biomedical limit of radiation. It is also obvious that a similar analysis technique may be implemented for other imaging techniques like CT scan, PET scan, MRI, etc.
Abbreviations
MRI: Magnetic Resonance Imaging; PET: Positron Emission Tomography; FL: Fluorescence; NIR: Near-Infrared; US: Ultrasound; PA: Photoacoustic; SPECT: Single-Photon Emission Computed Tomography; PAT: Photoacoustic Tomography. Introduction Noninvasive way of diagnosis of diseases is the prime target of clinical research. Live cell imaging [1, 2, 3, 4, 5, 6] techniques have a major role in this regard. A number of imaging techniques that are employed for clinical purposes [7, 8, 9, 10, 11, 12, 13, 14] may be classified into two categories according to their basic characteristics. There are traditional imaging techniques like X-ray Computed Tomography (commonly known as CT scan) [7, 8] and Magnetic Resonance Imaging (MRI) [9, 10] that are based on high-frequency electromagnetic and magnetic radiations respectively. Two recent addition to this type of imaging technique namely Single-photon Emission Computed Tomography (SPECT) [11, 12] and Positron Emission Tomography (PET) [13, 14] attract escalating interest and become popular among patients. However, all these imaging techniques suffer from ionization damage to the patient due to extreme radiation that hinders further development and clinical and biomedical applications. Contrary to this, the other class of live cell imaging probes uses an optical laser pulse as the incident radiation and generates optical or acoustic outputs that exhibit less or no harm to the living organism.
Optical imaging techniques include fluorescence (FL) imaging [15, 16, 17] and photoacoustic tomography (PAT) [18-
20]. An informative and in-depth critical comparison between radiation-based imaging and optical imaging techniques is presented by Zhang X, et al. [21] very recently. The recent developments in different imaging techniques including PA are discussed here. They proclaimed that optical imaging techniques have better prospects than others. Of course, optical imaging techniques, FL and PAT, are not fully obstacle free. Fluorescence imaging uses visible light as incident radiation and produces fluorescence emission frequency in the visible region. This technique faces challenges for biomedical applications due to the scattering and absorption of incident radiation and reabsorption of the emitted radiation by the tissue. On the other hand, photoacoustic (PA) imaging uses visible light as incident radiation and produces ultrasound (US) as an emission. Thus, PA imaging requires an improvement of its incident radiation to avoid tissue absorption and scattering.
To reduce the background interference to the output signals, the use of exogenous contrast agents is remarkable. It also enhances the tunability of the incident and the produced signal characteristics. Since the biological tissues have high absorption within 400 nm to 700 nm, the visible region, any incident optical radiation within this region has a very low penetration depth. Thus, an improvement in contrast agent that absorbs in the near-infrared (NIR) region (700 nm to 1000 nm), will allow us to use NIR radiation as incident radiation. At present, researchers are trying to design contrast agents that could be able to absorb in the second infrared region (NIR-II) to achieve higher penetration depth and better contrast and absorption-less signal for high-contrast and better resolute images [22, 23].
Unfortunately, none of these methods of imaging mentioned earlier nor even any other techniques are available to detect the real-time growth rate of a chronic disease like cancer or Alzheimer’s disease. Detection of the real-time growth rate of such diseases is extremely important for appropriate treatment. At the same time, there is no genre to check the real-time progress of treatment or the effectiveness of a particular drug. The advancement of success or failure of therapeutic treatment of cancer will enhance the success rate. The growth rate of cancer may be estimated by employing different live cell imaging techniques at significant time intervals. However, the live monitoring of chemotherapy could not be possible by employing any available technique. The invention of a new technique that could be effective for live monitoring of cancer treatment will certainly be helpful for cancer treatment. Is it possible? Yes, it is possible. How could it be possible?
To make the impossible possible, let us dream of an instrument that is capturing every successful action of a drug molecule. Thus, from the ratio of effective drug molecules and the total drug molecules, the effectiveness or success rate of the drug could be measured. To fulfil our dream, we may implement present imaging techniques in a different way. Of course, it will be applicable only to those drugs which must act as exogenic contrast agents before or after binding to the respective enzyme or ligand or at both stages (before and after binding) but at significantly different spectroscopic regions, to have effective optical absorbance in one or two different regions such that effective contrast behavior is observed that is required for live cell imaging. The possibilities of the formulation of such imaging techniques are discussed in the present perspective. So far, it is understandable that in designing a successful technique to measure the real-time growth rate of cancer and live monitoring of its treatment through chemotherapy, a specific contrast agent is required that has contrast behaviour as well as drug behaviour. The quest for such contrast drug molecules having the aforementioned virtues is also reported in the present perspective.
Photoacoustic Tomography and Contrast Agents
Photoacoustic tomography (PAT) [19, 20] is based on the photoacoustic effect discovered by Bell AG [19]. In this technique, an optical laser pulse is triggered to the target where the irradiated light is absorbed by some absorbent and becomes hot. The generated heat is dispersed in the surroundings to cool it again. In this process of simultaneous heating and cooling, the expansion and contraction of the volume of the absorbent occur which creates an ultrasound wave in the medium. This ultrasound wave is captured by a high-end director and processed for image construction. Since this imaging technique is a combination of two different forms of energy (light energy and sound energy), the scope of the variety of information collected from the target is also wide. Primarily, the generated US wave depends on the incident laser frequency and the generated heat. However, the heat generation and the propagation of the US wave depend on several parameters [24]. Both the generation of heat and propagation of sound wave depends on thermal conductivity and the thermal expansively of the medium and specific heat ratio, number density, and heat capacity at the constant volume of the absorbent. The generated heat, H(x, t), is as follows.
$$H(x, t) = \mu_a(x) \varphi(x, t, \mu_a)$$ (1)
Where $\mu_a$ is absorption coefficient and $\varphi$ is fluence. Both $\varphi$ and $\mu_a$ depends on the position vector $(x)$. Thus, the spatial distribution of absorbing entities could be described from the PA output. Unfortunately, the absorption coefficient $(\mu_a)$ inversely proportional to the absorption wavelength ($\lambda$) as $$\mu_a = \frac{4\pi k}{\lambda}$$
Thus, the signal strength gets reduced by increasing the absorption wavelength ($\lambda$) to avoid tissue absorption. To restore the signal strength, designing of contrast agent with high molar extinction coefficient ($k$) is required. This could also be achieved by increasing the incident pulse's energy density (reducing the pulse duration). However, the biomedical limit of pulse energy density is very narrow. Embedding exogenous contrast agents to the live cell is also subject to various life-threatening issues like cytotoxicity, metabolism, etc. Keeping all these constraints in mind, photoacoustic contrast agents should be modelled.
**Contrast Agents for Dual Pulse Photoacoustic Tomography (DP-PAT)**
At present, different classes of contrast agents like gold nanoparticles [25, 26], organic dyes [27, 28, 29] organometallic carbonyl clusters [24, 30, 31, 32] nano dyes [33] etc. have been tested for PAT so far. There are advantages as well as disadvantages one over another. However, the organometallic carbonyl cluster compounds of group-8 elements have attracted major attention due to their excellent solubility in water as well as hydrophobic media and high stability in blood circulation. These compounds have negligible cytotoxicity [34, 35, 36]. Interestingly, in a number of recent studies it is reported that these compounds have remarkable anti-angiogenic activity too [37]. Thus, these compounds are the present focus of interest since these compounds have both photoacoustic contrast activities and drug activities and may be implemented for new kinds of imaging techniques. If they exhibit optical absorbance properties at two different regions in the UV-Vis spectra before and after their addition to the respective enzyme or ligand to produce a detectable PAT signal. These could be our dream compound for design a dual pulse photoacoustic tomography (DP-PAT).
Recent advances in the field of ruthenium-based anti-cancer drugs including ruthenium carbonyl clusters give rise to the thinking of new medicinal technologies which may be effective for the visualization of chemotherapeutic progress in a living body. The advantages and benefits of exploiting ruthenium as anti-cancer drugs have been discussed in a number of excellent reviews [38, 39, 40]. Indeed, ruthenium complexes are less cytotoxic than the worldwide approved platinum-based drugs due to the ability of ruthenium to mimic iron in binding to biological molecules, such as human serum albumin and transferrin [41]. Two ruthenium compounds, imidazolium trans-[tetrachlorobis (1H-indazole) ruthenate(III)]]), termed KP1019, [42] and imidazolium trans-[tetrachloro(dimethyl sulfoxide) (1H-imidazole) ruthenate(III)]]), termed NAMI-A, [43] are presently in phase II clinical trials, the latter com-pound showing both anti-metastatic and anti-angiogenic activity in preclinical models [37]. Organometallic ruthenium(II) complexes, [Ru($\eta^6$-arene)Cl$_2$ (PTA)] (arene = toluene and p-cymene, PTA = 1,3,5-triaza-7-phosphaadamantane), also exhibit anti-metastatic [44] and anti-angiogenic [45] properties.
Nazarov AA, et al. [37] showed that triruthenium-carbonyl clusters derivatized with glucose-modified bicyclophosphite ligands [Ru$_3$ (CO)$_x$ P$_y$] where P is one glucose-modified bicyclophosphite ligand] have very good anti-cancer activities with excellent cell uptake proper-ties. They have shown that this compound shows angiogenic activities in vivo conditions by arresting the cell cycle in the G1/G0 phase which leads to cell apoptosis. Later, Kong KV, et al. [31] reported that triruthenium-carbonyl clusters derivatized with sodium thio-propanoate are quite good photoacoustic contrast agents. Bag and Ghorai [24] carried out a molecular-level investigation to reveal the high contrast activity of osmium over iron and ruthenium. Bag [30, 32] further extended this research with higher metal clusters to achieve optical absorbance at a larger wavelength than 900 nm. It is observed that both the organometallic hexa-nuclear metal clusters of iron and ruthenium have good absorbance near 1000 nm.
From these inspiring results, it could be concluded that if tri-ruthenium-carbonyl clusters are derivatized with a suitable organic ligand, they could act as the cancer drug and their drug activity could be estimated using photoacoustic imaging. The possibilities and prospects of designing such a kind of PA imaging instrumentation are described here. The change in optical absorption behaviour of tri-ruthenium-carbonyl cluster derivatized with glucose-modified bicyclophosphite ligands [Ru$3$ (CO)${11}$P] are computed and also reported in the present article.
**Methods and Design**
**Design of DP-PAT**
In photoacoustic tomography, a short pulse of electromagnetic radiation is used which is absorbed by some entities that exist in the living cell. Due to the absorption of the radiation heat is generated which creates acoustic waves. These waves travel to the tissue surface where a respective detector is situated. From the time delay to reach the detector, the spatial distribution of the absorbing entity could be imaged. The application of exogenous contrast agents enhances the absorption capacity and increases the photoacoustic signal. In the cancer-affected organs, the density of blood vessels is higher and hence the blood circulation. Thus, the use of exogenous contrast agents is very effective to differentiate normal cells from cancer cells. If the contrast agent itself is a cancer drug, then its implementation as a contrast agent not only enhances the signal resolution but also gives information about the status of the disease. The interaction of contrast agents with the cell may lead to cell apoptosis. Here two different situations may arise.
After the drug action, the drug molecule (in this case the contrast agents) may lose its identity. The contrasting behaviour of the compounds may be lost. In that situation, fast decay of the signal strength will be observed. However, there are other factors that may cause the decrease in signal strength. Thus, from the decay pattern, no conclusion may be drawn with great precision. On the other hand, if the contrast agent changes its optical absorbance property after its action as a cancer drug, a different photoacoustic signal may be produced by illuminating the target with another laser pulse. Comparing these signals with the previous signals, the drug activity of the contrast agents may be determined. The ratio of two signals will give the fraction of drug molecules (here the contrast agent) reacted. From the time difference between two laser pulses, the rate of the reaction of drug molecules could be determined. If a short series of laser pulses are implemented systematically, the progress rate of the drug action will be mapped quantitatively. A schematic diagram is presented below to illustrate this proposal (Figure 1).
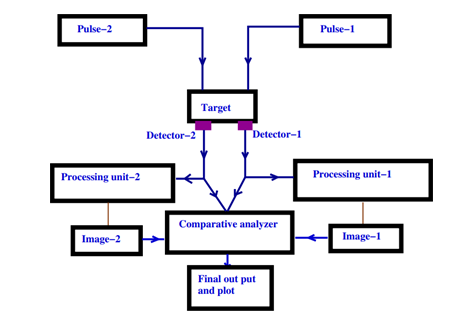
Figure 1: A schematic diagram of proposed DP-PAT. Description of Instrumentation and Method of Measurement of Drug Activity In Figure 2, the target is under the focus of two different laser pulses. Laser pulse-1 corresponds to the frequency of the used contrast agent before its drug action and laser pulse-2 corresponds to the frequency of the contrast agent after its drug action. There are two in- dependent detectors.
Here it should be mentioned that when pulse-1 is on, detector-1 will be on and detector-2 will be off. For pulse-2, the reverse will be true. These conditions are required to avoid the mixing of two different signals as both the detectors are capturing signals from the same tissue surface. There should be a significant time gap between the application of two laser pulses. Signals that are recorded at two different detectors are passed to two independent processors to get independent images produced from two different laser pulses. Both these signals will also be sent to an analyser where a comparative study will be processed. The analyser will also collect two images and compare them to give the calculated result.
From the signal ratio, the fraction of drug molecules that have reacted could be calculated in the following way.
Let, x be the fraction of drug molecules that have reacted. So, the amount of unreacted drug molecules is 1−x. As the strength of the signal is proportional to the concentration of the contrast agents, we get $$ \frac {s i n a l - 2}{s i n a l - 1} = \frac {x}{1 - x} $$ (3) $$ \frac {s i n g l a l - 2}{s i n g l a l - 1} \mathrm {i} $$ is a number that is available from the designed DP-PAT instrumentation described above.
Let the measured value is K. Now, from equation 3 we get $$ \left| \frac {x}{1 - x} = k \right| $$ (4) So, $$ \left| x = \frac {k}{1 + k} \right| $$ (5) x is the drug activity index. Employing pulse-2 more than once, we will get different values of x. The plot of x vs. time will show the progress of the drug activity.
Computational Details
To test the efficiency of triruthenium-carbonyl cluster derivatized with glucose-modified bicy- clophosphite ligands as an effective TD-PAT contrast agent (PAT contrast agent and cancer drug), the optical absorbance property of this compound and its derivatives with DNA base is studied. For this purpose, geometry optimization of these compounds is carried out with the help of the Gaussian 09 package [46].
The structure optimizations were carried out without any symmetry restrictions following standard methodology. Becke’s three-parameter hybrid exchange functional combined with Lee-Yang- Parr non-local correlation functional, abbreviated as B3LYP, with LanL2DZ basis, is employed for the present computation. It is reported that for the transition metal clusters B3LYP/LanL2DZ produces excellent results compared to the experimental results [24, 30, 31, 32]. Time-dependent density functional theory (TD-DFT) calculations were performed to study the optical absorbance of the compounds under test for their electronic excitations.
Results and Discussion
The optical absorbance of different triruthenium carbonyl cluster derivatives due to their electronic excitation is computed and presented in Figure 2. Mono substituted derivative is chosen for this study. It is reported that this compound acts as a cancer drug by stopping cell division through a mechanism where the compound binds to two DNA bases of the opposite strands of DNA when it starts to unfold at the G1/G0 stage of the cell division [37]. Thus, the optical absorbance of the mono substituted metal cluster and its derivatives with DNA base Guanine is computed and reported.
In Figure 2, it is observed that the absorption maximum of the monosubstituted derivative and its mono-substituted guanine derivative are 505 nm and 556 nm respectively. The di-substituted guanine derivative shows two distinct absorption peaks. The first peak, the low energy peak, is at 1085 nm and the second one is at 484 nm. Thus, this compound, triruthenium carbonyl cluster derivatized with glucose-modified bicyclophosphite ligands, is a promising candidate for the DP-PAT contrast agent. For this compound, the frequency of the laser pulse-1 must be around 500 nm and that of pulse-2 should be around 1100 nm. Since the required frequency of two pulses is widely separated, this could be easily used as a contrast agent for DP-PAT. The signal corresponding to an 1100 nm laser pulse is directly related to the activity of the ruthenium complex as well as the rate of cell division which is related to the spread of cancer cells. It is also observed that there is another significant absorption of the di-substituted guanine derivative at 480 nm. So, the calculation of x should be modified accordingly. From the image obtained from laser pulse-2, the arrested cell division area would be visible.
![Figure 2: Mono substituted derivative is chosen for this study. It is reported that this compound acts as a cancer drug by stopping cell division through a mechanism where the compound binds to two DNA bases of the opposite strands of DNA when it starts to unfold at the G1/G0 stage of the cell division [37]. Thus, the optical absorbance of the mono substituted metal cluster and its derivatives with DNA base Guanine is computed and reported.](/fulltextimages/13444/fig_2.png)
Expected Image Employing DP-PAT
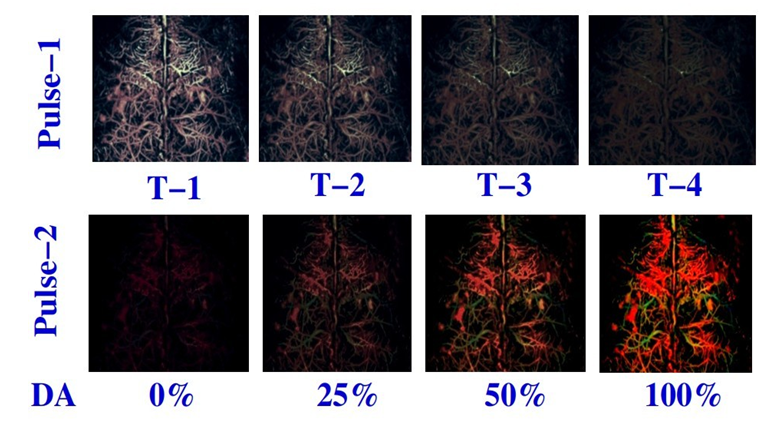
To better understand how DP-PAT measures growth rate and drug efficiency, Figure 3 illustrates a possible DP- PAT image at different time intervals for an ideal case (it is painted, not simulated). An image for pulse-1 at time T-1 corresponds to the drug load while images at T-2, T-3 and T-4 show the concentration of unreacted drug residue Figure
4. The consumption rate of the drug can be estimated from the ratio of image intensity to the time interval, which can be computed using Artificial Intelligence. In the same way, pulse-2 images could estimate the utilization rate of drug activity. If both the rates are the same, it may be concluded that 100% of the drug is utilized for treatment purposes. Change of utilization rate with time is equivalent to the growth rate of the tumor or the spreading rate of cancer.
Graphical TOC Entry

Conclusion
From the present study, it could be concluded that it is possible to construct a DP-PAT instrument. The required contrast agent for this technique is obtainable for cancer. The triruthenium-carbonyl cluster derivatized with glucose- modified bicyclophosphite ligand (mono-substituted) is an effective contrast agent to detect the progress of cancer in a living organism.
It may also be a good drug for this disease. It is observed that when the cluster binds with a DNA base of a single strand, there is no significant change in its optical absorption property. But, this property changes drastically only when it binds to two DNA bases of two different strands of an unfolding DNA which stop the cell division and the spread of cancer. Thus, the success of the chemotherapy could be noticed spectroscopically if this compound is used for the treatment. Monitoring of the therapy could also be possible in this case. This technique (DP-PAT) will give more flexibility in the future to resolve clinical and medical complexities. This approach could also be implemented for other imaging techniques like CT scans, PET scans, MRIs, etc. However, in those cases, the active drugs should have to produce the required respective signals.
Acknowledgement
All authors acknowledge the computational facilities of the Department of Applied Chemistry, MAKAUT WB and West Bengal India.
References
-
Wang LV (2008) Prospects of Photoacoustic Tomography. Med Phys 35(12): 5758-5767.
-
Thakor NV (2012) Highlights: Transcranial Imaging of Functional Cerebral Hemodynamic Changes in Single Blood Vessels. J Cereb Blood Flow Metab 32(6): 936-937.
-
Wang X, Pang Y, Ku G, Xie X, Stoica G, et al. (2003) Noninvasive Laser-Induced Photoacoustic Tomography for Structural and Functional in Vivo Imaging of the Brain. Nat Biotechnol 21(7): 803-806.
-
Wang X, Pang Y, Ku G, Stoica G, Wang LV (2003) Three- Dimensional Laser-Induced Photoacoustic Tomography of Mouse Brain with the Skin and Skull Intact. Opt Lett 28(19): 1739-1741.
-
Stephens DJ, Allan VJ (2003) Light Microscopy Techniques for Live Cell Imaging. Science 300(5616): 82-86.
-
Jaiswal JK, Goldman ER, Mattoussi H, Simon SM (2004) Use of Quantum Dots for Live Cell Imaging. Nature Methods 1: 73-78.
-
Withers PJ, Bouman C, Carmignato S, Cnudde V, Grimaldi D, et al. (2021) X-ray Computed Tomography. Nature Reviews Methods Primers 1(18).
-
Kalender WA (2006) X-Ray Computed Tomography. Phys Med Biol 51(13): R29-R43.
-
Westbrook C (2021) Handbook of MRI Technique. John Wiley & Sons.
-
Westbrook C, Talbot J (2018) MRI in Practice. John Wiley & Sons.
-
Muehllehner G, Karp JS (2006) Positron Emission Tomography. Physics in Medicine & Biology 51: R117.
-
Bailey DL, Maisey MN, Townsend DW, Valk PE (2005) Positron Emission Tomography. Springer.
-
Holly TA, Abbott BG, Mallah M, Calnon DA, Cohen MC (2010) Single Photon-Emission Computed Tomography.
-
Jaszczak RJ, Coleman RE, Lim CB (1980) SPECT: Single Photon Emission Computed Tomography. IEEE Transactions on Nuclear Science 27(3): 1137-1153.
-
Rao J, Andrasi A, Yao H (2007) Fluorescence Imaging in Vivo: Recent Advances. Current Opinion in Biotechnology 18(1): 17-25.
-
Schaferling M (2012) The Art of Fluorescence Imaging with Chemical Sensors. Angew Chem Int Ed Engl 51(15): 3532-3554.
-
Flusberg BA, Cocker ED, Piyawattanametha W, Jung JC, Cheung EL, et al. (2005) Fiber-Optic Fluorescence Imaging. Nat Methods 2(12): 941-950.
-
Lu W, Huang Q, Ku G, Wen X, Zhou M, et al. (2010) Photoacoustic Imaging of Living Mouse Brain Vascu- Lature using Hollow Gold Nanospheres. Biomaterials 31(9): 2617-2626.
-
Bell AG (1880) ART. XXXIV. On the Production and Reproduction of Sound by Light. Am J Sci 20: 305-324.
-
Tam AC (1986) Applications of Photoacoustic Sensing Techniques. Rev Mod Phys 58: 381.
-
Zhang X, Wu Y, Chen L, Song J, Yang H (2023) Optical and Photoacoustic Imaging In Vivo: Opportunities and Challenges. Chemical & Biomedical Imaging 1(2): 99- 109.
-
Han Y, Yi H, Wang Y, Li Z, Chu X, et al. (2022) Ultrathin Zinc Se-lenide Nanoplatelets Boosting Photoacoustic Imaging of In Situ Copper Exchange in Alzheimer’s Disease Mice. ACS Nano 16(11): 19053-19066.
-
Feng H, Fu Q, Du W, Zhu R, Ge X, et al. (2021) Quantitative Assessment of Copper (II) in Wilson’s Disease Based on Photoa- Coustic Imaging and Ratiometric Surface- Enhanced Raman Scattering. ACS Nano 15(2): 3402- 3414.
-
Bag A, Ghorai PK (2015) Computational Investigation of the Ligand Field Effect to Improve the Photoacoustic Properties of Organometallic Carbonyl Clusters. RSC Advances 5: 31575-31583.
-
Kim T, Zhang Q, Li J, Zhang L, Jokerst JV (2018) A Gold/Silver Hybrid Nanoparticle for Treatment and Photoacoustic Imaging of Bacterial Infection. ACS Nano 12(6): 5615-5625.
-
Chen YS, Frey W, Kim S, Kruizinga P, Homan K, et al. (2011) Silica-Coated Gold Nanorods as Photoacoustic Signal Nanoamplifiers. Nano Lett 11(2): 348-354.
-
Firouzi K, Stride E, Saffari NA (2013) Theoretical Investigation of Photoacoustic Contrast Agents. The J Acoust Soc Am 133(6): 3853-3862.
-
Hellebust A, Kortum R (2012) Advances in Molecular Imaging: Targeted Optical Contrast Agents for Cancer Diagnostics. Nanomedicine 7(3): 429-445.
-
Zha Z, Deng Z, Li Y, Li C, Wang J, et al. (2013) Biocompatible Polypyrrole Nanoparticles as a Novel Organic Photoacoustic Contrast Agent for Deep Tissue Imaging. Nanoscale 5(10): 4462-4467.
-
Bag A, Ghorai PK (2017) Enhancement of Biocompatibility and Photoacoustic Contrast Activity of Metal Clusters. J Mol Graph Model 75: 220-232.
-
Kong KV, Liao L, Lam Z, Thakor NV, Leong WK, et al. (2014) Organometallic Carbonyl Clusters: A New Class of Contrast Agents for Photoacoustic Cerebral Vascular Imaging. Chem Commun 50(20): 2601-2603.
-
Bag A (2015) Application of Glucose Modified Bicyclophosphite Derivative of Tri-Ruthenium Carbonyl Cluster as Advanced Photo Acoustic Contrast Agent. Saudi J Med Pharm Sci 1(3): 80-82.
-
Pillai MM, Karpagam K, Begam R, Selvakumar R, Bhattacharyya A (2018) Green Synthesis of Lignin Based Fluorescent Nanocolorants for Live Cell Imaging. Materials Letters 212: 78-81.
-
Kong JW, Lam Z, Chan KH, Ganguly R, Lee JY, et al. (2021) Group VIII Metal Carbonyl Cluster-Boronic Acid Conjugates: Cytotoxicity and Mode of Action Studies. ACS Omega 6(43): 29045-29053.
-
Kong KV, Leong WK, Ng SP, Nguyen TH, Lim LH (2008) Osmium Carbonyl Clusters: A New Class of Apoptosis Inducing Agents. ChemMedChem 3(8): 1269-1275.
-
Kong KV, Chew W, Lim LHK, Fan WY, Leong WK (2007) Bioimaging in the Mid-Infrared using an Organometallic Carbonyl Tag. Bioconjug Chem 18(5): 1370-1374.
-
Nazarov AA, Baquie M, Sliwinska P, Zava O, Beijnum JRV, et al. (2013) Synthesis and Characterization of a New Class of Anti-Angiogenic Agents Based on Ruthe- Nium Clusters. Sci Rep 3: 1485.
-
Jakupec MA, Galanski M, Arion VB, Hartinger CG, Keppler BK (2008) Antitumour Metal Compounds: More than Theme and Variations. Dalton Trans (2): 183-194.
-
Clarke MJ (2002) Ruthenium Metallopharmaceuticals. Coordination Chemistry Reviews 232(1-2): 69-93.
-
Allardyce CS, Dyson PJ (2001) Ruthenium in Medicine: Current Clinical uses and Future Prospects. Platinum Metals Reviews 45(2): 62-69.
-
Pongratz M, Schluga P, Jakupec MA, Arion VB, Hartinger CG, et al. (2004) Transferrin Binding and Transferrin- Mediated Cellular Uptake of the Ruthenium Coordination Compound KP1019, Studied by Means of AAS, ESI- MS and CD Spectroscopy. Journal of Analytical Atomic Spectrometry 19(1): 46-51.
-
Hartinger CG, Jakupec MA, Seifried S, Groessl M, Egger A, et al. (2008) KP1019, A New Redox-Active an- Ticancer Agent– Preclinical Development and Results of a Clinical Phase I Study in Tumor Patients. Chemistry & Biodiversity 5(10): 2140-2155.
-
Sava G, Gagliardi R, Bergamo A, Alessio E, Mestroni G (1999) Treatment of Metastases of Solid Mouse Tumours by NAMI-A: Comparison with Cisplatin, Cyclophosphamide and Dacarbazine. Anticancer Research 19(2A): 969-972.
-
Chatterjee S, Kundu S, Bhattacharyya A, Hartinger CG, Dyson PJ (2008) The Ruthenium (II)–Arene Compound RAPTA-C Induces Apoptosis in EAC Cells through Mitochondrial and p53–JNK Pathways. J Biol Inorg Chem 13(7): 1149-1155.
-
Sliwinska P, Beijnum JRV, Casini A, Nazarov AA, Wagnieres G, et al. (2011) Organometallic Ruthenium (II) Arene Compounds with Antiangiogenic Activity. J Med Chem 54(11): 3895-3902.
-
Frisch MJ, Trucks G, Schlegel HB, Scuseria GE, Rob MA, et al. (2009) Gaussian 09, Revision D.01. Open Sci.
- Origin, Evolution, and Functional Impact of Short Insertion- Deletion Variants in Human Genomes: A Review
- Harnessing Molecular Glues for Next-Generation Vaccine, Cancer and Cardiovascular Disease Drug Development: A Comprehensive Review
- Lateral Cervical Epidermal Inclusion Cyst in a Paediatric Patient: A Rare Case Report
- Malarial Plasmodium Falciparum with Hepatitis B and C Virus Infections among Blood Donors in Ife Central Local Government Area, Ile Ife, Osun State, Nigeria
- Withanolides and Withaferin A- What’s next in Ashwagandha Research
- Trend Scenarios of Mortality due to Diabetes Mellitus and its Correlation with the Economic Sector, in the State of Mexico, for the Years 2020, 2025 and 2030