Malarial Plasmodium Falciparum with Hepatitis B and C Virus Infections among Blood Donors in Ife Central Local Government Area, Ile Ife, Osun State, Nigeria
Malaria and Viral Hepatitis are serious global public health challenge that causes significant morbidity and mortality worldwide. This study investigated the prevalence of asymptomatic Plasmodium falciparum and Hepatitis B and C viruses among blood donors in Ife Central, Osun State, Nigeria. A total of 400 blood samples were collected from participants and analyzed for malaria parasites, Hepatitis B surface antigens (HBsAg), and anti-HCV antibodies. Five (5) ml of venous blood was obtained from each of the participants into EDTA bottles and labeled accordingly. Thick and thin blood films were made on slides, dried for five minutes at ambient temperature (370C) then stained with Giemsa’s stain. The stained slides were examined microscopically for the presence, species identification and densities of malaria parasites. Haematological characterization was also conducted on the blood samples of the donors. Sera were separated from the remaining aliquots of the blood and screened for hepatitis-B surface antigens (HBsAg) and Hepatitis C virus antibodies (anti-HCV). The overall prevalence of malaria parasite infection in this study was low with an average parasite density of 883 parasites per microliter of blood. The overall prevalence of Hepatitis infection was 9.5%, Hepatitis B virus (HBV) infection was 3.5%, and Hepatitis C virus (HCV) infection was 5.8%. A small percentage (0.3%) of donors was co-infected with both Hepatitis B and C viruses. By age, younger donors (18-26 years) had the highest prevalence of Malaria 2,136.18± 770.70 (μl of blood), Hepatitis B and C infections (18.2%) and By Sex, the highest prevalence (9.7%) of Hepatitis B and C infections was recorded among male while that of malaria 1,529.67± 703.41 (μl of blood) was recorded among female participants. In marital status, single participants had a higher prevalence (14.8%) of Hepatitis B and C infections compared to married persons, while that of malaria was 949.58± 146.01 (μl of blood) among the married donors. By Occupation, students had a higher prevalence (20.4%) of Hepatitis infections while malaria was 1,233.74±590.10 (μl of blood) among farmers. According to educational status, participants with only primary education had the highest prevalence (11.1%) of Hepatitis infections and participants with secondary education had malaria of 931.69±136.23 (μl of blood). There was variation in infection rates by blood groups, but not all were statistically significant.Conclusively, the blood donors in Ife Central Local Government Area, Ile Ife, South West of Nigeria harbour asymptomatic HBV, HCV and Malaria, although the prevalence of malaria, hepatitis B and C viral infections was low in this study, the results also showed that each haematological indices fall within the normal range.
Olaniran O¹*, Olusi TA², Dada EO³, Olaniran OO⁴ and Adegoke DA⁵
¹Department of Medical Microbiology and Parasitology, Obafemi Awolowo University, Nigeria ²Department of Biology, Federal University of Technology Akure, Nigeria ³Department of Microbiology, Federal University of Technology Akure, Nigeria ⁴Department of Nursing, Obafemi Awolowo University Teaching Hospital Complex, Nigeria ⁵Department of Haematology and Blood Transfusion, Obafemi Awolowo University Teaching Hospital Complex, Nigeria
Conclusively, the blood donors in Ife Central Local Government Area, Ile Ife, South West of Nigeria harbour asymptomatic HBV, HCV and Malaria, although the prevalence of malaria, hepatitis B and C viral infections was low in this study, the results also showed that each haematological indices fall within the normal range.
Keywords: Blood; Health; Viral Infections; Hepatitis B Virus (HBV); Hepatitis C Virus (HCV)
Abbreviations
HBV: Hepatitis B Virus; HCV: Hepatitis C Virus; SP: Sulfadoxine- Pyrimethamine; WHO: World Health Organization; IC: Immuno Chromatographic; SEM: Standard Error of Mean; PCV: Packed Cell Volume.
Introduction
Malaria continues to be a major public health challenge in Africa for several reasons. A key factor is the widespread resistance of Plasmodium falciparum to conventional antimalarial drugs, such as chloroquine, mefloquine, sulfadoxine-pyrimethamine (SP), and amodiaquine Oniyangi O, et al. [1].
It is estimated that malaria costs Africa more than $12 billion annually, despite being preventable and treatable for a fraction of this cost. Hundreds of millions of people are directly affected by this serious disease [2].
Nigeria experiences year-round malaria transmission, with over 194 million people susceptible to infection. Consequently, Nigeria reported the highest global malaria prevalence in 2007. Malaria consistently ranks among the top five causes of childhood death under the age of five. Estimates indicate that roughly 50% of the population experiences at least one malaria episode annually. This situation has resulted in severe poverty due to the high costs associated with treatment, control, and prevention. Additionally, malaria infection further exacerbates poor conditions in rural and urban areas, causing individuals to miss work and school due to illness Awosolu OB, et al. [3].
Hepatitis refers to inflammation of the liver, which can impair its function. Viral hepatitis remains a major global public health threat in Africa. The world health Organization (WHO) 2024 global hepatitis report clearly highlights the urgency of the viral hepatitis problem in Africa. Hepatitis B and C virus infections account for the high incidence of hepatocellular tumors in sub-Saharan Africa. Co-infection with malaria and HBV and HCV can occur in areas where both infections are endemic due to their geographical coincidence. Nigeria is a holoendemic area for HBV with a carrier rate of 15-37%, and an estimated 12% of the total population being chronic carriers of HBsAg. A recent study found an HBV prevalence of 67% among hepatocellular carcinoma patients in Northeastern Nigeria. Nigeria has a prevalence rate of 8.1% and 1.1% for HBV and HCV among adult aged 15-64 years respectively [4].
Materials and Methods
Ethical Consideration
Prior to the commencement of the study, the research protocol was submitted and approved by the Ethics and Research Committee of the Osun State Ministry of Health, Abere, Oshogbo. Osun State. Nigeria (OSHREC/ PRS/569T/437). Verbal informed consents were obtained from all donors and confidentiality was assured by using codes.
Study Area
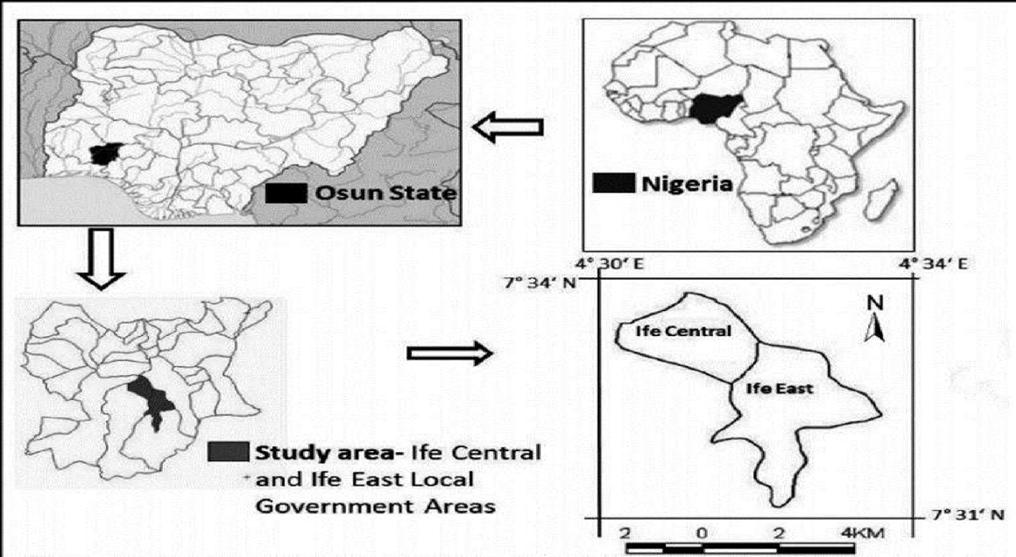
The study was conducted in Ife Central Local Government Area, Ile Ife, Osun State. Majority of the inhabitants are skilled workers, e.g. civil servants and artisans while others are unskilled workers are Akeem, et al. [5], e.g. peasant farmers, traders and transport workers (Figure 1).
Study Population
The study populations comprise of blood donors who came to donate blood at the government approved blood donor’s centers within the local government area. They were approached and the purpose of the study was discussed with them. Thereafter, the procedure to be taken was explained to them. They were also informed that participation is voluntary.
Study Design
The study was conducted between March 2021 and September 2021. prior to the collection of the blood samples structured questionnaire designed to collect basic demographic information including age, residential location, occupation and educational level and other information as regards the study were used to collect data from the donors.
Sample Size
A total of 400 blood samples were collected after ethical clearance and verbal consent were obtained from the donors. Examination of Blood for Malaria Parasite Five (5) ml of venous blood was obtained from each of the participants into EDTA bottles and labeled accordingly. Thick and thin blood films were made on slides, dried for five minutes at ambient temperature, and then stained with Giemsa’s stain. The stained slides were examined microscopically for the presence, species identification and densities of malaria parasites.
Analysis of Haematological Parameters
Haematological characterization was conducted on the blood samples of the donors using standard methods prescribed by Cheesbrough M [6].
Screening of Blood for Hepatitis B and C viruses
Sera were separated from the remaining aliquots of the blood and screened for hepatitis-B surface antigens (HBsAg) and Hepatitis C virus antibodies (anti-HCV) using rapid immunochromatographic (IC) tests which were in cassette form. The One Step HBsAg and ant-HCVTest Device (Serum/ Plasma) is a qualitative, lateral flow immunoassay for the detection of HBsAg and anti-HCV in serum or plasma. Determination of Blood Group of the Donors Determination of the blood groups of the donors was done using Anti sera A, B, AB and anti D that determine the Rhesus factor as follows: A glass slide was marked as follows Anti-A, Anti-B, Anti D and each division was pipette into as follows: Anti-A: 1 volume anti-A serum, 1 volume donor’s capillary blood, Anti-B: 1 volume anti-B serum, 1 volume donor’s capillary blood, Anti-AB: 1 volume anti-AB serum, 1 volume donor’s capillary blood, Anti-D: 1 volume anti-D serum, 1 volume donor’s capillary blood. The contents of each division were mixed using a clean piece of stick for each. The slide was tilted from side to side, looking for agglutination and the results recorded after 2 minutes.
Data Analysis
Analysis of the data was done using appropriate Statistical Package for the Social Sciences tool version 21.0. The prevalence was calculated as the number of serologically positive samples divided by the total number of samples tested. The Chi-square test was used to determine associations between positivity and socio demographic factors. The strength of the associations was assessed by odds ratios and 95% confidence intervals (CI) were calculated.
Results
A total of 400 blood donors; aged 18-62 years had participated in this study. Majority of the donors that participated 95.5% (382/ 400) were male, 61.3% (245/400) were married, 40.00% (160/400) were in the age range 21-30 years, 33.0% (132/400) were artisans, and 62.0% (248/400) were in secondary school (Table 1).
| Number Examined | Percentage (%) in the Pool | |
|---|---|---|
| Sex of the Subjects | ||
| Male | 382 | 95.5 |
| Female | 18 | 4.5 |
| Marital Status | ||
| Married | 245 | 61.3 |
| Single | 155 | 38.8 |
| Age Group (in years) | ||
| 18-26 | 11 | 2.8 |
| 27-35 | 160 | 40 |
| 36-44 | 156 | 39 |
| 45-53 | 63 | 15.8 |
| 54-62 | 10 | 2.5 |
| Occupation of the Subjects | ||
| Artisan | 132 | 33 |
| Trading | 73 | 18.3 |
| Civil Servant | 73 | 18.3 |
| Driver | 54 | 13.5 |
| Student | 49 | 12.3 |
| Farmer | 19 | 4.8 |
| Level of Education of the Subjects | ||
| Primary | 27 | 6.8 |
| Secondary | 248 | 62 |
| Tertiary | 125 | 31.3 |
| Total | 400 | 100 |
Table 1: Mean Malaria Parasite and Prevalence of Hepatitis B and C viruses among Blood Donors related to Age in Ife Central L.G.A
Table1: Socio-Demographic Characteristics of the Study Population of Donors Ife Central Local Government Area (L.G.A). Osun State.
| Age (years) | No Exam | Hepatitis No (%) Infected | HBV No (%) Infected | HCV No (%) Infected | Co-infection No (%) of HBV and HCV | Malaria Parasitaemia (μl of blood) mean±SEM | |
|---|---|---|---|---|---|---|---|
| 18-26 | 11 | 2 (18.2) | 2 (18.2) | 0 (0.0) | 0 (0.0) | 2,136.18±770.70 | |
| 27-35 | 160 | 22 (13.8) | 6 (3.8) | 15 (9.4) | 1(0.6) | 821.06±152.54 | |
| 36-44 | 156 | 8 (5.1) | 3 (1.9) | 5 (3.2) | 0 (0.0) | 823.46±166.99 | |
| 45-53 | 63 | 6 (9.5) | 3 (4.8) | 3 (4.8) | 0 (0.0) | 820.16±243.78 | |
| 54-62 | 10 | 0 (0.0) | 0 (0.0) | 0 (0.0) | 0 (0.0) | 1,858.40±1071.24 | |
| Total | 400 | 38 (9.5) | 14 (3.5) | 23 (5.8) | 1(0.3) | 883.95±103.06 |
Table 2: Mean Malaria Parasite and Prevalence of Hepatitis B and C viruses among Blood Donors related to Age in Ife Central L.G.A
HBV= Hepatitis B Virus, HCV= Hepatitis C Virus, SEM= Standard Error of Mean, No Exam= Number Examined. Table 2: Mean Malaria Parasite and Prevalence of Hepatitis B and C viruses among Blood Donors related to Age in Ife Central L.G.A. Osun State.
Table 2 shows the mean malaria parasite and prevalence of Hepatitis B and C viruses related to age in Ife Central L.G.A. The prevalence of Hepatitis virus infection was the highest (18.2%) in donors aged 18-26 years followed by (13.8%) in donors aged 27-35 years and the least (5.1%) in aged 36-44 years. HBV has the highest (18.2%) in donors aged 18-26 years followed by (4.8%) in aged 45-53 years and the least (1.9%) in 36-44years. The highest HCV (9.4%) was recorded in aged 27-35 years followed by 4.8% in aged 45-53 years and the least (3.2%) in 36-44 years. The co-infection was (0.6%) in donors aged 27-35years. The malaria infection was highest with mean parasitaemia 2,136.18± 770.70 (µl of blood) in donors aged 18-26 years followed by 1,858.40±107.24 (µl of blood) and the least 820.16±243.78 (µl of blood).
| No Examined | Hepatitis No (%) Infected | HBV No (%) Infected | HCV No (%) Infected | Co-infection (%) HBV and HCV | Malaria Parasitaemia (μl of blood) mean±SEM | |
|---|---|---|---|---|---|---|
| Male | 382 | 37 (9.7) | 13 (3.4) | 23 (6.0) | 1 (0.3) | 853.53±102.73 |
| Female | 18 | 1 (5.6) | 1 (5.6) | 0 (0.0) | 0 (0.0) | 1,529.67±703.41 |
| Total | 400 | 38 (9.5) | 14 (3.5) | 23 (5.8) | 1 (0.3) | 883.95±103.06 |
| Marital Status | No Exam | No (%) Infected Hepatitis | HBV No (%) Infected | HCV No (%) Infected | Co-infection (%) of HBV and HCV | Malaria Parasitaemia (μl of blood) mean±SEM |
| Married | 245 | 15 (6.1) | 6 (2.4) | 9 (3.7) | 0 (0.0) | 949.58±146.01 |
| Single | 155 | 23 (14.8) | 8 (5.2) | 14 (9.0) | 1 (0.6) | 780.32±132.35 |
Table 3: Mean Malaria Parasite and Prevalence of Hepatitis B and C viruses among Blood Donors related to Sex in Ife Central L.G.A
HBV= Hepatitis B Virus, HCV= Hepatitis C Virus, SEM= Standard Error of Mean, No Exam= Number Examined. Table 3: Mean Malaria Parasite and Prevalence of Hepatitis B and C viruses among Blood Donors related to Sex in Ife Central L.G.A. Osun State.
Table 3 show the prevalence of Hepatitis B virus, Hepatitis C virus and Malaria parasite among blood donors according to sex of the donors. In males, Hepatitis viral infection was highest (9.7%), then HCV (6.0%) and HBV (5.6%). The mean malaria parasitaemia was found to be 1,529.67 ± 703.41 (µl of blood) was high among females.
HBV= Hepatitis B Virus, HCV= Hepatitis C Virus, SEM= Standard Error of Mean, No Exam= Number Examined. Table 4: Mean Malaria Parasite and Prevalence of Hepatitis B and C viruses among Blood Donors related to Marital Status in Ife Central L.G.A. Osun State.
The mean malaria parasite and prevalence of Hepatitis B and C viruses among blood donors related to marital status in Ife Central L.G.A. as shown in Table 4. Among single donors, the prevalence of Hepatitis virus infection was the higher (14.8%) than HCV (9.0%) and HBV (5.2%). Co-infection was
0.6%, while the malaria infection was the highest with mean parasitaemia 949.58± 146.01 (µl of blood) among married donors. There was significant difference between marital status and hepatitis infection (p= 0.004) and between HCV (p=0.025).
| Occupation | No Exam | Hepatitis No (%) Infected | HBV No (%) Infected | HCV No (%) Infected | Co-infection (%) HBV and HCV | Malaria Parasiteamia (µl of blood) mean±SEM |
|---|---|---|---|---|---|---|
| Artisan | 132 | 15 (11.4) | 5 (3.8) | 10 (7.6) | 0 (0.0) | 1,037.55±194.67 |
| Trader | 73 | 7 (9.6) | 4 (5.5) | 2 (2.7) | 1 (1.4) | 836.16±228.35 |
| Civil servant | 73 | 4 (5.5) | 1 (1.4) | 3 (4.1) | 0 (0.0) | 1,139.85±311.05 |
| Driver | 54 | 1(1.9) | 0 (0.0) | 1 (1.9) | 0 (0.0) | 377.65 ±98.24 |
| Student | 49 | 10 (20.4) | 3 (6.1) | 7 (14.3) | 0 (0.0) | 582.47±186.66 |
| Farmer | 19 | 1 (5.3) | 1 (5.3) | 0 (0.0) | 0 (0.0) | 1,233.74±590.10 |
| Total | 400 | 38 (9.5) | 14 (3.5) | 23 (5.8) | 1 (0.3) | 883.95±103.06 |
Table 4: Mean Malaria Parasite and Prevalence of Hepatitis B and C viruses among Blood Donors related to Occupation in Ife Centra
HBV= Hepatitis B Virus, HCV= Hepatitis C Virus, SEM= Standard Error of Mean, No Exam= Number Examined Table 5: Mean Malaria Parasite and Prevalence of Hepatitis B and C viruses among Blood Donors related to Occupation in Ife Central L.G.A. Osun State.
The prevalence of Hepatitis virus infection was the highest (20.4%) among student followed by (11.4%) among artisan and the least (1.9%) among drivers. The highest HBV (6.1%) was recorded among student followed by (5.5%) among traders and the least (1.4%) among Civil servants. The highest HCV (14.3%) was recorded among donors who are students followed by (7.6%) among artisans and the least (1.9%) among drivers. The highest coinfection (1.4%) was recorded among traders. The malaria infection was highest with mean parasitaemia1, 233.74± 590.10 (µl/blood) in donors who are farmers followed by 1,037.55± 194.67 (µl of blood) among artisans and the least 582.47±186.66 (µl of blood) among students (Table 5).
| Education | No Exam | Hepatitis No (%) Infected | HBV No (%) Infected | HCV No (%) Infected | Co-infection (%) HBV and HCV | Malaria Parasiteamia (μl of blood) mean±SEM | |
|---|---|---|---|---|---|---|---|
| Primary | 27 | 3 (11.1) | 0 (0.0) | 3 (11.1) | 0 | 731.11±413.22 | |
| Secondary | 248 | 23 (9.3) | 11 (4.4) | 11 (4.4) | 1(0.4) | 931.69±136.23 | |
| Tertiary | 125 | 12 (9.6) | 3 (2.4) | 9 (7.2) | 0 (0.0) | 822.26 ±167.87 | |
| Total | 400 | 38 (9.5) | 14 (3.5) | 23 (5.8) | 1 (0.3) | 883.95±103.06 |
Table 5: Mean Malaria Parasite and Prevalence of Hepatitis B and C viruses among Blood Donors related to Education in Ife Central
HBV= Hepatitis B Virus, HCV= Hepatitis C Virus, SEM= Standard Error of Mean, No Exam= Number Examined. Table 6: Mean Malaria Parasite and Prevalence of Hepatitis B and C viruses among Blood Donors related to Education in Ife Central L.G.A. Osun State.
Table 6, show the mean malaria parasite and Hepatitis B and C viruses among blood donors related to education in Ife Central L.G.A. The prevalence of Hepatitis B virus, Hepatitis C virus and Malaria parasite among blood donors according to education. The prevalence of Hepatitis virus infection was highest (11.1%) in donors that has obtained primary followed by (9.6%) in donors that has obtained tertiary education and the least (9.3%) in donors that has obtained secondary education. The highest HCV (11.1%) was recorded in donors that has acquired primary education followed by (7.2%) in donors that has obtained tertiary education and the least (4.4%) in donors that has obtained secondary education. The highest HBV (4.4%) was recorded in donors that has obtained secondary education followed by 2.4% in donors that has obtained tertiary education. The highest co-infection (0.4%) was recorded in donors that has acquired secondary education. The malaria infection was highest with mean parasitaemia 931.69±136.23 (µl of blood) in donors that has obtained secondary education followed by 822.26± 167.87 (µl of blood) in donors that has acquired tertiary education and the least 731.11± 413.22 (µl of blood) in donors that has obtained primary education.
| Blood group | No Exam | Hepatitis No (%) Infected | HBV No (%) Infected | HCV No (%) Infected | Co-infection (%) HBVand HCV | Malaria Parasitaemia (μl of blood) mean±SEM | |
|---|---|---|---|---|---|---|---|
| Ab +ve | 1 | 0 (0.0) | 0 (0.0) | 0 (0.0) | 0 (0.0) | 0 (0.0) | 125.00±0.00 |
| A-ve | 5 | 0 (0.0) | 0 (0.0) | 0 (0.0) | 0 (0.0) | 0 (0.0) | 48.00±2.75 |
| A +ve | 59 | 7 (11.9) | 2 (3.4) | 5 (8.5) | 0 (0.0) | 0 (0.0) | 552.03±151.11 |
| B-ve | 1 | 0 (0.0) | 0 (0.0) | 0 (0.0) | 0 (0.0) | 0 (0.0) | 350.00±0.00 |
| B +ve | 72 | 10 (13.9) | 3 (4.2) | 7 (9.7) | 0 (0.0) | 0 (0.0) | 1,091.40±308.43 |
| O -ve | 28 | 2 (7.1) | 0 (0.0) | 2 (7.1) | 0 (0.0) | 0 (0.0) | 980.89±401.51 |
| O +ve | 234 | 19 (8.1) | 9 (3.8) | 9 (3.8) | 1 (0.4) | 0 (0.0) | 915.60±135.05 |
Table 6: Mean Malaria Parasite and Prevalence of Hepatitis B and C viruses among Blood Donors related to Blood Group in Ife Ce
Keys: A +ve (A Rhesus D positive), B +ve (B Rhesus D Positive), O +ve (O Rhesus D positive), AB +ve (AB Rhesus D positive), A -ve (A Rhesus D negative) B -ve (B Rhesus D negative), O –ve(O Rhesus D negative), AB +ve (AB Rhesus D negative). Table 7: Mean Malaria Parasite and Prevalence of Hepatitis B and C viruses among Blood Donors related to Blood Group in Ife Central L.G.A. Osun State.
Table 7, shows the mean malaria parasite and prevalence of hepatitis B and C viruses among blood donors related to blood groups in Ife Central L.G.A. The prevalence of Hepatitis B virus, Hepatitis C virus and Malaria parasite among blood donors according to blood groups. The prevalence of Hepatitis infection was highest (13.9%) in B+ve, followed by 11.9% in A+ve and the least 7.1% in O-ve. In HBV, (4.2%) in B+ve was the highest followed by (3.8%) in O+ve and the least (3.4%) in A+ve, the highest HCV (9.7%) was recorded in B+ve, followed by 8.5% in A+ve and the least (3.8%) in O+ve. co-infection (0.4%) was recorded in O+ve donors. The malaria infection was highest with mean parasitaemia 1,091.40±308.43 (µl of blood) among B+ve donors followed by 980.89±401.51 (µl of blood) in O-ve and the least 48.00±2.75 (µl of blood) in A-ve donors.
| No Examined | Neutrophil mean±SD | Lymphocyte mean±SD | Eosinophil mean±SD | WBC mean±SD | PCV mean±SD | |
|---|---|---|---|---|---|---|
| Age (years) | ||||||
| 18-26 | 11 | 53.64±2.53 | 42.18±1.72 | 2.36±0.78 | 5,318.18±293.51 | 41.91±1.41 |
| 27-35 | 160 | 53.28±0.59 | 44.61±0.56 | 2.09±0.18 | 5,184.32±73.80 | 42.22±0.31 |
| 36-44 | 156 | 55.21±0.59 | 44.63±0.60 | 1.24±0.15 | 5,177.56±77.08 | 42.52±0.38 |
| 45-53 | 63 | 54.62±0.89 | 44.17±6.86 | 1.71±0.29 | 4,950.79±110.89 | 42.27±0.51 |
| 54-62 | 10 | 53.20±1.75 | 44.60±1.80 | 2.20±0.62 | 4,940.00±355.34 | 41.10±1.20 |
| Sex | ||||||
| Male | 382 | 54.30±0.37 | 44.05±1.37 | 1.71±0.11 | 5,135.34±47.70 | 42.51±0.21 |
| Female | 18 | 53.11±1.82 | 44.83±1.58 | 1.67±0.56 | 5,294.44±274.21 | 38.11±0.96 |
| Marital status | ||||||
| Married | 245 | 54.49±0.46 | 44.17±0.46 | 1.48±0.13 | 5,126.94±61.41 | 42.41±0.28 |
| Single | 155 | 53.86±0.61 | 43.97±0.57 | 2.08±0.18 | 5,167.10±73.52 | 42.14±0.33 |
| Occupation | ||||||
| Artisan | 132 | 54.42±0.64 | 43.62±0.62 | 1.86±0.20 | 5,287.88±87.14 | 42.03±3.71 |
| Trader | 73 | 53.68±0.79 | 45.18±0.97 | 1.29±0.22 | 4,957.53±99.06 | 42.97±4.64 |
| Civil servant | 73 | 53.03±0.92 | 45.59±0.93 | 1.67±0.25 | 5,193.15±109.64 | 41.42±3.72 |
| Driver | 54 | 54.39±0.89 | 44.02±0.88 | 1.50±0.28 | 5,092.59±109.11 | 43.00±6.04 |
| Student | 49 | 54.63±1.18 | 43.16±0.01 | 2.33±2.34 | 4,987.76±133.61 | 42.22±4.34 |
| Farmer | 19 | 58.53±1.63 | 40.00±1.58 | 1.47±0.49 | 5,189.47±274.01 | 43.32±3.94 |
| Artisan | 132 | 54.42±0.64 | 43.62±0.62 | 1.86±0.20 | 5,287.88±87.14 | 42.03±3.71 |
| Education | ||||||
| Primary | 27 | 54.37±1.39 | 44.07±1.35 | 2.00±0.43 | 5,148.15±231.45 | 41.78±0.79 |
| Secondary | 248 | 54.26±0.43 | 43.99±0.43 | 1.61±0.13 | 5,172.98±57.36 | 42.27±0.29 |
| Tertiary | 125 | 54.19±0.75 | 44.29±0.71 | 1.86±021. | 5,080.80±86.04 | 42.50±0.34 |
| Total | 400 | 54.25±0.37 | 44.09±0.36 | 1.71±0.11 | 5,142.50±47.14 | 42.31±0.21 |
Table 7: The Distribution of Neutrophil, Lymphocyte, Eosinophil, White Blood Cells and Packed Cell Volume related to Socio- De
Normal ranges: WBC = 4000-10,000/mm 3, Neutrophil = 40-70% Lymphocyte = 20-45%, Eosinophil= 1-6%, Packed cell volume (PCV) Women = (36-46%), Men = (40-54%). Table 8: The Distribution of Neutrophil, Lymphocyte, Eosinophil, White Blood Cells and Packed Cell Volume related to Socio- Demographic Factors in Ife Central.
Table 8, is the distribution of neutrophil, lymphocyte, eosinophil, white blood cells and packed cell volume according to socio-demographic factors among blood donors. The highest mean PCV in the study was 42.52±0.38 in aged group 36-44 years followed by 42.27±0.51 in those aged 45-53 years and the least was 41.10±1.20 in donors of 54- 62 years old. The highest mean WBC was 5, 318.18±293.51 in aged 18-26 years followed by 5,184.32±73.80 in aged 27-35 years and the least 4,940.00±355.34 in aged 54-62 years. The highest mean eosinophil was 2.36±0.78 in aged 18-26 years followed by 2.20±0.62 in aged 54-62 years and the least 1.24±0.15 in aged 36-44 years. The highest mean lymphocyte counts 44.63±0.60 in aged 36-44 years followed by 44.61±0.56 in aged 27-35 years and the least 42.18±1.72 in aged 18-26 years. The highest mean neutrophil count (55.21±0.59) was recorded in aged group 36-44 years followed by 53.64±2.53 in those aged 18-26 years and the least 53.20±1.75 in age 54-62 years old.
The highest mean PCV of 42.51±0.21 was recorded in male, mean WBC of 5,294.44±274.21 in females, mean eosinophil 1.71±0.11 in males, mean lymphocyte counts of 44.83±1.58 in females and mean neutrophil count 54.30±0.37 was recorded in males.
The highest mean PCV value of 43.32±3.94 was recorded among farmers, mean WBC 5,287.87±274.14 among artisans, mean eosinophil 2.33±2.34 among students, mean lymphocyte counts 45.59±0.93 among civil servants and mean neutrophil counts 58.53±1.63 was recorded among farmers. The highest mean PCV 43.32±3.94 was recorded among farmers, mean WBC 5,287.87±274.14 among artisans, mean eosinophil 2.33±2.34 among students, mean lymphocyte counts
45.59±0.93 among civil servants and mean neutrophil counts 58.53±1.63 was recorded among farmers.
The highest mean PCV 42.50±0.34 was recorded among donors in tertiary education, mean WBC 5,172.98±57.36 among donors with secondary education. Mean eosinophil counts 2.00±0.43 among student, mean lymphocyte counts 44.29±0.71 among donors with tertiary and mean neutrophil counts 54.37±1.39 was recorded among donors with primary education. Discussion and Conclusion In this study, the overall prevalence of Malaria infection was 883.95± 103.06(µl/blood), The overall mean malaria parasiteamia observed in the Local Government Areas was lower than that of Awosolu OB, et al. [3] who recorded Plasmodium falciparum with a mean parasite density of 1,814.70 parasite/μL in urban communities of Ibadan, Southwestern Nigeria. The result was also lower to that of Okoroiwu GIA [7], who recorded malaria paeasitaemia of greater than 10,000 parasites /ul of blood among the residents of Abuja, Nigeria, but Antwi-Baffour S, et al. [8] recorded the low parasitaemia in their study on the incidence of malaria parasites in screened donor blood for transfusion to be 320/μL which is lower than what was recorded in this study. The low malaria infection in this study may be due to low level of education, environmental factors and improper use of long-lasting insecticide nets and lack of mobilization on malaria prevention.
The overall prevalence of Hepatitis infection was 9.5%, Hepatitis B virus (HBV) infection was 3.5%, Hepatitis C virus (HCV) infection was 5.8% and co-infection of HBV and HCV infections was 0.3%, However, Olaru ID, et al. [9], reported the high prevalence of HBV (5.8%) and HCV (10.3%) among patients with Tuberculosis in Heidiberg. Non infections of tuberculosis among the donors in this could be attributed to low prevalence of the hepatitis infection in this study. Non infections of tuberculosis among the donors in this could be attributed to low prevalence of the hepatitis infection in this study. Njouom R, et al. [10] also reported high prevalence of hepatitis infection (17.1%), HBV (4.4%), HCV (10.5%) and co-infection (0.7%) in Cameroon which was slightly higher than the result in this study. Low infection rate of HBV and HCV in this study may be due to non-addicted to intravenous drugs and non-sharing of syringes and needles also, usage of protected sex.
The malaria infection was highest with mean parasitaemia 2,136.18± 770.70 (µl of blood) in donors aged 18-26 years. This was in conjunction with the work done by Omatola CA, et al. [11], on Asymptomatic Malaria Infection among Pregnant Women in a Semiurban Community of North-Central Nigeria, where malaria infection peaked at ages 31– 40 years but decreased with older ages. Okoroiwu GIA [7], recorded high malaria paeasitaemia among age range 2-10 years among blood donors residing in Abuja, Nigeria, Obimakinde ET, et al. [12], in the study on the prevalence of malaria Infection among Patients attending the Health Centre of the Federal University of Technology, Akure, reported that the highest prevalence of 91.1% was recorded among the children aged 1-10years, while the lowest prevalence of 56.8% was recorded among the age group above 60 year. The high prevalence of malaria infection among the young adult in the study can be attributed to living in households with stagnant water in the compound and staying outdoors during the night with noncompliance to usage of Insect Treated Nets.
The prevalence of Hepatitis virus infection was the highest (18.2%) in donors aged 18-26 years, HBV has the highest (18.2%) in donors aged 18-26 years, The highest HCV (9.4%) was recorded in aged 27-35 years , The co- infection was (0.6%) in donors aged 27-35years. Also, Aernan TP, et al. [13] recorded that the more youthful age groups 18-22years, 23-27years and 28-32years had higher prevalence of Hepatitis infection at 11.90%, 13.05% and 6.53%, respectively In addition, it was also reported by Amazigo UO, et al. [14] that by the age of 40 years, 87 % of the Nigerian population has at least one HBV serologic markers. The prevalence of hepatitis among may be as a result of uncontrolled and unprotected activities with an infected person and sharing of needles and syringes that has been contaminated with an infected blood or other fluids from an infected individual. Living with person who has hepatitis and working in an area where the infection can be easily contacted is another reason for the high prevalence of the infection was more among the age group in the study.
The mean malaria parasitaemia was found to be 1,529.67 ± 703.41 (µl of blood) was high among females. This was in conjunction with the report of Obimakinde ET, et al. [12], where the prevalence of malaria was among the female patients, also, Surakat OA, et al. [15], reported that malaria infection was prevalent among female in Ejigbo and Ilobu Local Government areas of Osun State and Ojurongbe O, et al. [16], also reported in their study on prevalence of P. falciparum infection among HIV positive individuals in Nigeria, reported that more female (72.97%) were infected with malaria than male (27.03%).On the contrary Olopade et al. reported that there was more malaria in male (20.8%) than female (12.5%) Malaria. The prevalence of malaria among female may be due to high work burden in areas where mosquitos are prevalent. The high prevalence of malaria infection shown among female in this study could be due to female particularly women’s high work load in area where mosquitos are rampart which may even delay them from seeking medical attention. Pregnant women and women with HIV and those that are immunosuppressed are more likely to be infected.
In males, Hepatitis viral infection was highest (9.7%), then HCV (6.0%) and HBV (5.6%), but Nkrumah et al., (2011), reported that the prevalence of Hepatitis B viral (HBV) infection was high in females with 21.4% than males and Hepatitis C viral (HCV) infection was high among males with 11.6% while HBV and HCV co-infection was high in males 2.6% than females. Abate A, et al. [17] also, reported that the difference in proportions of prevalence of HBV was 4.4% in male versus 1.4% in female. Similarly, a study done by Alemeshet Y, et al. [18], in Southwest Ethiopia showed a high prevalence of the HBV in male 2.5% than the female 0.8% donors. The low infection rate of HBV in females may be due to spontaneous clearance of acute infection which is attributed to the occurrence of certain genetic factors such as IL28B genetic variant in females Umumararungu, et al. [19]. However, the high prevalence of HBV in males might be due to the likelihood of men to have multiple sex partners and might be involved in unprotected sex.
The malaria infection was the highest with mean parasitaemia 949.58± 146.01 (µl of blood) among married donors. However, Surakat OA, et al. [15], reported that single women were more susceptible to malaria infection than married women, which could be of a reflection of socio- economic status. The prevalence of malaria among married women can be as a result of their household responsibilities such as waking up early before to prepare the household for the activities of the day and in some communities, cooking the evening food outdoor which may put them at greater risk than men. Among single donors, the prevalence of Hepatitis virus infection was the higher (14.8%) than HCV (9.0%) and HBV (5.2%). Co-infection was 0.6%, There was significant difference between marital status and hepatitis infection (p= 0.004) and between HCV (p=0.025). This is similar to the reports of Abate A, et al. [17], where the prevalence of HBV was higher in single 4.2% than married and that of Negash M, et al. [20], in which the sero-positivity of HBV was significantly associated with marital status, on the contrary, Kesete, et al. [21], reported that married were found to be more exposed to both HBV and HCV infections with prevalence of 8.4% and 2.4% respectively. Also, Yakubu A, et al. [22], reported that Single males have higher prevalence of 26.1% of HBV infection than their married counterparts with prevalence of 16.7%. The singles are more prone to hepatitis infection in this study. This may be due to promiscuous and unprotected sexual activities among singles. Also, homosexuality and oral sex which are common among single can be a vital factor.
The malaria infection was highest with mean parasitaemia 1,233.74± 590.10 (µl/blood) in donors who are farmers, on the contrary by Adeola OO, et al. [23], stated that malaria infection was significantly high among student in Osogbo, Osun State (p<0.0001). The high prevalence of malaria among farmer may be due to their agricultural activities which exposed them to the risk factors, such as lakes, rivers or swamps where mosquito breed, especially those practice irrigation agriculture. The prevalence of Hepatitis virus infection was highest (20.4%), the highest HBV (6.1%) and the highest HCV (14.3%) were recorded among donors who are students, while the highest co- infection (1.4%) was recorded among traders. Prevalence of Hepatitis among students in this study could be due to a lack of caution when sharing sharp objects and unsafe sexual practices.
The malaria infection was highest with mean parasitaemia 931.69±136.23 (µl of blood) in donors that has obtained secondary education. This is in conjunction with the report of Surakat OA, et al. [15], where there was a significant decline in malaria prevalence as the educational status progress, where those with no formal education had highest prevalence while those who has obtained tertiary education had the lowest prevalence. High malaria infections among those that has acquired secondary education may be due to low education which might increase their vulnerability to malaria infection for the probability of dying from malaria is inversely related to education.
The prevalence of Hepatitis virus infection was highest (11.1%) in donors that has obtained primary education. The highest HCV (11.1%) was recorded in donors that has acquired primary education, The highest HBV (4.4%) was recorded in donors that has obtained secondary education.
The highest co-infection (0.4%) was recorded in donors that has acquired secondary education. However, Kesete, et al. [21], reported that the highest prevalence of HBV 9.8% was recorded among donors that has acquired higher level of education, in contrast, they report that HCV infection prevalence decreased with increasing level of education. However, Olakunle BO, et al. [24], reported that the prevalence of HBV was significantly lower among women with at least secondary education compared with those with no education or primary education. This study shows that those with primary education has more Hepatitis infection than others. High hepatitis infections among those that has acquired primary education may be due to lack or low education which might increase their vulnerability to the infection. The higher the educational level an individual had achieved can help to reduce the risk of acquiring the infection.
The malaria infection was highest with mean parasitaemia 1,091.40±308.43 (µl of blood) among B+ve donors, but on the contrary, Obinna, et al. observed that people with blood O+ showed significantly higher rate of infection of malaria among blood donors in Onitsha, Nigeria, but Antwi-Baffour S, et al. [8], whose work on the incidence of malaria parasites in screened blood donor for transfusion reported that all the blood groups examined had malaria except blood group O negative and A negative and the blood group O positive had the highest percentage 52% of malaria infection, but Afoakwah R, et al. [25], reported that individuals with blood group A are highly susceptible to falciparum malaria. This reason given was that a protein produced by some strains of the malaria can cause red blood cells clump especially in group A individual which increase the severity of malaria infection.
The prevalence of Hepatitis infection was highest (13.9%) in B+ve, In HBV, (4.2%) in B+ve was the highest, the highest HCV (9.7%) was recorded in B+ve, and co-infection (0.4%) was recorded in O+ ve donors. The high prevalence of hepatitis among blood groups as recorded in this study may be due to fact that certain blood groups influence the pathogenesis of HBV and HCV infections by modulating the inflammatory and immune responses or by acting as ligands and receptors for such agents Tyagi S, et al. [26], Zhou Y, et al. [27]. For example, some ABO antigens have the ability to block the binding of transfusion-transmitted disease causing organisms to polysaccharides on the host’s cells while others are not SB KV, et al. [28]. Also, Liu J, et al. [29] affirmed that Blood group O has been found with a higher risk of infection of HBV than other blood groups.
The highest mean PCV in the study was 42.52±0.38 in aged group 36-44 years. The highest mean WBC was 5, 318.18±293.51 in aged 18-26 years. The highest mean eosinophil was 2.36±0.78 in aged 18-26 years. The highest mean lymphocyte counts 44.63±0.60 in aged 36-44 years. The highest mean neutrophil count (55.21±0.59) was recorded in aged group 36-44 years.
The highest mean PCV of 42.51±0.21 was recorded in male, mean WBC of 5,294.44±274.21 in females, mean eosinophil 1.71±0.11 in males, mean lymphocyte counts of 44.83±1.58 in females and mean neutrophil count 54.30±0.37 was recorded in males. The highest mean PCV value of 43.32±3.94 was recorded among farmers, mean WBC 5,287.87±274.14 among artisans, mean eosinophil 2.33±2.34 among students, mean lymphocyte counts 45.59±0.93 among civil servants and mean neutrophil counts 58.53±1.63 was recorded among farmers. The highest mean PCV 43.32±3.94 was recorded among farmers, mean WBC 5,287.87±274.14 among artisans, mean eosinophil 2.33±2.34 among students, mean lymphocyte counts 45.59±0.93 among civil servants and mean neutrophil counts 58.53±1.63 was recorded among farmers.
The highest mean PCV 42.50±0.34 was recorded among donors in tertiary education, mean WBC 5,172.98±57.36 among donors with secondary education. Mean eosinophil counts 2.00±0.43 among student, mean lymphocyte counts 44.29±0.71 among donors with tertiary and mean neutrophil counts 54.37±1.39 was recorded among donors with primary education. The results of this study showed that all the haematological parameters examined falls within the normal range despite the presence of malaria and hepatitis infections. also, the study conducted by Oke OT, et al. [30], on the assessment of haematological parameter and Liver enzyme among Hepatitis B Infected blood donors reported that there is a decrease in the haematological parameters of the HBV seropositive subjects. Although various hematological abnormalities have been duly linked to the prevalence of malaria and hepatitis.
References
-
Oniyangi O, Omari AA (201) Malaria Chemoprophylaxisin Sickle Cell Disease. Cochrane Database Syst Rev (11): CD00389.
-
WHO (2024) New Guidelines on Prevention, Diagnosis and Treatment of Chronic Hepatitis B Infection at the 2024 Asian Pacific Conference for the Study of Liver Disease (APASL) in Kyoto, Japan.
-
Awosolu OB, Yahaya ZS, Farah HM, Simon-Oke IA, Fakunle C (2021) A cross-sectional study of the prevalence, density, and risk factors associated with malaria transmission in urban communities of Ibadan, Southwestern Nigeria. Heliyon 7(1): e05975.
-
WHO (2024) World malaria report, WHO’s global efforts to control and eliminate malaria. Its work is guided by the Global technical strategy for malaria. Geneva, 2021. 2016-2030.
-
Akeem, Wahab B, Olamiposi JO (2020) Investigation of the use of photovoltaic solar water pump by occupants of residential buildings in Ile-Ife, Nigeria. Environmental Research & Technology 3(2): 71-80.
-
Cheesbrough M (2017) Medical Laboratory Manual for Tropical countries. 5th (Edn.), Cambridge University press, UK, pp: 221-250.
-
Okoroiwu GIA (2021) Assessment of Malaria parasitaemia among the residents of FCT Abuja Municipal Area Council FCT, Abuja, Nigeria. J Appl Sci Environ manage 25(5): 769-774.
-
Antwi-Baffour S, Kyeremeh R, Amoako AP, Annison L, Tetteh JO, et al. (2019) The Incidence of Malaria Parasites in Screened Donor Blood for Transfusion. Malar Res Treat, pp: 1457406.
-
Olaru ID, Meier B, Mirzayev F, Prodanovic N, Kitchen PJ, et al. (2023) Global prevalence of hepatitis B or hepatitis C infection among patients with tuberculosis disease: systematic review and meta-analysis. EClinical Medicine 58: 101938.
-
Njouom R, Siffert I, Texier G, Lachenal G, Tejiokem MC, et al. (2023) The burden of hepatitis C virus in Cameroon: Spatial epidemiology and historical perspective. J Viral Hepat 25(8): 959-968.
-
Omatola CA, Okolo MO (2021) Hepatitis B and Asymptomatic Malaria Infection among Pregnant Women in a Semiurban Community of North-Central Nigeria. J Environ Public Health.
-
Obimakinde ET, Simon-Oke IA (2017) The Prevalence of Malaria Infection among Patients Attending the Health Centre of the Federal University of Technology, Akure, Nigeria. International Journal of Tropical Disease & Health 27(4): 1-7.
-
Aernan TP, Sar TT, Torkula SH (2011) Prevalence of Plasmodia and hepatitis B virus co-infection in blood donors at Bishop 152Murray Medical Centre, Makurdi, Benue State, Nigeria. Asian Pacific Journal of Tropical Medicine, pp: 224-226.
-
Amazigo UO, Chime AB (1990) Hepatitis B Virus Infection in Rural and Urban populations of Eastern Nigeria: prevalence of serological Markers. East Afr Med J 67(8): 539-44.
-
Surakat OA, Onakhinor S, Adewuyi A, Dauda OG, Adeponle O, et al. (2023) Epidemiology and risk factors of malaria among pregnant women attending antenatal clinics in Osun State, Nigeria. The Zoologist 22: 55-61.
-
Ojurongbe O, Oyeniran OA, Alli OA, Taiwo SS, Ojurongbe TA, et al. (2014). Prevalence of Plasmodium falciparum Parasitaemia and Its Correlation with Haematological Parameters among HIV Positive Individuals in Nigeria. J Trop Med.
-
Abate A, Degarege A, Erko B (2013) Community knowledge, attitude and practice about malaria in a low endemic setting of Shewa Robit Town, northeastern Ethiopia. BMC Public Health 13(312).
-
Alemeshet Y, Fissehaye A, Alima H (2011) Hepatitis B and C Viruses Infections and Their Association with Human Immunodeficiency Virus: A Cross-Sectional Study among Blood Donors in Ethiopia. Ethiop J Health Sci 21(1): 67-75.
-
Umumararungu, Esperance, Fabien, Ntaganda, John, et al. (2017) Prevalence of hepatitis C virus infection and its risk factors among patients attending Rwanda Military Hospital, Rwanda. Biomed Res Int 34 (5): 79-85.
-
Negash M, Ayalew M, Geremew D, Workineh M (2019) Seroprevalence and associated risk factors for HIV, Hepatitis B and C among blood Donors in South Gondar District blood Bank, Northwest Ethiopia. BMC Infect Dis 19(1): 430.
-
Kesete, Yafet, Fessehaye N, Achila OO, Mekonen F (2022) Prevalence of Hepatitis B and C Viruses and Associated Risk Factors in Patients Suspected of Liver Diseases in Asmara, Eritrea. J Infect Dis Med 7(2): 218.
-
Yakubu A, Sahabi DM, Umar A, Saidu Y, Magaji UF (2016) Prevalence of HBsAg among Prospective Blood Donors and Pregnant Women in Kebbi State, Nigeria. Nigerian Journal of Basic and Applied Science 24(1): 57-63.
-
Adeola OO, Kolawole OE, Yemi AF, Hilda AE, Samson AT, et al. (2022) Occurrence and clinical features of HIV and malaria in co-infected individuals in Osun State, Nigeria. J Family Med Prim Care 11(9): 5332-5339.
-
Olakunle BO, Adeyinka DA, Olakunde OA, Uthman OA, Bada FO, et al. (2021) A systematic review and meta- analysis of the prevalence of hepatitis B virus infection among pregnant women in Nigeria. PLoS One 16(10): e0259218.
-
Afoakwah R, Aubyn E, Prah J, Nwaefuna EK, Boampong JN (2016) Relative Susceptibilities of ABO Blood Groups to Plasmodium falciparum Malaria in Ghana. Adv Hematol.
-
Tyagi S, Tyagi A (2013) Possible correlation of transfusion transmitted diseases with Rh type and ABO blood group system. J Clin Diagn Res 7(9): 1930-1931.
-
Zhou Y, Zhou Q, Lin Q, Chen R, Gong Y, et al. (2015) Evaluation of risk factors for extrahepatic cholangiocarcinoma: ABO blood group, hepatitis B virus and their synergism. Int J Cancer 133(8): 1867-1875.
-
SB KV, Bandi S, Kondareddy S, Madithadu A (2015) Association of ABO and Rh blood groups to HBV, HCV infections among blood donors in a blood bank of tertiary care teaching hospital in southern India: a retrospective study. Int J Res Med Sci 3(7): 1672-1676.
-
Liu J, Zhang S, Liu M, Wang Q, Shen H, et al. (2018) Distribution of ABO/Rh blood groups and their association with hepatitis B virus infection in 3.8 million Chinese adults: a population-based cross-sectional study. J Viral Hepat 25(4): 401-411.
-
Oke OT, Oduntan SO, Olasimbo GI, Abdulrahman AO, Olamijuwon PB, et al. (2024) Assessment of haematological parameter and Liver enzyme among Hepatitis B Infected Blood Donors. IDOSR Journal of Applied Sciences 9(1): 15-23.
- Origin, Evolution, and Functional Impact of Short Insertion- Deletion Variants in Human Genomes: A Review
- Harnessing Molecular Glues for Next-Generation Vaccine, Cancer and Cardiovascular Disease Drug Development: A Comprehensive Review
- Lateral Cervical Epidermal Inclusion Cyst in a Paediatric Patient: A Rare Case Report
- Withanolides and Withaferin A- What’s next in Ashwagandha Research
- Designing of Dual Pulse Photoacoustic Tomography for Imaging of Drug-Response and Tumor Growth
- Trend Scenarios of Mortality due to Diabetes Mellitus and its Correlation with the Economic Sector, in the State of Mexico, for the Years 2020, 2025 and 2030