Comparison of Allele Frequencies of Benghazi Population with Other Metapopulation
This is, to our knowledge, the first in-depth and largest study (238 samples) of genetic diversity in Y-STR haplotypes in an eastern Libyan population (recorded in Afro-Asiatic group from Metapopulation published in Y-STR Haplotype Reference Database-YHRD). Two previous studies, of a Tripoli population (West of Libya) and a Fezzan population (South Libya) analyzed a smaller number of inhabitants (63 samples and 47 samples, respectively) and (YHRD). Recently, (April 2011) YHRD recorded 47 and 82 haplotypes from Tripoli (Berber and Arabs 2011) respectively. Method: We Compare allele frequencies of Benghazi population with Y-STR Haplotype Reference Database -metapopulation. Conclusion: Benghazi population is similar to other Asian groups, such as Euro-Asian and East Asian. Hence, the Benghazi population shows genetic affinity to Asian and Middle Eastern rather than African and West North African groups.
Introduction
The Y Chromosome Haplotype Reference Database (YHRD) is an open-access, annotated collection of population samples typed for Y chromosomal sequence variants [1]. Two important objectives are pursued: the generation of reliable frequency estimates for Y-STR haplotypes and Y-SNP haplotypes to be used in the quantitative assessment of matches in forensic and kinship cases and) the characterization of male lineages to draw conclusions about the origins and history of human populations. The database is endorsed by the International Society for Forensic Genetics (ISFG). By May 2023 about 350,000 Y chromosomes typed for 9-29 STR loci have been directly submitted by worldwide forensic institutions and universities. In geographic terms, about 53% of the YHRD samples stem from Asia, 21% from Europe, 12% from North America, 10% from Latin America, 3% from Africa, 0.8% from Oceania/Australia and 0.2% from the Arctic. The 1.406 individual sampling projects are described in about 800 peer-reviewed publications [2].
AMOVA
Analysis of molecular variance (AMOVA) is a method for analyzing population variation using molecular data, e.g. Y-STR haplotypes [3]. With AMOVA it is possible to evaluate and quantify the extent of differentiation between two or more population samples. AMOVA is implemented as an online tool in the YHRD and provides a way of estimating ΦST and FST values. The online tool accepts Excel files and creates entry files from it. As much as 9 reference populations selected from the YHRD as well as population sets can be added to the AMOVA analysis. The online calculation returns as a result a *.csv table with pairwise FST or ΦST (RST) values plus p-values as a test for significance (10,000 permutations). In addition, an MDS plot is generated to illustrate the genetic distance between the analyzed populations graphically. The program shows the references for the selected population studies which facilitates the correct citation.
Aim
To compare Benghazi population allele frequencies with other metapopulation allele frequencies recorded in Haplotype Reference Database (YHRD).
Methodology
Informed consent was obtained from 238 unrelated Libyan males (Benghazi region) . DNA was extracted from blood stains collected on FTA® cards [4, 5].
Amplified data was analyzed and then data compared with Haplotype Reference Database tool
Results and Discussion
Comparison of Benghazi with Afro-Asiatic Metapopulation Recorded in YHRD(Y-STR Haplotype Reference Database)
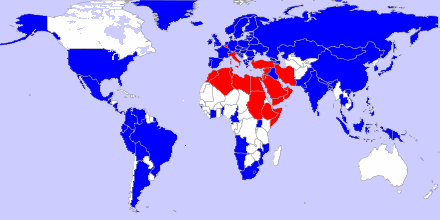
As shown below in Figure 1 the map illustrates Afro- Asiatic populations (in red). We have investigated a Benghazi population considered to be the largest population within the Afro-Asiatic group regarding Y haplotypes investigations, as shown in Table 1.
| Afro-Asiatic Population -YHRD | Number of Haplotypes determined |
|---|---|
| Banghazi, Libya [Arab] | (238 haplotypes) |
| Tripoli, Libya [Arab] | (82 haplotypes) |
| Fezzan, Libya [Tuareg] | (47 haplotypes) |
| Tripoli, Libya [Libyan] | (63 haplotypes) |
| Tripoli, Libya [Berber] | (47 haplotypes) |
| Rabat, Morocco [Arabs] | (130 haplotypes) |
| Oman [Omani] | (99 haplotypes) |
| Saudi Arabia [Saudi] | (106 haplotypes) |
| Egypt [Egyptian] | (83 haplotypes) |
| Oran, Algeria [Arab] | (102 haplotypes) |
| Israel and Palestinian Authority Area [Arab] | (163 haplotypes) |
| Jordan [Arab-Adnanit] | (50 haplotypes) |
| Kuwait [Kuwaiti] | (126 haplotypes) |
| Tunis, Tunisia [Tunisian] | (54 haplotypes) |
| Yemen [Yemeni] | (104 haplotypes) |
Table 1: Haplotype Sampling of the Afro- Asiatic Metapopulation Group Recorded in YHRD.
Table 1 shows a list of 15 of the 40 populations within the Afro-asiatic population group (which includes a total of 3809 haplotypes). These populations listed have genetic affinity (allele frequency) as identified from the YHRD and described below. As can be seen in the table, Benghazi population has the largest number of haplotypes amongst the 15 populations shown. As additional information, a further table is shown in Table 2 listing all of the metapopulation groups found on in the YHRD and respective numbers of haplotypes.
| Metapopulation Group | Number of tested Haplotypes |
|---|---|
| Afro-Asiatic | 3809 haplotypes in 40 populations |
| African | 4890 haplotypes in 46 populations |
| East-Asian | 20098 haplotypes in 106 populations |
| Eskimo-Aleut | 643 haplotypes in 10 populations |
| Native American | 1588 haplotypes in 43 populations |
| Euro-Asian | 51619 haplotypes in 406 populations |
Table 2: Distribution of Y–Haplotypes Tested in Some Samples all Over the Earth Recorded in YHRD as Metapopulation.
Comparison of the Afro-Asiatic Group (Including Benghazi Population) with all Metapopulation Groups Recorded in YHRD in Terms of Allele Frequencies
The allele frequencies of 17 loci were compared for the metapopulation groups using the YHRD website (www.yhrd.
org). The Benghazi population is included in the Afro-Asiatic group. The Afro-Asiatic group had similar allele frequencies to the Euroasian and Australian groups when considering all 17 loci. On the other hand, differences were seen when the Afro-Asiatic Group was compared with geographically distant populations (Native-American and Eskimos).
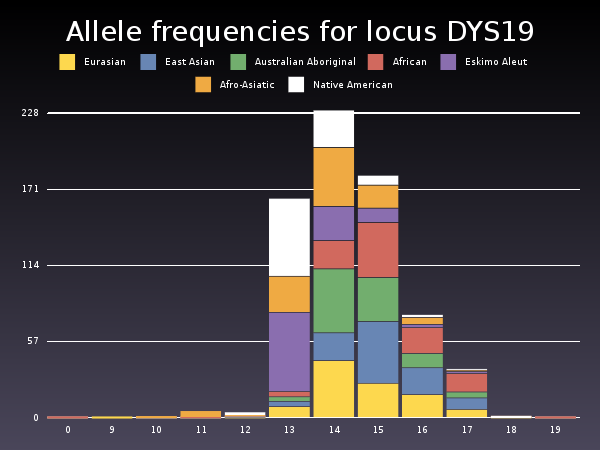
Figure 2: An Example from YHRD.Org Showing Allele Frequencies Distribution for Locus DYS19 (the First Invented Locus) all Over Metapopulations (Benghazi Population Included within Afro-Asciatic Group). The Commonest Allele Frequency for Afro- Asciatic is Allele Number 14 (20%) (Same Allele Detected in this Study) and this Frequency is Similar to that of the Australian and Euroasian Groups but different to that of Other Group.
An example of the comparison for one of these loci (DYS19) is shown in Figure 2. DYS19 was the first Y chromosomal locus explored [6]. As can be observe in Figure 2, allele 14 is the most common allele and observed in 7metapopulation groups, however, the frequency of this allele (approximately 20%) is similar for groups Eurasian, Australian Aboriginal and Afro-Asiatic (which includes the Benghazi population). Therefore these three populations have genetic affinity.
Using AMOVA (Analysis of Molecular Variance)
3-Comparison of Benghazi and Geographically nearby Populations: A P-value is a measure of how much evidence we have against the null hypothesis. The null hypothesis, traditionally represented by the symbol H0, represents the hypothesis of no change or no effect. The smaller the P-value, the more evidence we have against H0. P-value of <0.05 will be significant values for the populations compared with Benghazi (if P- value <0.05 that means the relation between Benghazi and that population significant and close to it).
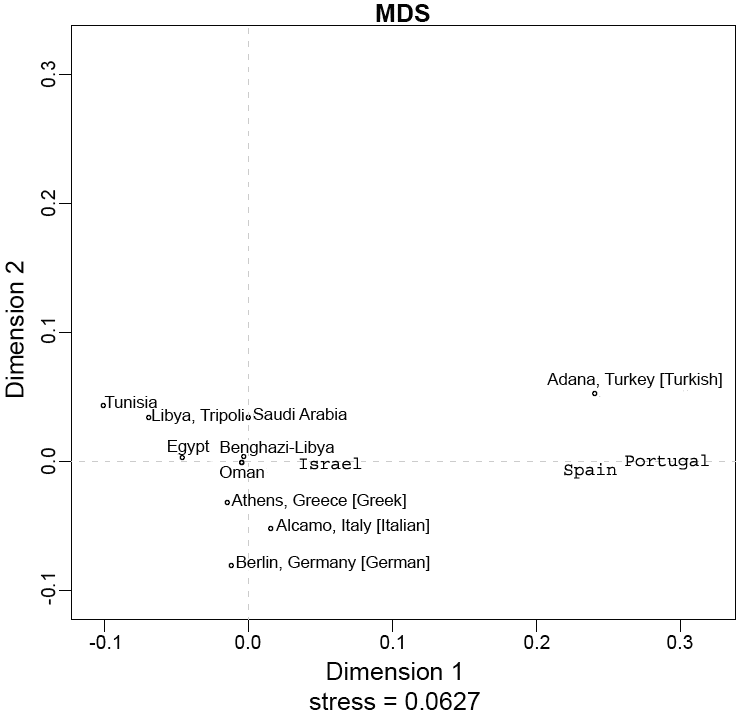
A Fst genetic distances and pair-wise analysis of molecular variance (AMOVA) test carried out through YHRD revealed significant differences between the two populations from Northern Libya (Tripoli and Benghazi); Tripoli (P= 0.2385) showed similarities to Tunisia while Benghazi was similar to Egypt, when comparing North African countries . Similarities between Egypt (P= 0.0485) and Libya have also been previously reported by Omran GA, et al. [7]. The AMOVA analysis also revealed similarities to Israel and Palestinian Authority Area (P= 0.0000), recently reported by Fernandes AT, et al. [8] (Figure 3). Both of these studies analysed the same 17 markers evaluated for the Benghazi population in the current study. This genetic affinity probably arises primarily because of the geographical proximity of these countries to Benghazi. Similarities in AMOVA analysis of Benghazi with Yemen (P= 0.0562), Oman (P=0.0246), Saudi Arabia (P=0.0489) and other Gulf countries using minimal haplotypes (9 markers which are included in the 17 marker Y filer kit) may be due to the historical Islamic migration towards North African countries. On the other hand, similarity with Greece (P= 0.0321) 9 may be due to old trade and architectural history in North Africa (Figure 3).
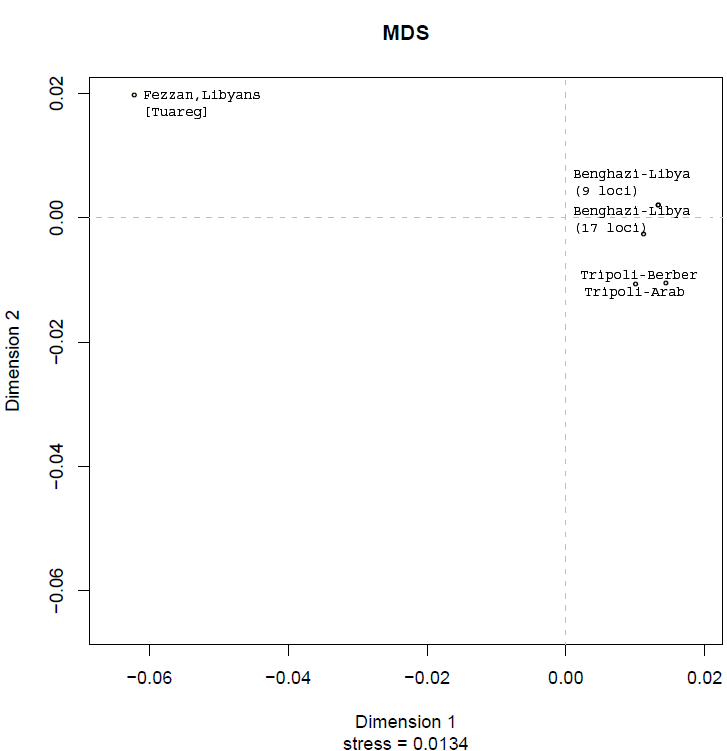
Comparison of Benghazi and Other Main Libyan Groups: Different Libyan groups (Tripoli- Arab, 63 Haplotypes 10, Tripoli Berber, 47 Haplotypes, and Fezzan (Tuareg), 47 Haplotypes) (yhrd.org) were compared regarding minimal haplotypes loci (9 loci total) to identify genetic affinity using the YHRD website. Benghazi population was compared twice, once only taking into account the 9 minimal loci and the second time considering all 17 loci that had been typed in the current study. An Fst genetic distances and pair-wise analysis of molecular variance (AMOVA) test was carried out through the YHRD website, calculating p-values with 10000 permutations (P-value <0.05). The results revealed significant differences between the Libyan populations mentioned above and Fezzan (Tuareg), which is geographically distant from the other Libyan groups (P=0.0782). The AMOVA analysis also revealed similarities in the other Libyan groups, such as Benghazi and Tripoli (Berber) (P=0.0102) as shown in Figure 4.
Our results differ significantly from the results reported for a western Libyan population (Tripoli) 10 in which Y-STR polymorphisms across 9 loci were analysed. These 9 markers are included in the Y filer kit used in our study, however, we analysed the additional 8 Y-STR markers, providing further population data for eastern Libyan men. The populations in Tripoli and Tunisia are similar and differ from that in Benghazi (P= 0.168 compared with Tunisia) 6 and other Western North African populations, whilst we observed that Benghazi population is similar to geographically close Middle Eastern populations.
Geographically nearby European populations (Spain and Portugal) differ significantly from Benghazi population P -values were (0.3689& 0.3006) respectively recorded by AMOVA (all population data compared with Benghazi was obtained from YHRD) [9, 10].
New Alleles Observed in the Benghazi Population
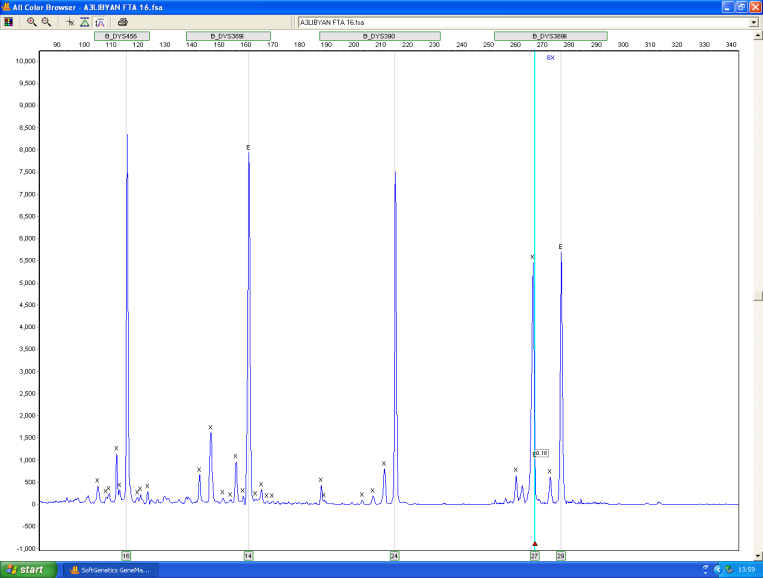
Specific Allele Detection: We observed the duplicated alleles 27, 29 (usually only one allele is called at this location) in one of the Benghazi population samples (of a total of 238 samples) (Figure 5). According to the record of new alleles recorded in YHRD duplicated alleles 27, 29 for locus DYS389II have been detected for the first time in this study. They have only been found in the Benghazi population which makes them highly discriminatory for Benghazi when compared with other population haplotypes. Further sequencing is necessary to study the reason for detecting these new alleles, such as mutations, which would be the way that the locus structure of the Y chromosome would be changed, considering there is neither genetic drift nor any recombination in the Y chromosome.
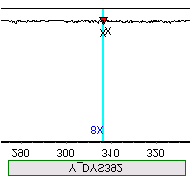
Null Allele: By definition, a microsatellite null allele is any allele at a microsatellite locus that consistently fails to amplify to detected levels via PCR. If the mutation at the primer binding region abolishes the ability of the primer to anneal, complete failure of the amplification of the allele will result. This phenomenon is known as a null allele or silent allele. A DYS392 null allele was observed in one sample (of a total of 238 samples) (Figure 6). In this case the Allele is called as (0).
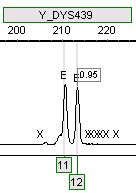
Duplicated Allele: The duplicated alleles 11, 12 were observed at DYS39 in one sample (of a total of 238 samples) (Figure 7). This gives the sample (and possibly Benghazi population) very high discriminative power when compared with other haplotypes. Further sequencing is necessary to study the reason for detecting duplicate alleles, such as mutations.
Conclusion
Benghazi population haplotype data regarding the highest allele frequencies when compared with other groups recorded on the YHRD website, the Benghazi population is similar to other Asian groups, such as Euro-Asian and East Asian. Hence, the shows genetic affinity to Asian and Middle Eastern rather than African and West North African groups. Furthermore, analysis of Fst genetic distances and pair- wise analysis of molecular variance (AMOVA) test carried out through the YHRD website revealed similar results, similarity of the Benghazi population with East North Africans (Egypt) and Middle Eastern populations (Israel), possibly due to their geographical proximity and recent influx of Egyptians into Benghazi (in the last two decades), as well as a geographically nearby European country, Grecce, possibly due to a past history of trade with North Africa (many of Benghazi Families bear cretan surnames).
Interestingly, the Benghazi population was significantly different to a population in Tripoli (Arab) which is geographically nearby and has genetic affinity with Tunisia (North Africa). Likewise, the Benghazi population was significantly different to a Fezzan population (Tuareg), in the south of Libya. On the other hand, the Benghazi population showed genetic affinity to another local Libyan population group, a Berber Tripoli population.
In this study, new alleles which are specific for Benghazi
population were identified, and are therefore highly discriminatory for Benghazi when compared with other population haplotypes. These were the duplicated alleles 27, 29 (usually only one allele is called at this location) for locus DYS389II.
References
-
As shown below in Figure 1 the map illustrates Afro- Asiatic populations (in red). We have investigated a Benghazi population considered to be the largest population within the Afro-Asiatic group regarding Y haplotypes investigations, as shown in Table 1. [INLINE_FIGURE:1:0] Figure 1: Map Showing Afro-Asiatic Population Group. Overall: 3809 Haplotypes in 40 Afro-Asiatic Populations (Recorded in YHRD) Colored in Red. [INLINE_TABLE:1:0] [INLINE_TABLE:2:0] Table 1: Haplotype Sampling of the Afro- Asiatic Metapopulation Group Recorded in YHRD. Table 1 shows a list of 15 of the 40 populations within the Afro-asiatic population group (which includes a total of 3809 haplotypes). These populations listed have genetic affinity (allele frequency) as identified from the YHRD and described below. As can be seen in the table, Benghazi population has the largest number of haplotypes amongst the 15 populations shown. As additional information, a further table is shown in Table 2 listing all of the metapopulation groups found on in the YHRD and respective numbers of haplotypes. [INLINE_TABLE:2:1] Table 2: Distribution of Y–Haplotypes Tested in Some Samples all Over the Earth Recorded in YHRD as Metapopulation. Comparison of the Afro-Asiatic Group (Including Benghazi Population) with all Metapopulation Groups Recorded in YHRD in Terms of Allele Frequencies The allele frequencies of 17 loci were compared for the metapopulation groups using the YHRD website (www.yhrd. org). The Benghazi population is included in the Afro-Asiatic group. The Afro-Asiatic group had similar allele frequencies to the Euroasian and Australian groups when considering all 17 loci. On the other hand, differences were seen when the Afro-Asiatic Group was compared with geographically distant populations (Native-American and Eskimos). [INLINE_FIGURE:2:0] Figure 2: An Example from YHRD.Org Showing Allele Frequencies Distribution for Locus DYS19 (the First Invented Locus) all Over Metapopulations (Benghazi Population Included within Afro-Asciatic Group). The Commonest Allele Frequency for Afro- Asciatic is Allele Number 14 (20%) (Same Allele Detected in this Study) and this Frequency is Similar to that of the Australian and Euroasian Groups but different to that of Other Group. An example of the comparison for one of these loci (DYS19) is shown in Figure 2. DYS19 was the first Y chromosomal locus explored [6]. As can be observe in Figure 2, allele 14 is the most common allele and observed in 7metapopulation groups, however, the frequency of this allele (approximately 20%) is similar for groups Eurasian, Australian Aboriginal and Afro-Asiatic (which includes the Benghazi population). Therefore these three populations have genetic affinity.
- Narcotics and Digital Forensics: Bridging Crimes in the Digital Age
- Ethics in Forensic Psychiatry: Principles, Dilemmas, and Human Rights
- Impact of Acute Stress on Attentional Orienting to Social Cues
- Head Injury and Intracranial Hemorrhage in Western Region of Libya
- A Forensic Study on Handedness: Examination of Handwriting Features in Right and Left Handed Writers
- Techniques for Latent Fingerprint Development Using Natural and Synthetic Powders: A Review