Mapping the Poweplex® Fusion STR Allele Frequency Distribution Among the Sri Lankan Population Based on Provinces in Sri Lanka for Forensic Purposes
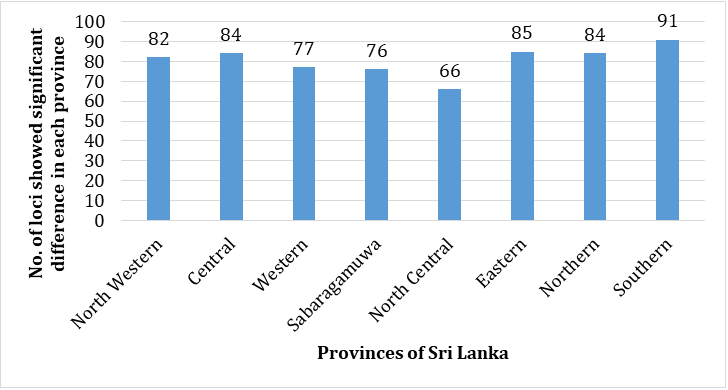
The DNA markers such as Short Tandem Repeats (STR) can be applied to assess the genetic diversity among the populations. A representative sample of 246 individuals was randomly selected from all nine provinces of Sri Lanka. Buccal swabs were collected from the participants to obtain genetic data from 22 loci. The purpose of this study was to determine the allele frequencies at each locus and compare them statistically between different provinces. The allele frequencies of each locus in one province were statistically evaluated separately with all the other eight provinces. For each province, the number of loci that differed significantly from the rest of the eight provinces was calculated. The southern, Eastern, Northern, and Central provinces showed a higher number of significantly different loci (91, 85, 84, and 84 respectively) among all other provinces. The ethnic barrier as well as the geographical barriers may cause the genetic isolation of the above provinces.
Introduction
The Short Tandem Repeats (STRs), also called microsatellite DNA, are a kind of genetic marker with repeat units of 2–6 base pairs and chosen for several applications in genetics such as individual identification, population characterization, and gene mapping. The popularity of STR (Short Tandem Repeats) in its applications is due to its hypervariability and ubiquity throughout the genome, and the loci up to 150,000 having certain polymorphic levels. The high mutation rate leads to the variability of these markers.
Therefore, a particular set of STR markers found in the genome could be used to discriminate the individuals and population structure, the relatedness between populations, and the association between genotypes and phenotypes, and understand the history of past migration [1].
The individuals from particular geographical regions could be characterized with certain autosomal STR loci kits. Moreover, the allelic distributions have the potential to differentiate among geographically close populations [2]. Therefore the population genetics differentiations between the regions could be illustrated based on the allele frequencies of each locus [3].
An allele frequency is the relative frequency of an allele at a particular locus in a population, expressed as a fraction or percentage. Currently, the frequencies of the powerflex fusion alleles are calculated for the whole Sri Lankan population considered as one unit. However, according to population genetic theories, there may be some significant patterns in sub-group levels of a population.
This is not studied yet for the sub-levels of the Sri Lankan population. Therefore, this research was planned to analyze whether there is a significant difference in powerflex® fusion allele distribution frequency among the sub-levels of the Sri Lankan population. The Sri Lankan population was categorized into sub-levels based on the area, which were the first administrative divisions, known as provinces; Southern, Northern, Eastern, Western, North Central, North Western, Uva, Sabaragamuwa, and Central [4, 5].
Justification of the Study
An allele frequency is the relative frequency of an allele at a particular locus in a population, expressed as a fraction or percentage. Currently, the frequencies of the powerflex fusion alleles are calculated for the whole Sri Lankan population considered as one unit. However, according to population genetic theories, there may be some significant patterns in sub group levels of a population.
This is not studied yet for the sub-levels of the Sri Lankan population. Therefore, in this research, it was planned to analyze whether there is a significant difference in powerflex fusion allele distribution frequency among the sub-levels of the Sri Lankan population. The Sri Lankan population was categorized into sub-levels based on the area, which were the first administrative divisions, known as provinces; Southern, Northern, Eastern, Western, North Central, North Western, Uva, Sabaragamuwa, and Central.
In a population, allele frequencies are a reflection of genetic diversity. According to the mating practices (marriage between relations or people in the same area) some alleles may be dominant in some areas. These are considered sub- level allele diversity. In forensic analysis these sub-level differences can be used as a tool for the support of further investigations in order to identify the perpetrator of evidence have come from which part of Sri Lanka, especially when the perpetrator is unknown.
Objectives of the Study
- To map the powerflex fusion STR allele distribution frequency among the provinces in Sri Lanka.
- Statistically compare the STR allele distribution frequency between the all nine provinces of Sri Lanka.
Literature Review
According to a research conducted in Mesan and Basra provinces in southern Iraq, the allele frequency data of 21 autosomal short tandem repeat loci in 158 different alleles were observed across the population. It revealed that the Penta E locus showed the lowest allele frequencies at allele 15 while the highest allele frequencies occurred in the loci D19S433 allele 11. The largest number of different alleles was seen in D6S1043 and D18S51 loci. The locus with the highest heterozygosity was D2S1338, while locus CSF1PO has the lowest heterozygosity, the heterozygosity of the 21 STR loci ranged from 57.7% to 88.5% (mean value 69.6%). Power of discrimination values for all tested loci were 71%, 72%, 74% and 77% for the CSF1PO, D3S1357, D8S1179 and D5S818 loci, respectively and 80%, 81% and 88% for the vWA, THO1 and D16S539 loci respectively, and ranged from 90% to 97%, for the rest of the loci [6].
In a research carried out in Chinese Kazak ethnic group, the allelic frequencies and forensic statistical parameters of the 19 autosomal STR loci in a Kazak ethnic group were calculated, and its genetic relationships with reference populations were assessed in order to understand population structure better and enrich population genetic data for forensic practice in Chinese Kazak ethnic group. There were 226 identified alleles with the corresponding allelic frequencies ranging from 0.0008 to 0.5295 in the 628 unrelated healthy Kazak individuals in Xinjiang Uygur Autonomous Region. In this research they revealed that the cumulative power of discrimination and the combined probability of exclusion of all the 19 autosomal STRs were 0.999 999 999 999 999 999 999 997 162 and 0.999 999 994 484, respectively. The population genetic results showed that these 19 autosomal STR loci were characterized by high genetic diversities in the Kazak group. Furthermore, the studied Kazak group had close genetic relationships with the Uyghur group and the Uzbek group. The present results may facilitate understanding the genetic background of the Chinese Xinjiang Kazak group [3].
In a comparison study, the distribution of allele frequencies of 15 short tandem repeat (STR) loci in a representative sample of the Croatian population was compared with those obtained from geographically neighboring European populations. The significant difference in allele frequencies was recorded only between the Croatian and Slovenian populations for vWA locus. There was no significant deviation from Hardy-Weinberg equilibrium recorded for all the observed loci [7].
According to a study conducted among a Chinese population, the genetic polymorphisms of 22 autosomal short tandem repeat (STR) loci were analyzed in 496
unrelated Chinese Xinjiang Hui individuals. There were 246 observed alleles with the allele frequencies ranging from 0.0010 to 0.3609. All polymorphic information content values were higher than 0.7. Based on analysis of molecular variance method, genetic differentiation analysis between the Xinjiang Hui and other reported groups were conducted at these 22 loci, the results indicated that there were no significant differences in statistics between Hui group and Northern Han group (including Han groups from Hebei, Henan, Shaanxi provinces), and significant deviations with Southern Han group (including those from Guangdong, Guangxi provinces) at 7 loci, and Uygur group at 10 loci [8].
In another study, the allelic distribution of 16 autosomal short tandem repeats (STRs) performed on unrelated individuals from seven different Peruvian cities, three highland Andean cities and four coastal ones were assessed. The loci investigated were F13A01, FESFPS, vWA, CSF1PO, TPOX, TH01, D16S539, D7S820, D13S317, D5S818, D19S253, F13B, D21S11, LPL and D8S1179 y D3S1358. The allele frequency, statistical parameters, Hardy–Weinberg equilibrium and population pair comparison across all loci were determined [9].
Materials and Methods
Sample Information
Research Design, Sampling and Sample Size: A descriptive, cross-sectional study was carried out to obtain the STR profiles of the individuals living in nine provinces of Sri Lanka during 2016 to 2017.
The study population was selected from the all nine provinces of Sri Lanka (Southern, Northern, Eastern, Western, North central, North western, Uva, Sabaragamuwa and central) by random sampling technique.
Sri Lanka is a country of multiple ethnicities, but the most prominent are the Sinhalese, the Sri Lankan Tamils and the Sri Lankan Muslims. The Sinhalese make up around 75% of the total population and are concentrated in the central and southwestern parts of the country. The Tamils make up around 11.9% of the total population and are thus the largest minority present in the country [7].
According to the Census 2012, total population of the country is reported as 20,359,439. Sri Lanka has divided into 9 provinces for the administrative purposes. Among the 9 provinces, Western province reported the largest share of population (28.7%) followed by Central province (12.6%) and Southern province (12.2%). This indicates that more than half of the island’s population is distributed in these three provinces even though the land area of these three provinces consists of only 23 percent of the total land area of the country. Northern province reported the lowest population share of 5.2 percent followed by 6.2 percent of share in each of North-Central and Uva provinces [7].
According to the Census 2012, female population is higher than male population in the country. Out of the total population, 48.4 percent are males and 51.6 percent are females. Sex ratio is reported as 94, reflecting there are 94 males for every 100 females in the country. The sex ratio was recorded in provincial level, the highest and the lowest sex ratios were reported from North Central (96%) province and the Central province (92%) respectively [7].
The sample size was generated using the data of the Department of Census and Statistics which was successfully conducted the 14th consecutive Population and Housing Census in Sri Lanka in 2012 with considering the data of population ratio, sex ratio and ethnic ratio in each province. The calculated sample size was 247.
The three buccal swabs were taken from each participant and kept in an envelope. Then those envelopes were kept in the refrigerator under the temperature of -40C until the analysis.
Ethical Consideration
Ethical clearance for the study was obtained from the Ethical Review Committee, Faculty of Medicine, Colombo. After explaining the objectives and outcomes to participants, the written consent was obtained.
DNA Analysis
Buccal swabs were subjected to extraction using a QIAGEN kit DNA quantification and DNA analysis were conducted on bone and reference samples. DNA quantification was performed with Quantifiler™ Human DNA Quantification Kit (Applied Biosystems, USA) according to manufacturer’s protocol. A total of fifteen STR markers, along with a marker for gender identification, were investigated for human identification using the PowerPlex® Fusion PCR Amplification Kit from Promega Corporation, USA. Separation of amplified PCR products was carried out on Genetic Analyser 3500 (Applied Biosystems, Life Technologies, Foster City, CA, USA) and analyzed with GeneMapper ID, version 3.2, from Applied Biosystems using standard procedures.
Statistical Analysis
Data were analyzed using SPSS 21.0 statistical package (SPSS, Inc., Chicago, IL, USA). 22 loci of each profile were analyzed. The loci were analyzed independently. The allele frequencies of each locus were calculated. The allele frequencies of each locus between the nine provinces were compared with one-way-ANOVA. Statistical significance was assigned for p values less than 0.05
Results
246 people from all provinces (Southern, Northern, Eastern, Western, North central, North western, Uva, Sabaragamuwa and central) of Sri Lanka were recruited for the study. Table 1 to Table 22 show the percentages of allele frequencies for each locus (D3S1358, D1S1656, D2S441, D10S1248, D13S317, Penta E, D16S539, D18S51, D2S1338, CSF180, PENTA D, VWA, D21S11, D7S820, D5S818, TPOX D8S1179 D12S391 D19S433 FGA D22S1045 and D22S1045) among all 9 provinces.
| Province Allele | North Western | Central | Western | Sabaragamuwa | North Central | Eastern | Northern | Uva | Southern |
|---|---|---|---|---|---|---|---|---|---|
| 13 | 0 | 0 | 0 | 0 | 0 | 0 | 0 | 0 | 1.3 |
| 14 | 0 | 0.9 | 7.4 | 4.1 | 3.1 | 1.8 | 2.4 | 0 | 2.6 |
| 15 | 33.3 | 34.2 | 25.9 | 26.5 | 21.9 | 21.4 | 38.1 | 40 | 38.2 |
| 16 | 25 | 34.2 | 22.2 | 22.4 | 40.6 | 28.6 | 26.2 | 10 | 22.4 |
| 17 | 30 | 21.1 | 22.2 | 36.7 | 18.8 | 26.8 | 26.2 | 50 | 22.4 |
| 18 | 10 | 9.6 | 18.5 | 8.2 | 15.6 | 14.3 | 7.1 | 0 | 13.2 |
| 19 | 1.7 | 0 | 3.7 | 2 | 0 | 5.4 | 0 | 0 | 0 |
| 20 | 0 | 0 | 0 | 0 | 0 | 1.8 | 0 | 0 | 0 |
Table 1: Percentages of All Allele Frequencies of Locus D3S1358.
| Province Allele | North Western | Central | Western | Sabaragamuwa | North Central | Eastern | Northern | Uva | Southern |
|---|---|---|---|---|---|---|---|---|---|
| 8 | 3.3 | 4.4 | 0 | 0 | 0 | 3.5 | 2.3 | 0 | 3.9 |
| 9 | 0 | 0 | 0 | 0 | 0 | 0 | 2.3 | 0 | 0 |
| 10 | 0 | 0 | 0 | 2 | 0 | 0 | 2.3 | 20 | 1.3 |
| 11 | 18.3 | 10.5 | 18.5 | 16.3 | 43.8 | 23.2 | 30.9 | 10 | 21 |
| 12 | 6.6 | 8.8 | 3.7 | 8.2 | 0 | 10.7 | 4.7 | 20 | 9.2 |
| 13 | 21.6 | 15.8 | 18.5 | 10.2 | 0 | 12.5 | 14.2 | 0 | 7.8 |
| 14 | 10 | 11.4 | 7.4 | 16.3 | 6.3 | 19.6 | 7.1 | 10 | 14.4 |
| 15 | 15 | 16.7 | 25.9 | 8.2 | 15.6 | 1.7 | 19 | 0 | 7.8 |
| 15.3 | 1.6 | 1.8 | 3.7 | 0 | 0 | 1.7 | 0 | 0 | 1.3 |
| 16 | 10 | 14 | 7.4 | 14.3 | 9.4 | 12.5 | 7.1 | 20 | 11.8 |
| 16.3 | 3.3 | 1.7 | 0 | 2 | 0 | 0 | 4.7 | 0 | 1.3 |
| 17 | 0 | 10.5 | 7.4 | 16.3 | 18.8 | 5.3 | 2.3 | 20 | 11.84 |
| 17.3 | 1.6 | 1.7 | 3.7 | 4.1 | 0 | 5.3 | 2.3 | 0 | 2.6 |
| 18 | 3.3 | 0 | 0 | 0 | 0 | 1.7 | 0 | 0 | 2.6 |
| 18.3 | 3.3 | 0.8 | 3.7 | 2 | 6.3 | 1.7 | 0 | 0 | 2.6 |
| 19 | 1.7 | 0 | 0 | 0 | 0 | 0 | 0 | 0 | 0 |
| 19.3 | 0 | 0.8 | 0 | 0 | 0 | 0 | 0 | 0 | 0 |
| 20.3 | 0 | 0.8 | 0 | 0 | 0 | 0 | 0 | 0 | 0 |
| 9 | 0 | 0 | 0 | 2 | 0 | 0 | 0 | 0 | 0 |
| 10 | 31.6 | 36.8 | 37 | 16.3 | 53.1 | 17.9 | 33.3 | 50 | 26.3 |
| 11 | 40 | 33.3 | 29.6 | 44.9 | 34.3 | 48.2 | 31 | 10 | 42.1 |
| 11.3 | 3.3 | 7.8 | 7.4 | 4 | 0 | 0 | 7.1 | 20 | 5.3 |
| 12 | 3.3 | 7.8 | 3.7 | 10.2 | 0 | 7.1 | 4.8 | 0 | 11.8 |
| 12.3 | 5 | 0 | 0 | 0 | 0 | 1.8 | 2.4 | 0 | 0 |
| 13 | 3.3 | 0.8 | 0 | 0 | 0 | 1.8 | 9.5 | 0 | 0 |
| 14 | 10 | 11.4 | 14.8 | 18.3 | 9.4 | 16.1 | 9.5 | 20 | 11.8 |
| 15 | 1.6 | 0.8 | 7.4 | 4 | 0 | 5.4 | 2.4 | 0 | 2.6 |
| 16 | 1.6 | 0 | 0 | 0 | 3.1 | 1.8 | 0 | 0 | 0 |
Table 2: Percentages of All Allele Frequencies of Locus D1S1656.
| Province Allele | North Western | Central | Western | Sabaragamuwa | North Central | Eastern | Northern | Uva | Southern |
|---|---|---|---|---|---|---|---|---|---|
| 11 | 0 | 0 | 0 | 0 | 6.3 | 0 | 0 | 0 | 0 |
| 12 | 1.6 | 1.7 | 0 | 0 | 0 | 3.6 | 0 | 0 | 2.6 |
| 13 | 3.3 | 10.5 | 7.4 | 6.1 | 0 | 5.4 | 23.8 | 30 | 14.5 |
| 14 | 18.3 | 25.4 | 25.9 | 30.6 | 46.9 | 23.2 | 26.2 | 20 | 30.3 |
| 15 | 33.3 | 22.8 | 22.2 | 34.7 | 34.4 | 26.8 | 23.8 | 40 | 23.7 |
| 16 | 35 | 27.1 | 33.3 | 26.5 | 9.4 | 32.1 | 21.4 | 0 | 18.4 |
| 17 | 8.3 | 9.6 | 11.1 | 2 | 3 | 7.1 | 4.8 | 10 | 10.5 |
| 18 | 0 | 2.6 | 0 | 0 | 0 | 1.8 | 0 | 0 | 0 |
Table 3: Percentages of All Allele Frequencies of Locus D10S1248.
| Province Allele | North Western | Central | Western | Sabaragamuwa | North Central | Eastern | Northern | Uva | Southern |
|---|---|---|---|---|---|---|---|---|---|
| 7 | 1.7 | 1.8 | 0 | 0 | 0 | 3.6 | 2.4 | 0 | 2.6 |
| 8 | 11.7 | 23.7 | 7.4 | 22.4 | 18.8 | 26.8 | 14.3 | 10 | 14.5 |
| 9 | 11.7 | 12.3 | 7.4 | 12.2 | 12.5 | 8.9 | 14.3 | 10 | 0 |
| 10 | 11.7 | 7 | 11.1 | 6.1 | 25 | 10.7 | 7.1 | 0 | 0 |
| 11 | 26.7 | 27.2 | 37 | 22.4 | 18.8 | 21.4 | 23.8 | 20 | 30.3 |
| 12 | 16.7 | 14.9 | 29.6 | 32.7 | 25 | 14.3 | 31 | 40 | 23.7 |
| 13 | 13.3 | 7.9 | 7.4 | 4.1 | 0 | 8.9 | 2.4 | 20 | 18.4 |
| 14 | 6.7 | 5.3 | 0 | 0 | 0 | 5.4 | 4.8 | 0 | 10.5 |
| 5 | 5 | 7.9 | 3.7 | 4.1 | 0 | 3.6 | 9.5 | 0 | 10.5 |
| 7 | 10 | 2.6 | 0 | 2 | 6.3 | 8.9 | 4.8 | 30 | 3.9 |
| 8 | 0 | 0.9 | 0 | 0 | 0 | 0 | 2.4 | 0 | 1.3 |
| 9 | 0 | 0 | 3.7 | 2 | 0 | 0 | 0 | 0 | 1.3 |
| 10 | 5 | 1.8 | 0 | 4.1 | 0 | 5.4 | 0 | 0 | 2.6 |
| 11 | 15 | 18.4 | 14.8 | 18.4 | 21.9 | 12.5 | 14.3 | 0 | 10.5 |
| 12 | 10 | 6.1 | 14.8 | 8.2 | 3.1 | 10.7 | 9.5 | 20 | 13.2 |
| 13 | 6.7 | 7.9 | 3.7 | 10.2 | 12.5 | 7.1 | 2.4 | 10 | 3.9 |
| 14 | 8.3 | 5.3 | 7.4 | 10.2 | 3.1 | 3.6 | 11.9 | 10 | 7.9 |
| 15 | 10 | 8.8 | 18.5 | 10.2 | 9.4 | 3.6 | 0 | 20 | 14.5 |
| 16 | 13.3 | 13.2 | 11.1 | 12.2 | 15.6 | 17.9 | 21.4 | 0 | 18.4 |
| 17 | 6.7 | 14 | 7.4 | 2 | 21.9 | 16.1 | 16.7 | 0 | 5.3 |
| 18 | 5 | 3.5 | 7.4 | 10.2 | 0 | 5.4 | 7.1 | 10 | 3.9 |
| 19 | 3.3 | 2.6 | 3.7 | 2 | 6.3 | 3.6 | 1.3 | ||
| 20 | 0 | 1.8 | 0 | 2 | 0 | 1.8 | 0 | 0 | 1.3 |
| 21 | 0 | 1.8 | 0 | 2 | 0 | 0 | 0 | 0 | 0 |
| 22 | 0 | 1.8 | 3.7 | 0 | 0 | 0 | 0 | 0 | 0 |
| 23 | 1.7 | 0.9 | 0 | 0 | 0 | 0 | 0 | 0 | 0 |
Table 4: Percentages of All Allele Frequencies of Locus D13S317.
| Province Allele | North Western | Central | Western | Sabaragamuwa | North Central | Eastern | Northern | Uva | Southern |
|---|---|---|---|---|---|---|---|---|---|
| 8 | 10 | 6.1 | 11.1 | 6.1 | 6.3 | 8.9 | 4.8 | 10 | 5.3 |
| 9 | 21.7 | 14.9 | 7.4 | 12.2 | 15.6 | 23.2 | 28.6 | 30 | 14.5 |
| 10 | 3.3 | 10.5 | 18.5 | 4.1 | 12.5 | 1.8 | 9.5 | 0 | 7.9 |
| 11 | 36.7 | 34.2 | 11.1 | 24.5 | 43.8 | 37.5 | 33.3 | 10 | 31.6 |
| 12 | 16.7 | 22.8 | 29.6 | 32.7 | 18.8 | 14.3 | 11.9 | 30 | 26.3 |
| 13 | 11.7 | 10.5 | 14.8 | 16.3 | 3.1 | 12.5 | 9.5 | 20 | 14.5 |
| 14 | 0 | 0.9 | 3.7 | 4.1 | 0 | 1.8 | 2.4 | 0 | 0 |
| 15 | 0 | 0 | 3.7 | 0 | 0 | 0 | 0 | 0 | 0 |
Table 5: Percentages of All Allele Frequencies of Locus D16S539.
| Province Allele | North Western | Central | Western | Sabaragamuwa | North Central | Eastern | Northern | Uva | Southern |
|---|---|---|---|---|---|---|---|---|---|
| 9 | 1.7 | 0 | 0 | 0 | 0 | 0 | 0 | 0 | 0 |
| 10 | 0 | 0.9 | 3.7 | 0 | 3.1 | 1.8 | 0 | 0 | 0 |
| 11 | 0 | 0.9 | 0 | 0 | 0 | 1.8 | 7.1 | 0 | 3.9 |
| 12 | 3.3 | 6.1 | 7.4 | 10.2 | 3.1 | 16.1 | 4.8 | 20 | 5.3 |
| 13 | 11.7 | 15.8 | 14.8 | 8.2 | 6.3 | 21.4 | 9.5 | 10 | 9.2 |
| 14 | 31.7 | 36 | 22.2 | 24.5 | 46.9 | 25 | 42.9 | 30 | 2.8 |
| 15 | 20 | 18.4 | 18.5 | 24.5 | 12.5 | 16.1 | 4.8 | 10 | 22 |
| 16 | 10 | 9.6 | 22.2 | 16.3 | 12.5 | 5.4 | 9.5 | 20 | 16 |
| 17 | 15 | 5.3 | 0 | 8.2 | 3.1 | 1.8 | 4.8 | 10 | 7.9 |
| 18 | 0 | 0.9 | 3.7 | 4.1 | 0 | 5.4 | 2.4 | 0 | 1.3 |
| 19 | 3.3 | 5.3 | 0 | 2 | 3.1 | 1.8 | 7.1 | 0 | 2.6 |
| 20 | 0 | 0.9 | 7.4 | 0 | 6.3 | 3.6 | 0 | 0 | 1.3 |
| 21 | 1.7 | 0 | 0 | 0 | 0 | 0 | 0 | 26 | |
| 22 | 1.7 | 0 | 0 | 2 | 3.1 | 0 | 0 | 0 | 0 |
Table 6: Percentages of All Allele Frequencies of Locus D18S51.
| Province Allele | North Western | Central | Western | Sabaragamuwa | North Central | Eastern | Northern | Uva | Southern |
|---|---|---|---|---|---|---|---|---|---|
| 15 | 0 | 0 | 0 | 0 | 0 | 1.8 | 0 | 0 | 1.3 |
| 16 | 0 | 2.6 | 0 | 0 | 0 | 0 | 0 | 10 | 0 |
| 17 | 6.7 | 2.6 | 3.7 | 2 | 9.4 | 7.1 | 2.4 | 20 | 0 |
| 18 | 13.3 | 15.8 | 18.5 | 20.4 | 15.6 | 12.5 | 16.7 | 10 | 22.3 |
| 19 | 18.3 | 2.6 | 14.8 | 24.5 | 3.1 | 21.4 | 23.8 | 20 | 19.7 |
| 20 | 6.7 | 11.4 | 14.8 | 8.2 | 18.8 | 5.4 | 9.5 | 0 | 14.7 |
| 21 | 5 | 5.3 | 7.4 | 2 | 3.1 | 3.6 | 2.4 | 0 | 3.9 |
| 22 | 6.7 | 7.9 | 7.4 | 2 | 3.1 | 10.7 | 14.3 | 0 | 6.5 |
| 23 | 21.7 | 27.2 | 18.5 | 18.4 | 15.6 | 17.9 | 21.4 | 20 | 11.8 |
| 24 | 13.3 | 9.6 | 3.7 | 16.3 | 9.4 | 8.9 | 2.4 | 0 | 11.8 |
| 25 | 6.7 | 11.4 | 7.4 | 6.1 | 21.9 | 7.1 | 4.8 | 20 | 6.5 |
| 26 | 1.7 | 2.6 | 0 | 0 | 0 | 3.6 | 0 | 0 | 1.3 |
| 27 | 0 | 0 | 3.7 | 0 | 0 | 0 | 2.4 | 0 | 0 |
| 28 | 0 | 0.9 | 0 | 0 | 0 | 0 | 0 | 0 | 0 |
Table 7: Percentages of All Allele Frequencies of Locus D2S1338.
| Province Allele | North Western | Central | Western | Sabaragamuwa | North Central | Eastern | Northern | Uva | Southern |
|---|---|---|---|---|---|---|---|---|---|
| 9 | 1.7 | 1.8 | 3.7 | 0 | 0 | 0 | 0 | 0 | 5.3 |
| 10 | 26.7 | 15.8 | 22.2 | 14.3 | 9.4 | 17.9 | 26.2 | 10 | 13.2 |
| 11 | 21.7 | 37.7 | 29.6 | 30.6 | 40.6 | 25 | 16.7 | 40 | 30.3 |
| 12 | 35 | 36.8 | 33.3 | 36.7 | 46.9 | 51.8 | 47.6 | 50 | 46.1 |
| 13 | 10 | 5.3 | 7.4 | 16.3 | 3.1 | 5.4 | 9.5 | 0.0 | 3.9 |
| 14 | 1.7 | 0 | 3.7 | 2 | 0 | 0 | 0 | 0 | 0 |
| 15 | 0 | 0.9 | 0 | 0 | 0 | 0 | 0 | 0 | 0 |
| 6 | 0 | 0 | 0 | 0 | 0 | 0 | 2.4 | 0 | 0 |
| 7 | 3.3 | 1.8 | 0 | 2 | 0 | 0 | 0 | 0 | 1.3 |
| 8 | 3.3 | 1.8 | 0 | 2 | 0 | 0 | 0 | 0 | 1.3 |
| 9 | 36.7 | 25.4 | 33.3 | 24.5 | 15.6 | 17.9 | 26.2 | 50 | 22.4 |
| 10 | 10 | 22.8 | 18.5 | 12.2 | 34.4 | 17.9 | 28.6 | 30 | 14.5 |
| 11 | 25 | 21.1 | 11.1 | 32.7 | 21.9 | 41.1 | 28.6 | 10 | 26.3 |
| 12 | 5 | 19.3 | 11.1 | 12.2 | 12.5 | 8.9 | 4.8 | 10 | 13.2 |
| 13 | 6.7 | 5.3 | 7.4 | 8.2 | 6.3 | 12.5 | 7.1 | 0 | 17.1 |
| 14 | 3.3 | 2.6 | 7.4 | 4.1 | 0 | 0 | 2.4 | 0 | 7.9 |
| 15 | 6.7 | 0 | 11.1 | 2 | 9.4 | 1.8 | 0 | 0 | 0 |
| 16 | 0 | 0 | 0 | 0 | 0 | 0 | 0 | 0 | 1.3 |
Table 8: Percentages of All Allele Frequencies of Locus CSF180.
| Province Allele | North Western | Central | Western | Sabaragamuwa | North Central | Eastern | Northern | Uva | Southern |
|---|---|---|---|---|---|---|---|---|---|
| 6 | 26.7 | 24.6 | 3.7 | 8.2 | 28.1 | 30.4 | 21.4 | 20 | 27.63 |
| 7 | 18.3 | 7 | 14.8 | 8.2 | 18.8 | 12.5 | 11.9 | 10 | 13.16 |
| 8 | 10 | 18.4 | 14.8 | 12.2 | 28.1 | 12.5 | 11.9 | 30 | 23.68 |
| 9 | 36.7 | 37.7 | 33.3 | 44.9 | 12.5 | 37.5 | 38.1 | 30 | 23.68 |
| 9.3 | 8.3 | 10.5 | 33.3 | 20.4 | 12.5 | 5.4 | 11.9 | 10 | 9.21 |
| 10 | 0 | 0.9 | 0 | 6.1 | 0 | 1.8 | 4.8 | 0 | 2.63 |
| 10.3 | 0 | 0.9 | 0 | 0 | 0 | 0 | 0 | 0 | 0 |
Table 9: Percentages of All Allele Frequencies of Locus THO 1.
| North Western | Central | Western | Sabaragamuwa | North Central | Eastern | Northern | Uva | Southern | |
|---|---|---|---|---|---|---|---|---|---|
| 10 | 0 | 0 | 0 | 0 | 0 | 0 | 0 | 10 | 0 |
| 13 | 1.7 | 0.9 | 0 | 0 | 0 | 0 | 2.4 | 0 | 0 |
| 14 | 8.3 | 15.8 | 14.8 | 12.2 | 21.9 | 12.5 | 11.9 | 20 | 11.8 |
| 15 | 10 | 11.4 | 3.7 | 4.1 | 6.3 | 8.9 | 9.5 | 10 | 9.2 |
| 16 | 21.7 | 23.7 | 11.1 | 28.6 | 31.3 | 16.1 | 11.9 | 20 | 18.4 |
| 17 | 26.7 | 20.2 | 44.4 | 28.6 | 12.5 | 17.9 | 35.7 | 20 | 32.9 |
| 18 | 23.3 | 16.7 | 14.8 | 14.3 | 21.9 | 37.5 | 21.4 | 10 | 18.4 |
| 19 | 8.3 | 10.5 | 3.7 | 10.2 | 6.3 | 7.1 | 7.1 | 10 | 9.2 |
| 20 | 0 | 0.9 | 7.4 | 2 | 0 | 0 | 0 | 0 | 0 |
| Province Allele | North Western | Central | Western | Sabaragamuwa | North Central | Eastern | Northern | Uva | Southern |
| 27 | 13.3 | 1.8 | 0 | 0 | 3.1 | 1.8 | 2.4 | 0 | 0 |
| 28 | 15 | 7 | 11.1 | 10.2 | 25 | 12.5 | 16.7 | 10 | 7.9 |
| 28.2 | 5 | 0.9 | 0 | 0 | 0 | 0 | 0 | 0 | 0 |
| 29 | 13.3 | 16.7 | 22.2 | 22.4 | 25 | 16.1 | 19 | 30 | 23.7 |
| 29.2 | 3.3 | 1.8 | 0 | 0 | 0 | 1.8 | 0 | 0 | 0 |
| 29.3 | 0 | 0 | 0 | 2 | 0 | 0 | 0 | 0 | 1.3 |
| 30 | 5 | 21.9 | 22.2 | 16.3 | 9.4 | 10.7 | 14.3 | 40 | 15.8 |
| 30.2 | 15 | 5.3 | 0 | 0 | 0 | 1.8 | 4.8 | 0 | 6.6 |
| 31 | 1.7 | 2.6 | 7.4 | 12.2 | 6.3 | 3.6 | 4.8 | 10 | 2.6 |
| 31.2 | 16.7 | 12.3 | 11.1 | 8.2 | 12.5 | 8.9 | 19 | 0 | 13.2 |
| 32 | 8.3 | 0.9 | 0 | 0 | 0 | 1.8 | 0 | 0 | 1.3 |
| 32.2 | 3.3 | 21.9 | 22.2 | 16.3 | 15.6 | 25 | 16.7 | 10 | 11.8 |
| 33.2 | 0 | 7 | 3.7 | 8.2 | 3.1 | 14.3 | 2.4 | 0 | 13.2 |
| 34.1 | 0 | 0 | 0 | 2 | 0 | 0 | 0 | 0 | 0 |
| 34.2 | 0 | 0 | 0 | 0 | 0 | 1.8 | 0 | 0 | 2.6 |
| 35.2 | 0 | 0 | 0 | 2 | 0 | 0 | 0 | 0 | 0 |
Table 10: Percentages of All Allele Frequencies of Locus vWA.
| North Western | Central | Western | Sabaragamuwa | North Central | Eastern | Northern | Uva | Southern | |
|---|---|---|---|---|---|---|---|---|---|
| 7 | 3.3 | 3.5 | 3.7 | 2 | 0 | 1.8 | 11.9 | 20 | 2.6 |
| 8 | 18.3 | 23.7 | 25.9 | 24.5 | 34.4 | 17.9 | 31 | 10 | 27.6 |
| 8.1 | 0 | 0 | 3.7 | 0 | 0 | 0 | 0 | 0 | 1.3 |
| 9 | 1.7 | 3.5 | 7.4 | 6.1 | 18.8 | 1.8 | 2.4 | 0 | 5.3 |
| 10 | 26.7 | 25.4 | 22.2 | 18.4 | 18.8 | 28.6 | 16.7 | 20 | 21.1 |
| 11 | 26.7 | 21.1 | 25.9 | 26.5 | 3.1 | 25 | 16.7 | 30 | 9.2 |
| 12 | 20 | 21.1 | 11.1 | 20.4 | 18.8 | 19.6 | 16.7 | 20 | 15.8 |
| 13 | 3.3 | 1.8 | 0 | 2 | 0 | 5.4 | 4.8 | 0 | 3.9 |
Table 11: Percentages of All Allele Frequencies of Locus D7S820.
| Province Allele | North Western | Central | Western | Sabaragamuwa | North Central | Eastern | Northern | Uva | Southern |
|---|---|---|---|---|---|---|---|---|---|
| 7 | 0 | 0 | 0 | 0 | 0 | 0 | 2.4 | 0 | 0 |
| 9 | 1.7 | 6.1 | 7.4 | 4.1 | 15.6 | 1.8 | 2.4 | 0 | 6.6 |
| 10 | 11.7 | 8.8 | 7.4 | 10.2 | 18.8 | 8.9 | 7.1 | 20 | 11.8 |
| 11 | 36.7 | 36 | 33.3 | 38.8 | 15.6 | 33.9 | 52.4 | 60 | 14.5 |
| 12 | 31.7 | 28.1 | 22.2 | 28.6 | 31.3 | 26.8 | 28.6 | 10 | 27.6 |
| 13 | 16.7 | 21.1 | 22.2 | 18.4 | 12.5 | 25 | 7.1 | 10 | 19.7 |
| 14 | 0 | 0 | 7.4 | 0 | 6.3 | 0 | 0 | 0 | 1.3 |
| 15 | 1.7 | 0 | 0 | 0 | 0 | 0 | 0 | 0 | 0 |
| 8 | 28.3 | 24.6 | 37 | 22.4 | 34.4 | 26.8 | 31 | 0 | 0 |
| 9 | 15 | 16.7 | 7.4 | 10.2 | 15.6 | 26.8 | 19 | 50 | 6.6 |
| 10 | 8.3 | 11.4 | 7.4 | 6.1 | 6.3 | 5.4 | 7.1 | 30 | 11.8 |
| 11 | 45 | 43 | 48.1 | 57.1 | 43.8 | 30.4 | 35.7 | 10 | 14.5 |
| 12 | 3.3 | 2.6 | 2 | 0 | 5.4 | 7.1 | 10 | 27.6 | |
| 13 | 0 | 1.8 | 0 | 0 | 0 | 0 | 0 | 0 | 1 |
| 14 | 0 | 0 | 0 | 2 | 0 | 1.8 | 0 | 0 | 0 |
Table 12: Percentages of All Allele Frequencies of Locus D5S818.
| Province Allele | North Western | Central | Western | Sabaragamuwa | North Central | Eastern | Northern | Uva | Southern |
|---|---|---|---|---|---|---|---|---|---|
| 9 | 1.7 | 0 | 7.4 | 0 | 0 | 0 | 0 | 0 | 0 |
| 10 | 18.3 | 17.5 | 22.2 | 20.4 | 15.6 | 14.3 | 16.7 | 20 | 21.1 |
| 11 | 6.7 | 9.6 | 7.4 | 8.2 | 9.4 | 10.7 | 4.8 | 0 | 3.9 |
| 12 | 8.3 | 3.5 | 11.1 | 8.2 | 6.3 | 1.8 | 16.7 | 40 | 6.6 |
| 13 | 20 | 13.2 | 11.1 | 8.2 | 15.6 | 21.4 | 16.7 | 10 | 11.8 |
| 14 | 20 | 18.4 | 14.8 | 24.5 | 15.6 | 28.6 | 16.7 | 30 | 11.8 |
| 15 | 18.3 | 19.3 | 22.2 | 16.3 | 21.9 | 10.7 | 14.3 | 0 | 30.3 |
| 16 | 6.7 | 11.4 | 3.7 | 6.1 | 15.6 | 10.7 | 11.9 | 0 | 10.5 |
| 17 | 0 | 3.5 | 0 | 6.1 | 0 | 1.8 | 2.4 | 0 | 3.9 |
Table 13: Percentages of All Allele Frequencies of Locus D8S1179.
| Province Allele | North Western | Central | Western | Sabaragamuwa | North Central | Eastern | Northern | Uva | Southern |
|---|---|---|---|---|---|---|---|---|---|
| 16 | 1.7 | 0.9 | 0 | 0 | 0 | 0 | 4.8 | 0 | 0 |
| 17 | 10 | 11.4 | 3.7 | 10.2 | 31.3 | 17.9 | 14.3 | 10 | 1.3 |
| 17.3 | 0 | 0 | 0 | 0 | 0 | 0 | 0 | 0 | 1.3 |
| 18 | 36.7 | 27.2 | 33.3 | 34.7 | 18.8 | 23.2 | 19 | 30 | 34.2 |
| 18.3 | 0 | 0.9 | 0 | 0 | 0 | 0 | 0 | 0 | 0 |
| 19 | 10 | 16.7 | 18.5 | 12.2 | 9.4 | 8.9 | 16.7 | 10 | 18.4 |
| 19.3 | 0 | 0 | 0 | 0 | 0 | 1.8 | 0 | 0 | 0 |
| 20 | 11.7 | 8.8 | 7.4 | 8.2 | 15.6 | 12.5 | 7.1 | 20 | 5.3 |
| 21 | 6.7 | 7.9 | 18.5 | 8.2 | 6.3 | 8.9 | 7.1 | 20 | 7.9 |
| 22 | 8.3 | 7.9 | 7.4 | 10.2 | 18.8 | 8.9 | 16.7 | 10 | 6.6 |
| 23 | 11.7 | 11.4 | 7.4 | 10.2 | 0 | 10.7 | 4.8 | 0 | 3.9 |
| 24 | 1.7 | 2.6 | 3.7 | 0 | 0 | 3.6 | 2.4 | 0 | 2.6 |
| 25 | 0 | 0.9 | 0 | 0 | 0 | 0 | 7.1 | 0 | 5.3 |
| 11 | 1.7 | 0 | 0 | 0 | 0 | 0 | 0 | 0 | 2.6 |
| 12 | 5 | 8.8 | 3.7 | 6.1 | 9.4 | 8.9 | 14.3 | 0 | 5.3 |
| 12.2 | 1.7 | 0.9 | 0 | 4.1 | 0 | 1.8 | 0 | 0 | 3.9 |
| 13 | 31.7 | 28.9 | 37 | 26.5 | 37.5 | 39.3 | 19 | 20 | 25 |
| 13.2 | 1.7 | 2.6 | 0 | 0 | 9.4 | 1.8 | 0 | 0 | 2.6 |
| 14 | 28.3 | 23.7 | 25.9 | 28.6 | 25 | 19.6 | 23.8 | 10 | 26.3 |
| 14.2 | 8.3 | 4.4 | 0 | 2 | 3.1 | 1.8 | 2.4 | 20 | 5.3 |
| 15 | 8.3 | 11.4 | 7.4 | 10.2 | 3.1 | 1.8 | 14.3 | 10 | 6.6 |
| 15.2 | 5 | 9.6 | 14.8 | 10.2 | 12.5 | 10.7 | 19 | 10 | 10.5 |
| 16 | 0 | 2.6 | 7.4 | 8.2 | 0 | 7.1 | 4.8 | 20 | 6.6 |
| 16.2 | 6.7 | 3.5 | 3.7 | 0 | 0 | 2.4 | 10 | 5.3 | |
| 17 | 0 | 0 | 0 | 2 | 0 | 1.8 | 0 | 0 | 0 |
| 17.2 | 1.7 | 0 | 0 | 0 | 0 | 1.8 | 0 | 0 | 0 |
| 18.2 | 0 | 0 | 0 | 0 | 0 | 1.8 | 0 | 0 | 0 |
| 19 | 0 | 0 | 0 | 0 | 0 | 1.8 | 0 | 0 | 0 |
| 23 | 0 | 0 | 0 | 2 | 0 | 0 | 0 | 0 | 0 |
Table 14: Percentages of All Allele Frequencies of Locus D12S391.
| Province Allele | North Western | Central | Western | Sabaragamuwa | North Central | Eastern | Northern | Uva | Southern |
|---|---|---|---|---|---|---|---|---|---|
| 17 | 0 | 0 | 0 | 0 | 0 | 1.8 | 0 | 0 | 0 |
| 18 | 0 | 0 | 14.8 | 0 | 0 | 3.6 | 0 | 0 | 1.3 |
| 19 | 3.3 | 7.9 | 3.7 | 12.2 | 0 | 3.6 | 7.1 | 10 | 3.9 |
| 20 | 6.7 | 9.6 | 14.8 | 12.2 | 21.9 | 7.1 | 23.8 | 0 | 11.8 |
| 20.2 | 0 | 0 | 0 | 0 | 0 | 1.8 | 0 | 0 | 0 |
| 21 | 16.7 | 11.4 | 3.7 | 8.2 | 9.4 | 16.1 | 7.1 | 10 | 11.8 |
| 22 | 18.3 | 10.5 | 18.5 | 16.3 | 18.8 | 10.7 | 19 | 0.0 | 18.4 |
| 22.2 | 0 | 0.9 | 0 | 0 | 6.3 | 0 | 0 | 0 | 0 |
| 23 | 18.3 | 28.1 | 14.8 | 10.2 | 3.1 | 16.1 | 4.8 | 30 | 10.5 |
| 23.2 | 0 | 1.8 | 0 | 0 | 0 | 0 | 0 | 0 | 2.6 |
| 24 | 25 | 12.3 | 14.8 | 18.4 | 15.6 | 17.9 | 11.9 | 10 | 25 |
| 24.2 | 0 | 1.8 | 0 | 0 | 0 | 1.8 | 0 | 0 | 11.3 |
| 25 | 8.3 | 7 | 7.4 | 18.4 | 25 | 12.5 | 21.4 | 40 | 6.6 |
| 26 | 1.7 | 4.4 | 7.4 | 4.1 | 0 | 0 | 4.8 | 0 | 5.3 |
| 27 | 0 | 0.9 | 0 | 0 | 0 | 0 | 0 | 0 | 1.3 |
| 28 | 1.7 | 0 | 0 | 0 | 0 | 0 | 0 | 0 | 0 |
| 10 | 3.3 | 0 | 0 | 2 | 0 | 1.8 | 0 | 0 | 0 |
| 11 | 31.7 | 28.1 | 33.3 | 18.4 | 37.5 | 21.4 | 33.3 | 50 | 27.6 |
| 13 | 1.7 | 0 | 0 | 0 | 0 | 0 | 0 | 0 | 0 |
| 14 | 6.7 | 3.5 | 3.7 | 12.2 | 0 | 5.4 | 9.5 | 0 | 5.3 |
| 15 | 43.3 | 43 | 51.9 | 40.8 | 50 | 35.7 | 33.3 | 30 | 52.6 |
| 16 | 3.3 | 16.7 | 3.7 | 16.3 | 0 | 23.2 | 21.4 | 20 | 7.9 |
| 17 | 10 | 4.4 | 7.4 | 10.2 | 12.5 | 8.9 | 2.4 | 0 | 6.6 |
| 18 | 0 | 0.9 | 0 | 0 | 0 | 3.6 | 0 | 0 | 0 |
Table 15: Percentages of All Allele Frequencies of Locus FGA.
The frequencies of alleles for each locus were compared statistically among all provinces. Table 2 displays the number of loci that exhibit a significant difference out of 22 loci among all provinces in Sri Lanka.
| Central | Western | Sabaragamuwa | North Central | Eastern | Northern | Uva | Southern | |
|---|---|---|---|---|---|---|---|---|
| North Western | 14 | 9 | 12 | 7 | 15 | 10 | 4 | 11 |
| Central | 8 | 11 | 8 | 15 | 10 | 7 | 11 | |
| Western | 14 | 5 | 9 | 13 | 7 | 12 | ||
| Sabaragamuwa | 5 | 11 | 7 | 5 | 11 | |||
| North Central | 7 | 13 | 8 | 13 | ||||
| Eastern | 12 | 5 | 11 | |||||
| Nothern | 7 | 12 | ||||||
| Uva | 10 |
Table 16: Out of the 22 Loci, the Number Showing Significant Differences Among the Nine Provinces.
The Figure 1, displays the number of loci showing significant difference of each province with the rest of the all eight provinces.
Discussion
The total number of alleles observed across the population was found to be 234 alleles for this particular study (Table 1-Table 22). It can be concluded that there is a high level of polymorphism of the selected microsatellites. D1S1656 and Penta E loci illustrate the largest number of different alleles (18 alleles). The following locations of the most common alleles at the 22 loci were allele 16 for D3S1358 locus, allele 11 for D1S1656, D16S539, D5S818 and D13S317 loci, allele 14 for D10S1248 and D18S51 loci, allele 10 for D2S441 locus, allele 23 for D2S1338 and FGA loci, allele 9 for Penta D locus, TPOX and THO1, allele 8 for D7S820 locus, alleles 17 for vWA locus, allele 29 for D21S11 locus, allele 12 for D8S1179 and CSF1PO loci, allele 13 for D19S433 locus, allele 18 for D12S391 locus and allele 15 for Penta E locus. The good indicators of the genetic polymorphism within the sample are verified by the number of alleles and the expected heterozygosity found in the population. Basically, the number of alleles is highly associated with the size of the sample. This is due to the presence of unique alleles in populations, which occur in low frequencies. Also because of the bigger population size, the number of observed alleles tends to increase.
When comparing the evaluated statistical differences between the populations from all nine provinces, the loci named D1S1656, D2S441, Penta E, D18S51, D2S1338, Penta D, D21S11, D12S391, D19S433 and FGA having alleles of 18, 10, 18, 14, 14, 11, 16, 13, 16 and 16 respectively, showed significant differences within either provinces mostly. However, the loci having lower than 10 alleles did not show significance between the provinces compared to the loci having a higher number of alleles. It is seen that the level of significance increases while increasing the number of alleles in each locus.
The southern province showed the highest number of significantly different loci (91) among all other provinces. Southern province is the most distant province and this distance may cause the genetic isolation of that area. Although it is located within the boundaries of Sabaragamuwa, Central, Uva and Eastern provinces, according to the geography the boundaries were obstructed by several mountains and central highlands and forests [5].
The Northern and Eastern provinces showed the second and third highest number of significantly different loci (84 and 85 respectively) between each other and the rest of the provinces rather than the comparison between the other seven provinces. Those provinces are highly populated with Tamils and Muslims (Northern province: Tamil - 93.8% and Muslim - 3.1%, Eastern province: Tamil - 39.2% and 36.9%) [4]. Therefore, their marriages are restricted within their area and race mostly. This may cause the isolation of the particular population in these provinces and show significant differences with the rest of the provinces.
According to the analysis, there are 84 loci that are significantly different in the Central province among all the other provinces. The central province consists of central highlands and is geographically isolated from the surrounding regions. The geographical barrier in that area may physically separate the population and may decrease interbreeding with the people of surrounding areas and create significant differences with the rest of the provinces [5].
Conclusion
The representative Sri Lankan population genetic data on human polymorphisms reveals significant allele frequency differences mostly in Northern, Eastern, and Southern Provinces between the rest of the provinces respectively. The Northern and Eastern provinces have diverse populations, leading to genetic isolation among different races. Due to mountains, rivers, and sanctuaries, the Southern province, as well as the Central provinces, are geographically isolated from its neighboring provinces.
References
-
Santos NBPD, Filho MFFP, Silva AMDS, Teló EP, Nascimento Junior JB, et al. (2023) Allele Frequencies and Forensic Data of 25 STR Markers for Individuals in Northeast Brazil. Genes (Basel) 14(6): 1185.
-
Yamamoto T, Watanabe N, Uchihi R, Yoshimoto T, Li SL, et al. (2004) Differences in allele distribution at 15 STR loci among four Japanese regional populations. International Congress Series 1261: 157-159.
-
Wanga Y, Jina X, Zhanga W, Cui W, Konga T, et al. (2020) Comprehensive analyses for genetic diversities of 19 autosomal STRs in Chinese Kazak group and its phylogenetic relationships with other continental populations. Forensic Sci Res 7(2): 163-171.
-
(2012) Department of Census and Statistics.
-
Geography of Sri Lanka.
-
Hameed IH, Ommer AJ, Murad AF, Mohammed GJ (2015) Allele frequency data of 21 autosomal short tandem repeat loci in Mesan and Basra provinces in South Iraq. Egyptian Journal of Forensic Sciences 5(4): 150-156.
-
Projic P, Skaro V, Samija I, Pojskic N, Durmić-Pašić A, et al. (2007) Allele Frequencies for 15 Short Tandem Repeat Loci in Representative Sample of Croatian Population. Croat Med J 48(4): 473-477.
-
Zhang W, Jin X, Wang Y, Kong T, Cui W, et al. (2020) Genetic Polymorphisms and Forensic Efficiencies of a Set of Novel Autosomal InDel Markers in a Chinese Mongolian Group. Biomed Res Int 3925189.
-
Talledo M, Gavilan M, Choque C, Aiquipa L, Are´valo J, et al. (2010) Comparative allele distribution at 16 STR loci between the Andean and coastal population from Peru. Forensic Science International Genetics 4 (4): e109-e117.
- Narcotics and Digital Forensics: Bridging Crimes in the Digital Age
- Ethics in Forensic Psychiatry: Principles, Dilemmas, and Human Rights
- Impact of Acute Stress on Attentional Orienting to Social Cues
- Head Injury and Intracranial Hemorrhage in Western Region of Libya
- A Forensic Study on Handedness: Examination of Handwriting Features in Right and Left Handed Writers
- Techniques for Latent Fingerprint Development Using Natural and Synthetic Powders: A Review