Optical Precipitation Gauge in the Rainfall Kinetic Energy Measurements
A brief overview of the tasks that require information about the rainfall kinetic energy is presented. The possibilities of methods for obtaining such information using different techniques are shown. The influence of various microstructural parameters of raindrops on the kinetic energy is analyzed. This technique is illustrated by the data of measuring the characteristics of a heavy rain on July 22, 2023 in Tomsk. The measurements were carried out using the optical precipitation gauge OPTIOS. The OPTIOS measurement results are compared with the results of simplified estimates. It is concluded that the optical precipitation gauge is successfully used in solving problems requiring an accurate measurement of rainfall kinetic energy
Introduction
Information about kinetic energy stored in falling raindrops from high altitudes is important in solving a number of scientific, practical and economic tasks. The most important information about the kinetic energy of precipitation is for the agro-industrial sector of the economy, since such energy causes not only soil erosion, but also landslides [1, 2]. High values of kinetic energy brought by liquid atmospheric precipitation can provoke the occurrence of landslides [1]. The advantage of predicting landslide hazards based on energy flow control is that the probability of a landslide may occur before the end of high-intensity precipitation, since the threshold value of kinetic energy transmitted to the soil by drops can be exceeded in a time interval shorter than the duration of rain [2].
Information about the kinetic energy brought by atmospheric precipitation to the underlying surface plays one of the most important roles in predicting soils erosion [3]. Erosion is one of the main causes of land degradation worldwide, especially agricultural soils. Erosion depletes the soil, leaching nutrients, significantly affects the most important ecological functions of the soil: fertility, filtration ability, carbon and nitrogen storage, preservation of animal habitats. Anthropogenic activities, such as urbanization, agriculture, clearing and deforestation, expose and de- mobile soils, which leads to accelerated erosion, loss of productivity and landscape change [3]. Although the rain duration is usually measured in minutes or hours, the amount of soil washed away can reach tens of tons per hectare [4]. In addition, the erosive transfer of soil can provoke floods due to siltation of riverbeds [5]. Therefore, soil erosion is a global problem, so serious that, for example, in the USA in 1930 it was declared as a national threat (national menace), which was a consequence of the development and cultivation of new agricultural land in the XIX and early XX centuries [4].
A deeper understanding of the mechanisms that cause soil erosion is vital to reduce its impact on agriculture and the environment [6], as well as to develop methods for sustainable conservation and land use planning [3]. At the same time, a reliable quantitative assessment of the erosion rate and the factors determining it, including rainfall kinetic energy, is crucial. A large number of studies conducted around the world in regions with different climatic conditions and precipitation regimes have been devoted to solving this problem [6, 7, 8, 9, 10, 11, 12, 13, 14, 15, 16, 17, 18, 19, 20, 21]. Also, the assessment of rain kinetic energy is important for understanding the mechanisms and mitigating the effects of erosion of the leading edge of wind turbine blades [5, 22, 23].
For example, an accurate assessment of the kinetic energy of precipitation is important for understanding the mechanisms and mitigating the effects of leading-edge erosion (LEE) of wind turbine blades [5]. Erosion damages reduce the aerodynamic characteristics of the blades, which leads to a decrease in annual electricity generation and an increase in the downtime of turbines for repair [22]. Although LEE is influenced by a number of atmospheric phenomena, the speed of raindrops and the total amount of precipitation are recognized as one of the main external factors of erosion [23]. Taking into account the rapid growth of wind energy, which provides a sustainable, renewable and environmentally friendly energy source, the most accurate determination of the kinetic energy of precipitation is important for quantifying the LEE of blades in wind turbines, especially for regions where the rainy seasons make up a significant part of the year [5].
Many research efforts are focused on rainfall–soil interaction at local and regional scales. Raindrop impact, the key mechanism for disaggregating and mobilizing soil particles, depends on the raindrops kinetic energy. This is possible using instruments that record raindrop size and velocity data. The objective of this work is to develop and test a technique for determining the kinetic energy brought by hydrometeors to the underlying surface using an optical rain gauge, analyze the effect of various rain parameters on the kinetic energy value, and compare the values obtained with the values calculated using simplified methods.
Methods and Instruments
Calculation of Kinetic Energy Based on the Results of Measuring the Intensity of Rain
The kinetic energy of rain is the sum of the energies of individual drops. The energy of drop (_E_k) is calculated through its characteristics according to a known formula:
2 3 2 12 /12, k E mv D V πr = = (1) where r is the density of water, D is the equivalent diameter of a spherical drop, v is the terminal velocity with which it falls on the underlying surface. Due to the fact that these parameters, as a rule, are not measured during research, it is necessary to focus on more accessible rain parameters. In particular, empirical dependences between the kinetic energy (E) of precipitation and its intensity (I) are used in a number of works [5, 17, 18, 19, 20, 21]. It should be noted that the rainfall kinetic energy can be represented in two forms [24]: kinetic energy _E_mm [J m-2 mm-1] delivered per unit of soil surface during 1 mm precipitation; kinetic energy _E_t [J m-2 min-1] delivered by drops per unit of the underlying surface per unit of time (in minutes).
E_t= _c I E_mm, (2) where constant c is depends on the units of time used, _I is rain intensity.
The ratio estimating E as a function of rain intensity, most often used because of its simplicity, was proposed in Wischmeier WH et al. [25]. According to this relation, the kinetic energy (in J m-2) of rain with intensity I (in mm h-1) falling on 1 m2 during time D_t_ (in hour) is equal to:
(11.9 8.73 log I)I t E = + D (3) If we assume that the time interval D_t_ is 1 min, then dividing the value obtained by formula (3) by 60, we get E_t in J m-2 min-1: _E_t = _E / 60 (4) The works Fornis RL, et al. [18, 24] present an overview of many empirical relations of E and I. It was found that the results of calculations of E, made according to various formulas, differ significantly from each other. Possible reasons for this are: methodological differences in measurement procedures I and subsequent calculations, the use of data that cover only a small range of precipitation intensity, as well as differences between geographical locations or weather systems of regions in which parameters were selected for specific empirical ratios.
Calculation of Kinetic Energy Using Drop Size Distribution
A number of methods are known for calculating the kinetic energy of precipitation based on empirical expressions linking the intensity of rain with the statistical characteristics of the Drop Size Distribution (DSD), among which two classical methods are distinguished [8]. The first of them is to find the ratio between the median volume diameter of raindrops (D_50) and their intensity _I. The median diameter D_50 corresponds to a diameter by which the volume of all particles is divided into two equal parts. The volume of all particles with a diameter less than _D_50 is 50% of the total volume of particles. The median diameter is found using an integral distribution curve [26, 27]. It is assumed that the effective diameter of _D_50 is able to reproduce the properties of the entire set of raindrops. Therefore, the estimation of rainfall kinetic energy does not require knowledge of the entire of drop size and velocity distributions [28]. All that is required is the value of the terminal velocity of a drop with a diameter of _D_50, which can be estimated from empirical relations and tables linking _v and D [8].
The second of the classical methods for calculating the kinetic energy of rain based on DSD consists in using the full spectrum of particle size and velocity distribution. For this reason, formulas based on full DSD were previously used less frequently than those based on D50. Nevertheless, there are a number of studies using this technique [13, 14, 15, 16, 17]. Methods for obtaining DSD began to be developed in the late 19th - early 20th centuries [8] in the form of the so–called classical “filter paper method” and “grain flour method”. Both of them are based on measuring the number and size of drop spots on the measuring surface. The sizes of the spots are compared with the actual drop diameters and tabular values of drop falling velocities corresponding to these diameters are found. Despite the age of development, these methods are still sometimes used in modern research. For example, in Meshesha DT, et al. [13] DSD for each rain was determined by the exposure of about 370 sheets of filter paper treated with a small amount of powdered dye.
Automatic measurement of DSD is possible with the use of devices such as disdrometers, which record the spectra of rain drop sizes and falling velocities [3, 5, 11, 15, 17, 26, 27, 28, 29, 30, 31, 32]. There are a number of disdrometers based on different physical principles. For example, the JWD type disdrometer used in Torres DS, et al. [8] is an electromechanical device that determines the size of a raindrop by measuring the force of the impact that the falling drop produces on the sensor surface. The JWD disdrometer gives good results for light and medium intensity, but underestimates the number of small droplets during heavy rains and cannot detect raindrops with a diameter of less than 0.2 mm [29]. In the study Jayawardena AW, et al, [15], a relatively inexpensive device was used, which uses a piezoelectric converter. The device continuously and automatically registers the electrical response of the converter resulting from the transmission of a vertical pulse of raindrops hitting its surface. Each of the pulses recorded represents a drop and the magnitude of the pulse corresponds to drop size, momentum and kinetic energy. The spectrum of the drop size distribution and the total kinetic energy load of a rainfall event is calculated by analyzing the total number of pulses, their peak amplitudes, the amount of rainfall and the calibration curves.
Modern disdrometers based on optical principles measure either the damping of the laser beam when a rain particle passes between the transmitter and the receiver, or the light scattering from particles passing cross the light beam.
Both types use a laser signal transmitter and receiver, usually in a horizontal plane. Both the transmitter and the receiver can be either single or consist of an array of elements. Optical disdrometers provide complete DSD measurements by the amplitude and duration of the change in the light flux in the measuring channel when the particles pass cross the beam. Laser disdrometers are not without problems associated with the effects of uneven power distribution of the laser beam, the simultaneous appearance of several droplets in the measuring volume (double detection) and edge events (partial detection) [29].
An improvement over laser disdrometers is the two- dimensional 2DVD video disdrometer by Joanneum Research. The 2DVDs use two orthogonally directed high-speed linear scanning cameras, each with a separate light source. The 2DVD disdrometer provides reliable measurements of the velocity, size and shape of falling particles [30]. Currently, this disdrometer is considered a reliable reference for particles larger than 0.3 mm, although its use is mainly limited to individual experiments due to the high cost and requirements for processing measurement data [29].
Modern optical disdrometers are becoming more and more affordable, the devices are supplied calibrated ex works and ready for use in the field. These devices provide measurements of the size and velocity of raindrops to determine DSD and, accordingly, kinetic energy. Based on this, work Angulo-Martinez M, et al. [31] concluded that, whenever possible, kinetic energy should be measured, and not evaluated on the basis of empirical relations representing E as a function of rain intensity. Similar conclusions were made by the authors of the studies [11, 17].
Measurement of Kinetic Energy Using the OPTIOS Precipitation Gauge
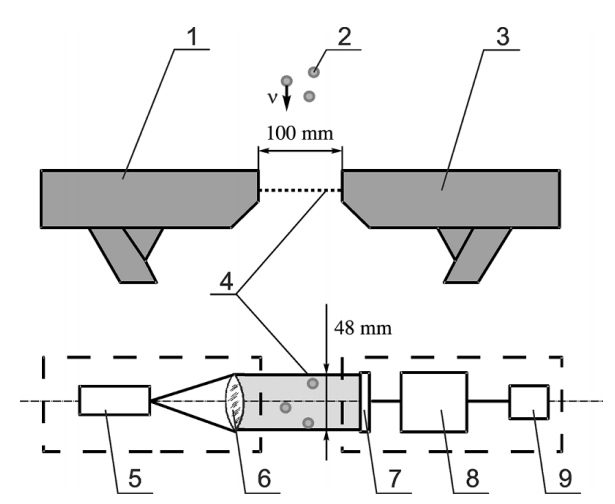
The operation of the optical gauge gage is based on the method for measurements and analysis of shadow images of rain drops [32]. In order to implement this method, a plain horizontal collimated light flux from the light source falls on to a linear array of lightsensitive elements (linear sensor, CCD) and forms a measurement channel. CCD contains 768 highly sensitive elements with a size of 63 microns. CCD makes it possible to register shadow images of raindrops with a frequency of about 20 kHz. The size of the measurement area is determined by the size of the open part of the measurement channel, through which the rain drops pass, and is 48 × 100 mm. Drops cross the light flux and shade the line sensor elements. The high frequency of the sensor scanning allows multiple measurements of the horizontal cross-section of each drop shadow as the drop passes through the measurement area. Since the receiver includes an array of photosensitive elements configured not to register the degree of illumination, but to trigger the light- shadow threshold, the device is free from the lack of laser disdrometers associated with the effects of uneven power distribution of the laser beam, noted in Angulo MM, et al. [29].
The optical rain gage allows us to accurately record the time of the start and end of precipitation, the quantity of particles that cross the measurement channel, and to detect their shape and size. This makes it possible to find the microstructure characteristics and integral parameters of precipitation (Figure 1).
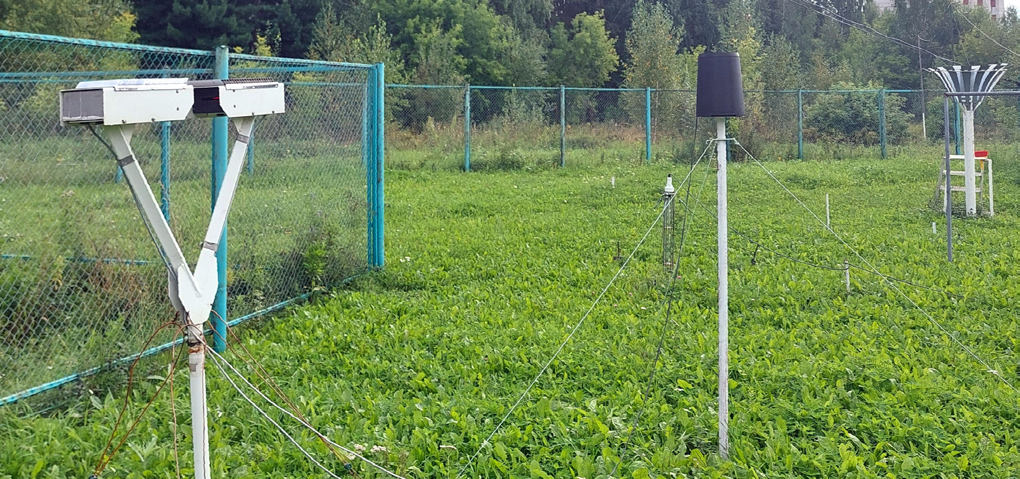
In Johannsen LL, et al. [11, 18], it is proposed to evaluate the accuracy of the measurement results of disdrometers by comparing the Q value they give with the indicators of standard precipitation measurements. The OPTIOS precipitation meter is installed on the meteorological site of the Geophysical Observatory (GO) of IMCES SB RAS in close proximity to the standard Tretyakov O-1 precipitation meter and the Davis Rain Collector (RC) shuttle precipitation meter as shown in Figure 2. The results of long-term tests showed a good agreement of the measurement data of all three devices and confirmed the high accuracy of measurements of the integral characteristics of precipitation carried out using OPTIOS [33].
In the present study, the kinetic energy of precipitation was obtained based on the measurement data of OPTIOS in three variants:
- According to the formula (1), the energy of the _E_t was calculated by summing up all hydrometeors registered in a minute. The _E_mm was calculated by summing up all hydrometeors registered with the accumulation of precipitation of 1 mm.
- According to formula (1), the energy of the E_t.av was calculated by summing up all hydrometeors registered per minute according to a simplified procedure consisting in the application in formula (1) of the average values of _D and v per minute.
- For comparison, the kinetic energy was estimated using the empirical dependence of E on I (3), hereinafter referred to as _E_I. The values of precipitation intensity per minute used in the calculations were also measured by the OPTIOS.
Results and Discussion
The opportunities of the OPTIOS precipitation gauge in solving the problem of measuring the microstructural characteristics of precipitation and obtaining on their basis the parameters of the energy flows transferred during rainfall are demonstrated in this work by the example of a downpour that fell in Tomsk (Russia) from 13 h 41 min to 14 h 04 min on June 22, 2023, accompanied by thunderstorms. During this time, the total amount of precipitation recorded by OPTIOS, RC and O-1 was 12.96, 12.10 and 11.00 m, respectively. Although in the journal of meteorological observations of the GO, this rain shower is marked as “moderate shower “, the peak intensity according to OPTIOS and RC reached up to 90 mm/h. In Wischmeier WH, et al. [25], heavy rain with a total precipitation of at least 12 mm (0.5 in) or with a maximum 15-minute intensity exceeding 25 mm/h (1 in/h) is defined as an erosion storm. In the event under consideration, the average intensity was 33 mm/h, and the maximum 15-minute intensity was 37 mm/h. Therefore, the choice of this meteorological phenomenon in this work as an object of study from the point of view of the erosive activity of precipitation, determined by their kinetic energy, seems to be quite reasoned.
Figure 3 shows the changes in the energy, integral and microstructural characteristics during the shower. The graph shows the change in the average diameter (D) of the drops that fell in a minute (N), the effect of the so-called sorting of drops caused by the tendency of larger drops to move faster than smaller ones is clearly noticeable [26]. This leads to the fact that at the beginning of a shower, a relatively small number of large drops outstrip most medium-sized drops, and then, over time, the average size of the drops decreases. In [14], it was concluded that the higher erosive activity of rain is associated with large droplet sizes, and not with high rain intensity. The results of our measurements do not confirm this conclusion. On the contrary, the best correlation of changes in kinetic energy with changes in intensity is clearly visible. That is, in this case, the change in kinetic energy E and intensity I correlate much better with changes in N than D. For example, if we compare the values measured in a minute at 13 h 49 min with those measured at 13 h 51 min, it can be seen that in the first case the values of N, I and, respectively, E_t are significantly less than those obtained in the second, whereas with _D it is the opposite.
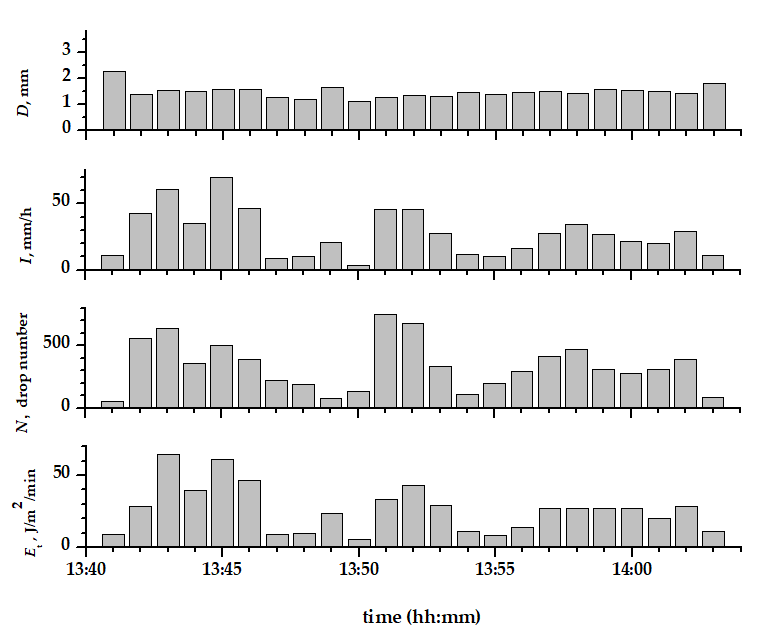
The assumption made in Jayawardena AW, et al. [15] that a larger average drop size corresponds to a greater precipitation intensity is also not confirmed. A comparison of the corresponding measurement data at 13 h 49 min and at 13 h 51 min clearly illustrates the inverse relationship. Thus, the intensity of rain is mainly determined by the number of drops per unit of time, and not by their size. Only in the range of low intensities, when the effect of sorting drops is manifested, the reverse trend can manifest itself, as noted in Fornis RL, et al. [18], and what in our case is demonstrated by comparing the indicators at 13 h 49 min with the values obtained at 13 h 50 min. This is the result of a temporary increase in the concentration of large drops, sometimes carrying many times more energy compared to much more numerous medium and small ones.
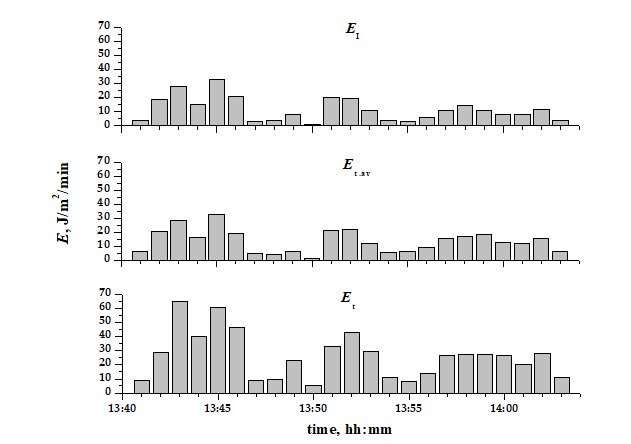
Figure 4 shows the results of calculating the kinetic energy of the shower under study based on the measurement data of OPTIOS using three different methods described in Section 1.3. It can be seen that the correlation of kinetic energy changes during the entire downpour is quite satisfactory for all three graphs. It should be noted that the values of E_I obtained using empirical dependence (3) agree much better both in the course of changes and in absolute values with the values calculated using the simplified _E_t.av method than with the values of _E_t. Obtained from the directly measured parameters of each drop. This suggests that the use of simplifying procedures to facilitate the calculation of kinetic energy can reduce even calculations made on the basis of real measurements to the level of empirical estimates. In our case, this resulted in at least a double underestimation of the absolute values of the key parameter determining the erosive activity of precipitation. It should also be noted that kinetic energy calculations based on hydrometric data do not always give large values compared to model calculations based on empirical dependences of _E on I. For example, in the study Angulo-Martinez M, et al. [31], calculations based on the ratios E and I constantly gave overestimated results, since these ratios are largely determined by the region in which their parameters were calibrated and by what methods. In addition, the accuracy of the measurements of the disdrometer is important. The device should be checked, as mentioned above, during field tests in conjunction with standard precipitation gauges.
The kinetic energy brought by a downpour per unit of soil surface at the fall of 1 mm of precipitation is shown in Figure 5.
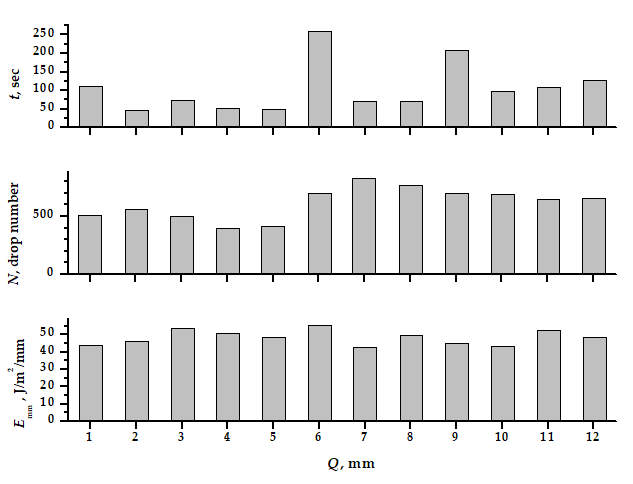
For a better understanding of the mechanism of formation of this value, the number of drops N recorded by the device during the accumulation of the corresponding 1 mm of precipitation and the duration of the time interval D_t_ during which this accumulation occurred are also given. It can be seen that the values of _E_mm have much less variability than _E_t. At the same time, that changes are mainly determined by the current nature of precipitation. For example, comparing the accumulation of the 2nd and 3rd mm of precipitation, it can be seen that with a shorter accumulation time of the 2nd mm, which indicates a higher intensity of the shower, the 3rd mm was accumulated with the participation of fewer drops. This means that the rain drops were on average larger than the particles that formed the 2nd mm. The _E_mm graph shows that this slight upward shift of DSD led to a noticeable increase in the energy brought to the underlying surface of the 3rd mm of rain.
Similarly, when comparing the number of droplets that formed the 6th and 7th mm, we come to the conclusion that during the transition from the 6th to the 7th mm, the average particle size shifted downward. This led to the expected decrease in the E_mm value, despite the fact that a change in the value of D_t indicates an increase in intensity by several times. That is, the dependence of the energy characteristics of precipitation on the determining parameters has a rather complex form and requires further comprehensive study.
Conclusion
Thus, in this paper, the prospects of using the optical precipitation gauge OPTIOS as the main tool for solving any problems related to the quantitative determination of energy flows carried during the precipitation of liquid precipitation is substantiated. The technical and computational capabilities, as well as the overall potential of the device in solving this class of problems both at the theoretical and practical levels, are demonstrated by measuring the integral and microstructural characteristics of a heavy shower in natural conditions and calculating a number of energy parameters based on them.
Conflicts of Interest
The authors declare no conflict of interest.
Funding
The work was carried out within the framework of the state task of IMCES SB RAS.
References
-
Chang JM, Chena H, Jou BJD, Tsou NCh, Lin GW (2017) Characteristics of rainfall intensity, duration, and kinetic energy for landslide triggering in Taiwan. Eng Geol 231: 81-87.
-
Ferro V, Carollo FG, Serio MA (2020) Establishing a threshold for rainfall-induced landslides by a kinetic energy–duration relationship. Hydrol Process 34 (16): 3571-3581.
-
Angulo-Martinez M, Barros A (2015) Measurement uncertainty in rainfall kinetic energy and intensity relationships for soil erosion studies: An evaluation using PARSIVEL disdrometers in the Southern Appalachian Mountains. Geomorphology 228: 28-40.
-
Yin S, Nearing MA, Borrelli P, Xue X (2017) Rainfall Erosivity: An Overview of Methodologies and Applications. Vadose Zone J 16 (12): 1-16.
-
Jose J, Gires A, Tchiguirinskaia I, Roustan Y, Schertzer, D (2022) Scale invariant relationship between rainfall kinetic energy and intensity in Paris region: An evaluation using universal multifractal framework. J Hydrol 609 (6): 127715.
-
Angel JR, Palecki MA, Hollinger SE (2005) Storm Precipitation in the United States. Part II: Soil Erosion Characteristics. J Appl Meteorol 44 (6): 947-959.
-
Luo L, Wang L, Huo T, Chen M, Ma J, et al. (2021) Raindrop Size Distribution and Rain Characteristics of the 2017 Great Hunan Flood Observed with a Parsivel 2 Disdrometer. Atmosphere 12 (12): 1556.
-
Torres DS, Salles C, Creutin J D, Delrieu G (1992) Quantification of soil detachment by raindrop impact: performance of classical formulae of kinetic energy in Mediterranean storms. Proceedings of the Symposium Erosion and Sediment Transport Monitoring Programmes in River Basins, Oslo, Norway.
-
Lim YS, Kim JK, Kim JW, Park BI, Min Seok, et al. (2015) Analysis of the relationship between the kinetic energy and intensity of rainfall in Daejeon, Korea. Quatern Int 384: 107-117.
-
Kinnell PIA (2005) Raindrop-impact-induced erosion processes and prediction: a review. Hydrol Process 19(14): 2815-2844.
-
Johannsen LL, Zambon N, Strauss P, Dostal T, Neumann M, et al. (2020) Comparison of three types of laser optical disdrometers under natural rainfall conditions. Hydrolog Sci 65(4): 524-535.
-
Catari G, Latron J, Gallart F (2011) Assessing the sources of uncertainty associated with the calculation of rainfall kinetic energy and erosivity-application to the Upper Llobregat Basin, NE Spain. Hydrol Earth Syst Sc 15(3): 679-688.
-
Meshesha DT, Tsunekawa A, Tsubo M, Haregeweyn N, Adgo E (2014) Drop size distribution and kinetic energy load of rainfall events in the highlands of the Central Rift Valley, Ethiopia. Hydrol Sci J 59(12): 2203-2215.
-
Nyssen J, Vandenreyken H, Poesen J, Moeyersons J, Deckers J, et al. (2005) Rainfall erosivity and variability in the Northern Ethiopian Highlands. J Hydrol 311(1-4): 172-187.
-
Jayawardena AW, Rezaur RB (2000) Drop size distribution and kinetic energy load of rainstorms in Hong Kong. Hydrol Process 14(6): 1069-1082.
-
Assouline S (2009) Drop size distributions and kinetic energy rates in variable intensity rainfall. Water Resour Res 45(11): W11501.
-
Ramon R, Minella JPG, Merten GH, Barros CAP, Canale T (2017) Kinetic energy estimation by rainfall intensity and itsusefulness in predicting hydrosedimentological variables in a small rural catchment in southern Brazil. Catena 148(2): 176-184.
-
Fornis RL, Vermeulen HR, Nieuwenhuis JD (2005) Kinetic energy–rainfall intensity relationship for Central Cebu, Philippines for soil erosion studies. J Hydrol 300(1-4): 20-32.
-
Mikos M, Jost D, Petkovsek G (2006) Rainfall and runoff erosivity in the alpine climate of north Slovenia: a comparison of different estimation methods. Hydrolog Sci 51(1): 115-126.
-
Lobo GP, Bonilla CA (2015) Sensitivity analysis of kinetic energy-intensity relationships and maximum rainfall intensities on rainfall erosivity using a long-term precipitation dataset. J Hydrol 527(8): 788-793.
-
Sanchez-Moreno JF, Mannaerts CM, Jetten V, Loffler- Mang M (2012) Rainfall kinetic energy–intensity and rainfall momentum–intensity relationships for Cape Verde. J Hydrol 454-455: 131-140.
-
Keegan MH, Nash DH, Stack MM (2013) On erosion issues associated with the leading edge of wind turbine blades. J Phys D: Appl Phys 46(38): 383001.
-
Herring R, Dyer K, Martin F, Ward C (2019) The increasing importance of leading edge erosion and a review of existing protection solutions. Renew Sustain Energy Rev 115(11): 109382.
-
Salles Ch, Poesen J, Torres DS (2002) Kinetic energy of rain and its functional relationship with intensity. J Hydrol 257(1-4): 256-270.
-
Wischmeier WH, Smith DD (1978) Predicting Rainfall Erosion Losses: A Guide to Conservation Planning. US Department of Agriculture Handbook 537, Washington DC, USA, pp: 60.
-
Dijk AV, Bruijnzeel LA, Rosewell CJ (2002) Rainfall intensity-kinetic energy relationships: A critical literature appraisal. Hydrology 261(1-4): 1-23.
-
Komarova LF, Kormina LA (2000) Engineering methods of environmental protection. Techniques for protecting the atmosphere and hydrosphere from industrial pollution: A textbook. Altai, Barnaul, Russian, pp: 395.
-
Carollo FG, Serio MA, Ferro V, Cerda A (2018) Characterizing rainfall erosivity by kinetic power - Median volume diameter relationship. Catena 165: 12- 21.
-
Angulo MM, Begueria S, Latorre B, Fernandez RM (2018) Comparison of precipitation measurements by OTT Parsivel2 and Thies LPM optical disdrometers. Hydrol. Earth Syst 22: 2811-2837.
-
Kruger A, Krajewski WF (2002) Two-dimensional video disdrometer: A description. J Atmos Ocean Tech 19(5): 602-617.
-
Angulo-Martinez M, Begueria S, Kysely J (2016) Use of disdrometer data to evaluate the relation-ship of rainfall kinetic energy and intensity (KE-I). Sci. Total Environ 568: 83-94.
-
Kal’chikhin VV, Kobzev AA, Korol’kov VA, Tikhomirov AA (2017) Determination of the Rate of Fall of Rain Drops in Measurements of Their Parameters by an Optical Rain Gauge. Measurement Techniques 59(11): 1175-1180.
-
Kalchikhin VV, Kobzev AA, Tikhomirov AA, Filatov DE (2021) Rainfall Measurements during Summer 2020 with the Optical Precipitation Gage. Atmos Ocean Opt 34(3): 278-281.
- Plant Diversity, Regeneration Dynamics, and Socio-Ecological Impacts at the Forest-Savanna Transition Zone, Cameroon
- Bird Community, Feeding Guilds and Habitat Associations Along the Proposed River Dibombe Hydropower and Transmission Line Project in Nkam and Moungo Divisions, Cameroon
- Plant Diversity and Carbon Storage Potential Across Different Land Use Types in Infrastructure Development Landscapes in Cameroon: Implications for no Net Loss of Biodiversity
- Optimization and Modelling for the Remediation of Brilliant Green Dye and Ni2+ ions from Water Using Advanced gC3N4/PVA@ Alginate Bio-Polymeric Hydrogel Beads
- The Negative Implications of Using Cell Phones on Human Health and Environment
- A Comprehensive Survey of Population Ecology in Insects