Optimization and Modelling for the Remediation of Brilliant Green Dye and Ni2+ ions from Water Using Advanced gC3N4/PVA@ Alginate Bio-Polymeric Hydrogel Beads
This work offers an innovative technique for creating a ternary composite adsorbent material using ultrasonic synthesis that consists of exfoliated graphitic carbon nitride nanosheets, polyvinyl alcohol, and alginate beads. FTIR, FE-SEM-Mapping, XPS analysis, and X-ray diffraction were among the characterizations that verified the ternary composite beads's successful synthesis and structure. Nickel ion removal and brilliant green (BG) dye adsorption from an aqueous solution were examined using the ternary composite beads' adsorption capabilities, and the influence of pH and the adsorbate's dose was assessed and optimized with response surface methodology (RSM). According to the data, the sorption phenomena are dependent on both the starting concentration of Ni2+ & BG dye and pH, with a maximal sorption capacity of 56.8 and 52.2 mg/g for BG dye and Ni2+ ions, respectively, at 318K. The Langmuir sorption model provides a good description of the chemisorption process that eliminates Ni2+ ions & BG dye, which follows pseudo-second-order kinetics. Additionally, a tenable mechanism for the adsorption of Ni2+ ions & BG dye onto the surface of gC3N4/PVA@ alginate ternary composite beads is proposed. More importantly, without exhibiting any discernible decrease in sorption ability, gC3N4/PVA@ alginate beads frequently used at least five cycles and showed remarkable regeneration ability. The characteristics of the ternary beads and their synthesis method offer a cost-effective and feasible wastewater remediation option.
Introduction
The purifying of water for use in drinking, irrigation, industrial processes, and recreational activities is a great environmental task. Physical, chemical, and biological techniques are commonly used in water treatment to eliminate pollutants and toxins from untreated water, resulting in clear, safe, and clean water. Significant environmental issues, such as water contamination, have been brought on by rapid industrialization and ongoing energy consumption [1]. Due to the serious threat posed by the pollution of water, manufacturing and scientific groups are acting [2, 3]. Biological, chemical, or physical techniques may be used to treat potentially toxic substances, relying on the waste’s characteristics. Neutralizing, stabilizing, or isolating hazardous materials to enable their safe disposal or reuse is the aim of dangerous waste treatment [4]. For the decontamination of wastewater, several traditional techniques have been used, including coagulation, flocculation, filtration, membrane separation, sedimentation, and reverse osmosis. Although, these techniques have drawbacks. On the other hand, adsorption offers advantages such as operational flexibility, high-quality output, economical initial capital costs and chemical requirements, and the ability to handle pollutants at low levels of therapy [5]. Heavy metal and metalloid-induced damage to the environment is a worldwide public health issue that has caused great concern because these components’ levels are regularly found in many environmental media, particularly water [6, 7, 8, 9]. Drinking water distribution lines that contain 8–10% Ni by weight. Ni is an important micronutrient that is needed in very small amounts. According to the US EPA when its level rises over 0.015 mg-1, it becomes hazardous and can lead to problems with breathing, and other several diseases [10, 11]. The primary raw materials for the manufacture of household goods, vibrant textiles, paints, printing inks, and other products are now coloring agents and dyestuffs. For example, over 107 kg of textile dyes are consumed year worldwide, and around 106 kg of dyes are released into water streams annually, killing over three million people. Stormwater contains a variety of commercial dyes that may be divided into three main categories: non-ionic (disperse and vat dyes), cationic (basic dyes), and anionic (direct, acid, and reactive dyes). However, cationic dyes generally have the greatest detrimental and poisonous impacts on the environment as a whole and the ecosystem that receives the water. Because of their chemical stability, as well as the mutagenic and cancer-causing effects they have on the oceanic biota, releasing such poisonous dyes into the environment has become a global problem [12, 13, 14]. Carbon and nitrogen atoms are organized in a special crystal structure to form graphitic carbon nitride (g-C3N4) a two-dimensional material, its large surface area and catalytic activity are attributed to its porous, honeycomb-like structure. These alluring physicochemical properties have made g-C3N4 an interesting material lately. Unfortunately, its modest specific surface area (SSA) contributes to its relatively limited sorption capability as pure nitride. The most often mentioned methods for resolving the aforementioned issues are element doping, composite creation, and heterojunction construction [15, 16, 17, 18]. Numerous adsorbents, such as hydrocarbons, polymers, and organic materials, have been studied. Because composite materials have better sorption effectiveness, there is presently an enormous rise in demand for employing them as beads [19, 20]. The addition of a biopolymer containing reactive functional groups like (-OH, -COOH), such as sodium alginate SA, and polyvinyl alcohol PVA promotes an aerogel- like texture. Because they are hydrophobic, biocompatible, biodegradable, and environmentally friendly, PVA and alginate are both intriguing options to be utilized as sorbents in a variety of ways. Compared to alginate beads, the PVA- alginate bead composite has a greater mechanical strength. This bioplastic’s ability to biodegrade without producing contaminants makes it a good candidate to be employed as a sorbent [19, 21, 22]. The objective of this research is to create ternary composite beads and evaluate how well they adsorb nickel metal ions (Ni2+), and brilliant green dye (BG) from aqueous solutions. Batch adsorption tests are then used to assess the effects of various operating parameters, including contact time, and initial contaminant concentration. The first and second-order rate, intraparticle diffusion, and Boyed models are used to characterize the adsorption kinetics and mechanism; in the meantime, Langmuir and Freundlich’s isotherms are used to analyze the adsorption mode. To comprehend the process mechanism, the parameters derived from the adsorption investigations are assessed. Extra care is to demonstrate the nanocomposite’s likely long- term efficacy, and particular focus is given to considering the regeneration processes over several cycles.
Experimental
Chemicals
Sodium alginate (Na-alginate) and polyvinyl alcohol (PVA) were provided by Sigma Aldrich, calcium chloride, Nitric acid, and urea were purchased from Fluka, Loba Chemie supplied the brilliant green dye (BG), and NiCl2 (Ni2+), deionized water was used for creating each experimental mixture.
Preparation of g-C3-N4 Nanosheets
Urea was calcined in a muffle furnace to create the g-C3N4 particles. Usually, a 100 mL ceramic crucible was filled with 20 g of urea then covered, and heated to 550°C for 3 hours at a rate of 2°C per minute. After that, the g-C3N4 was stirringly exfoliated in nitric acid for one hour, then centrifugation was used to gather the exfoliated g-C3N4, which was then left to dry overnight at 65°C [23, 24].
Synthesis of gC3N4/PVA@ Alginate Ternary Absorbent Beads
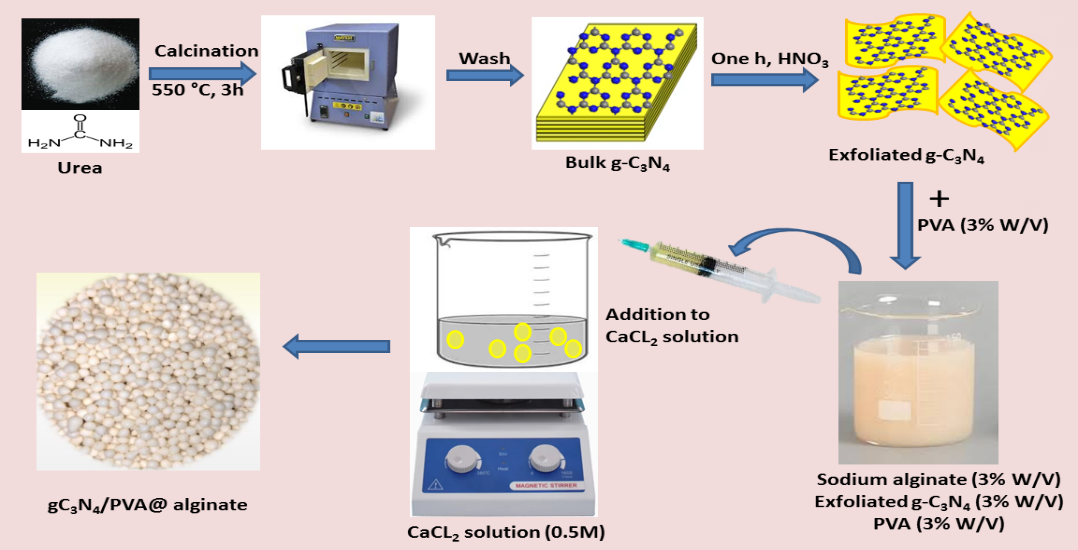
Exfoliated g-C3N4 (3% W/V) was dispersed in demineralized water and then sonicated for half an hour, then PVA (3% W/V) and sodium alginate (3% W/V) were introduced, and the resulting amorphous mixture was violently agitated and heated at 50°C for 1 hour till a homogeneous solution is obtained. The combination was injected drop by drop utilizing a syringe pump to an aqueous solution of CaCl2 (0.5 M) and kept for 6 hours, after which the beads were completely crosslinked [20, 25]. Finally, the obtained gC3N4/PVA@ alginate beads were washed for 2 hours in distilled water. The pristine alginate beads were prepared with the same steps without the addition of g-C3N4 and PVA, the synthesis scheme is presented in Figure 1.
Instrumentation
The IR spectra of synthesized materials have been captured using FT-IR spectroscopy (Shimadzu FTIR- 4200) spectrometer. X-ray Diffraction patterns (XRD) of the samples were obtained utilizing a contemporary PAN analytical diffractometer, Xpert PRO type. The prepared catalysts were measured throughout the diffraction angle (2θ) range of 5˚ and 80˚. The surface features of the catalysts were investigated on an HR-SEM (JEOL, JSM model no: 6360). investigation of scanning electron microscopy with energy dispersive X-ray (SEM-EDX) has been accomplished by utilizing scanning electron microscope JEOL GSM 6510LV.
The surface oxidation states and compositional structure were collected via XPS spectra on K-ALPHA (Thermo Fisher Scientific, USA) with monochromatic X-ray Al K-α radiation of −10−1350 eV and a spot size of 400 μm at a pressure of 10−9 m bar with a full-spectrum pass energy of 200 eV and a narrow-spectrum of 50 eV. A UV/ Vis. spectrophotometer (JENWAY-6505) was utilized for the detection of brilliant green (BG) at λmax of 625 nm. Zetasizer Nano-series HT Malvern instruments were employed to conduct zeta potential analysis. Utilizing atomic absorption spectrophotometry (AAS, ZEEnit 700P/Analytikjena CO., Germany), the liquid’s Ni2+ contents were assessed.
Batch Adsorption Studies and Parameters Optimization
At a steady temperature of 25°C and a stirring speed of 150 rpm, the sorption experiments were conducted in a batch sequence. To maximize the impact of certain adsorption system variables, including adsorbent dose and pH, on BG dye minimizing efficacy and Ni2+ ions onto prepared adsorbents, standard response surface methodology (RSM) based central composite design (CCD) has been employed.
As seen in Table 1, each adsorption parameter has five increased levels: + α, + 1, 0, -1, and -α. In the models, the pH was adjusted between 3 and 9, while the dose of adsorbents was adjusted between 0.2 and 1 g/L for both Ni2+ ions and BG, respectively. The statistical data analysis was done using the design expert software (V.11).
| Factors | Levels | ||||
|---|---|---|---|---|---|
| -α | -1 | 0 | 1 | +α | |
| Adsorbent dose (g/L) | 0. 2 | 0. 4 | 0. 6 | 0. 8 | 1 |
| pH | 3 | 4.5 | 6 | 7.5 | 9 |
Table 1: Experimental factor levels for the removal of BG dye and Ni2+ ions by gC3N4/PVA@ alginate.
The subsequent second-degree polynomial formula characterized the sorption effectiveness trend of the dye and metal ion:
3 3 3 2 2 = = = = = + + + ∑ ∑ ∑∑ (1)
1 1 1 1 i i ii ii ij i i i o j i j Y X X X X β β β β Where Y is the response variable, β0, βi, βij, and βii are the regression coefficients for intercept, linear effect, double interaction, and quadratic effects, respectively, and and are the independent variables.
The removal percentage of BG dyes Ni$^{2+}$ ions was estimated according to Eq. (2):
$$\text{Adsorption (\%)} = \frac{(C_o - C_e)}{C_o} \times 100$$
Where, is the initial concentration and is the concentration at equilibrium.
The capacity (q) of adsorbents was determined at different time intervals and $q_t$ values were calculated by the following equation (3):
$$q_t = \frac{V(C_0 - C_t)}{m}$$
Where $q_t$ (mg/g) is the amount of BG dye or Ni$^{2+}$ ions adsorbed at time $t$, $C_0$ (mg/L) is the initial contaminant concentration, $C_0$ (mg/L) is the concentration of a contaminant at time $t$, $V$ (L) is the volume of the BG dye or Ni$^{2+}$ ions solution, and $m$ (g) is the dry weight of the adsorbent [26].
The adsorption kinetic models of the pseudo-1$^{st}$-order and pseudo-2$^{nd}$-order were examined and are presented in linear forms stated as Equations (4 & 5):
$$\log(q_e - q_t) = \log(q_e) - \frac{K_1}{2.303} t$$
$$\frac{t}{q_t} = \frac{1}{(K_2 q_e^2)} + \frac{1}{q_e} t$$
Where, and are the amounts of BG dye or Ni$^{2+}$ ions adsorbed at time $t$ and equilibrium $e$, respectively; and are the pseudo-first-order and pseudo-second-order rate constants, respectively [27].
It is possible to transfer the adsorbent in several stages from the solution phase to the adsorbent surface. The processes could involve pore surface adsorption, film or external diffusion, pore diffusion, and surface diffusion. Adsorption can be finished in one or more steps. The Fickian diffusion laws, which are represented in Eqs. 6 is used to explore intra-particle diffusion.
$$q_t = K_1 t^{0.5} + X$$
$K_i$ is the intra-particle diffusion rate (mg/g min$^{-0.5}$), the $K_i$ is the slope of straight-line portions of the plot of $q_t$ versus $t^{0.5}$. $X$ is the intercept, which gives information about the thickness of the boundary layer [28].
Two isothermal sorption scenarios Langmuir and, Freundlich were employed to assess adsorption outcomes using the following equations:
$$\frac{1}{q_e} = \frac{1}{K_L C_e Q_m} + \frac{1}{Q_m}$$
$$\log q_e = \log K_f + \frac{1}{n} \log C_e$$
Where, $K_L$ (L/mg) and $Q_m$ (mg/g) are the Langmuir constants related to the adsorption energy and sorption capacity, respectively. While, $q_e$ (mg/g) is the equilibrium adsorption capacity and $C_e$ (mg/L) is the equilibrium concentration, also ($L/mg$) is the Freundlich constant and sorption intensity represented by $n$ which is the heterogeneity factor [27, 28].
More information on inherent energetic changes provided by the thermodynamic parameters including Gibbs free energy change ($\Delta G^\circ$), enthalpy change ($\Delta H^\circ$), and entropy change ($\Delta S^\circ$) for the adsorption process which were presented by the following equations:
$$\Delta G^\circ = -RT \ln K_d$$
$$\Delta G_o = \Delta H_o - T \Delta S_o$$
$$\ln K_d = \frac{\Delta S^\circ}{R} - \frac{\Delta H^\circ}{RT}$$
Where is the ideal gas constant (kJ mol$^{-1}$ K$^{-1}$), is the temperature (K), and $K_d$ is the equilibrium constant [29].
Results and Discussion
Morphology and Structural Characteristics
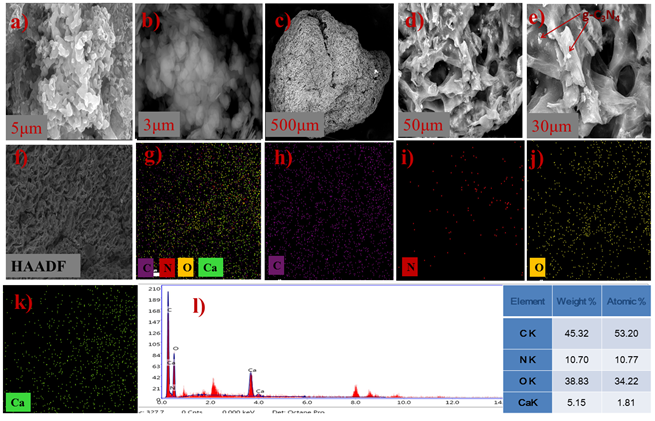
Studying the sorption behavior of compounds requires an understanding of their surface patterns and elemental composition. As depicted in Figures 2a, 2b the exfoliated g-C$_3$N$_4$ consisted of layer-structured 2D discs stacked by uneven nanosheets of varying diameters. In Figure 2c the gC$_3$N$_4$/PVA@ alginate micro bead has a rough surface indicating the incorporation of gC$_3$N$_4$ nanosheets, while the high magnifications of the bead in Figures 2d,2e indicates a high porous structure induced by the incorporation of gC$_3$N$_4$ and PVA which is highly favorable for the adsorption of dye and metal ion, also the gC$_3$N$_4$ nanosheets morphology remains unchanged on the surface of the bead. The high-angle annular dark-field picture (HAADF images in Figure 2f and the elemental mapping analysis that goes along with it displayed in Figures 2g-k indicate the consistent patterns of carbon, nitrogen, oxygen, and calcium in gC$_3$N$_4$/PVA@ alginate beads. Results displayed in Figure 2l emphasize that the weight percentage of C, N, O, and Ca elements are 45.32, 10.70, 38.83, and 5.15, respectively. Also demonstrates that there were no impurities present when the g-C3N4/PVA@BiOCl was prepared.
The crystal structure and phase composition are shown in Figure 3a by analyzing the XRD diffraction patterns of the produced alginate, g-C3N4, PVA, and gC3N4/PVA@alginate beads. The amorphous nature of the alginate and PVA polymers was confirmed by the broad peak that displayed at 25°, and 19.49° 2θ respectively [30, 31, 32]. The PVA@alginate and gC3N4/PVA@alginate beads display a prominent peak at 2θ of 11.97°and 11.87° respectively, which is explained by the alginate, and PVA structure’s strong intramolecular and intermolecular hydrogen bonds. The crystalline patterns of (100) and (002) are correlated with the two main diffraction peaks of gC3N4 that emerge at 2θ of 13.14° and 27.65°, respectively, the characteristic diffraction patterns pretty well match JCPDS File No. 87–1526 [32, 33]. Also, the gC3N4/ PVA@alginate beads display two peaks at 2θ of 13.81°and 26.87° that correlated to (100) and (002) of gC3N4 structure. Results indicate the good incorporation of the gC3N4 and PVA into gC3N4/PVA@alginate beads without impurities.
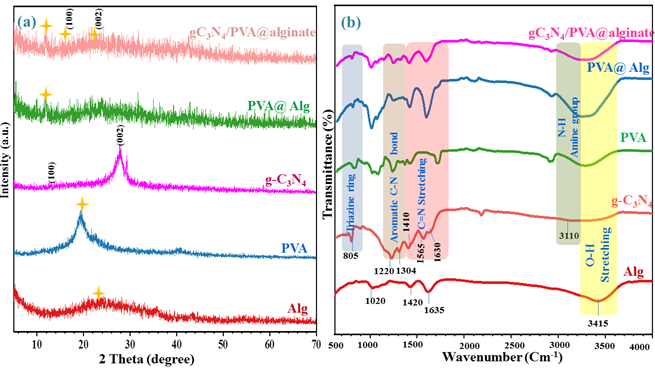
FT-IR spectroscopy was implied to verify the effective encapsulation of alginate and to Examine the effective groups as illustrated in Figure 3b. Each produced sample displayed a broad peak at 3415 cm−1, which was attributed to the absorbed water molecules’ O–H stretching vibrational mode [22, 34, 35]. The carboxylate groups (O=C–O–) in the alginate polymer are represented by both peaks at 1635 and 1420 cm−1 that were seen on the composite microbeads gC3N4/ PVA@alginate spectra [36, 37]. Attributed to the -NH2 group vibrating, g-C3N4 showed a peak at about 3110 cm-1 [38] which shifted to 3090 cm-1 in the gC3N4/PVA@alginate bead. Similarly, the pattern expanding at 805 cm-1 was ascribed to the typical vibration state of the triazine group and appeared in the same position in gC3N4/PVA@alginate. The bending of aromatic C-N bonds may be one reason for the peaks at 1304 and 1220 cm-1 [39, 40, 41] that shifted to a higher wavelength at 1319 and 1240 cm-1 in the gC3N4/PVA@alginate composite. In addition, the peaks that appeared at 1630 cm-1, 1565 cm-1, and 1410 cm-1 may be caused by the C=N stretching [42, 43] which also shifted to a lower wavelength at 1610 cm-1, 1515 cm-1 in the gC3N4/PVA@alginate beads. Generally, all peaks observed in pristine alginate, PVA, and gC3N4 are shifted in the composite of gC3N4/PVA@alginate indicating successful incorporation of gC3N4, PVA into the ternary gC3N4/PVA@ alginate beads.
The gC3N4/PVA@alginate beads composite’s elemental composition and chemical phase were investigated using X-ray photoelectron spectroscopy (XPS).
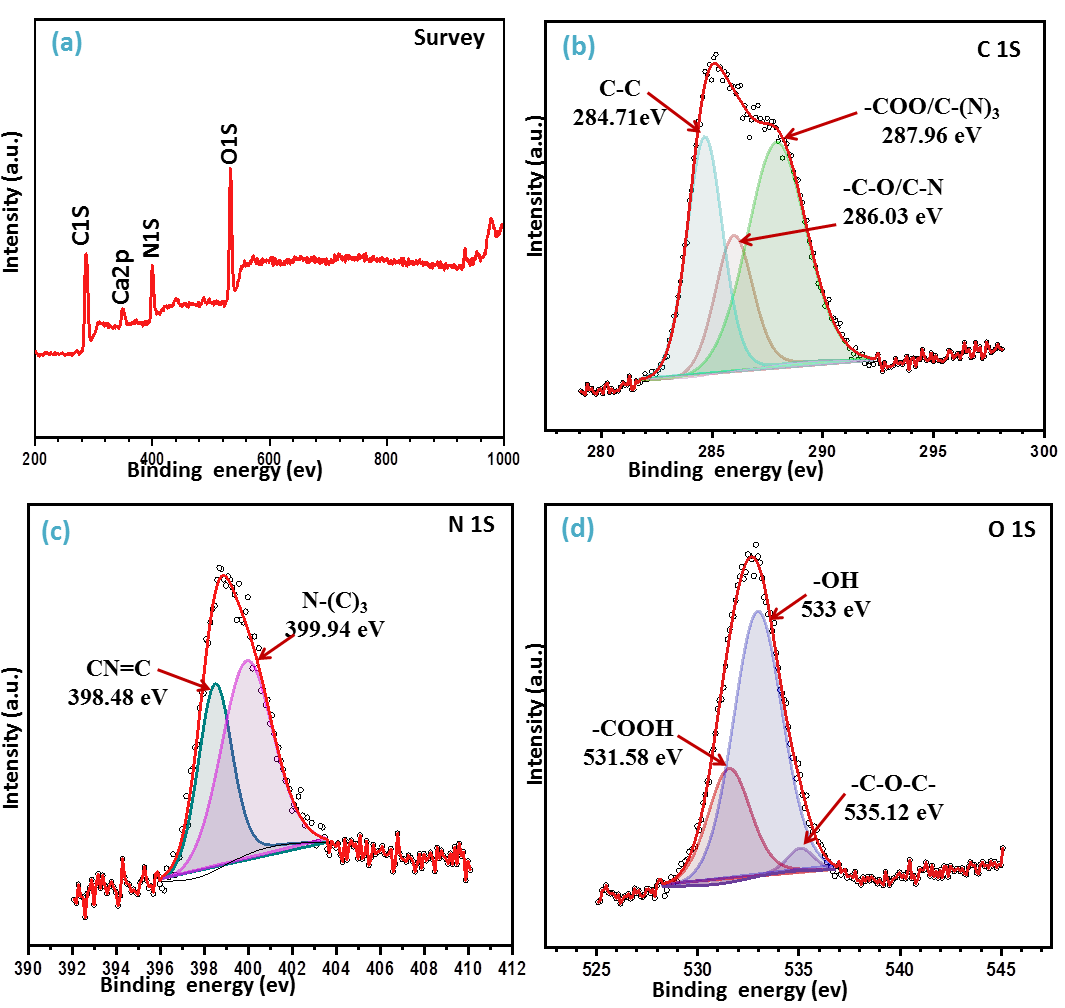
According to Figure 4a survey spectrum of gC3N4/PVA@ alginate, ternary adsorbent beads consist of the C, Ca, N, and O [44, 45] components which improve the absence of impurities. Three peaks at 284.71 eV, 286.03 eV, and 287.96 eV in the high-resolution XPS spectra of C 1s are directed in Figure 4b and can be related to integrated sp2 C–C bonds, sp2-hybridized carbon of C-O and C-N, and sp3-coordinated carbon bonds of C-OO and C-N3 from the gC3N4/PVA@ alginate surfaces, respectively [31, 44]. As shown in Figure 4c, the N 1s peaks at 398.48 eV and 399.94 eV were attributed to sp2-boned N, which belongs to and triazine rings (CN=C) groups and the tertiary nitrogen N–(C)3, respectively [46]. In reference to O1s Figure 4d, three peaks were identified at 5321.58, 533, and 535.12 eV, correspondingly attributed to the –COOH, –OH, and C–O–C groups [30]. The effective production of gC3N4/PVA@alginate ternary beads was verified by XPS.
Evaluation of Adsorption Efficiency in Comparison
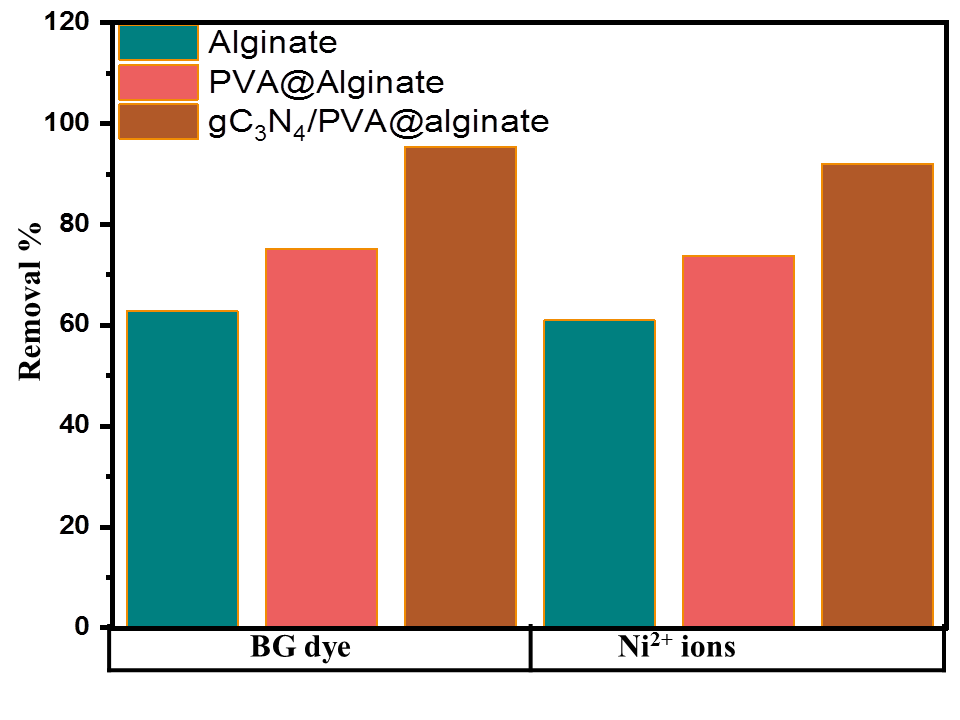
At starting Ni2+ and BG dye levels of 25 mg/L and sorbent doses of 1 g/L for dried alginate, PVA@alginate, and gC3N4/PVA@alginate beads, a comparison of the adsorption capabilities has been investigated as a function of time. According to Figure 5, BG dye was eliminated by 62.8%, 75.2%, and 95.4% while Ni2+ ions were remediated to 61%m
73.8%, and 92% by alginate, PVA@alginate, and gC3N4/PVA@ alginate beads, respectively. These results indicate that the incorporation of exfoliated gC3N4 and PVA into alginate beads improves its efficiency toward the remediation of dye and heavy metal, which owing to the addition of more function groups and adsorption sites. Thus, all additional adsorption tests using gC3N4/PVA@alginate beads were conducted for different sorption factors.
Response Surface Methodology
Employing central composite design (CCD), researchers can examine how several sorption parameters, like PH and adsorbent dosages, affect brilliant green BGdye and the percentage of Ni2+ ions disposed with gC3N4/PVA@alginate beads. CCD is a statistical and computational method that is useful for data modeling, experimental modeling, and assessing the impact of different factors. The primary benefit of CCD is that it minimizes the number of tests required, explains how the operating variables interact, and optimizes the adsorption circumstances [47]. The results of ANOVA for quadratic model are placed in Table 2.
| Adsorbate Source | Std. Dev. | DF | SS | MS | F-value | P-value | |
|---|---|---|---|---|---|---|---|
| BG dye | Model | 1.18 | 5 | 5609.4 | 1121.9 | 41.83 | 0.0056 |
| A: PH | 1 | 300 | 300 | 11.18 | 0.0442 | ||
| B:Asorbent dose (g/l) | 1 | 2557.9 | 2557.9 | 95.36 | 0.0023 | ||
| AB | 1 | 404 | 404 | 15.06 | 0.0303 | ||
| A2 | 1 | 933 | 933 | 34.78 | 0.0097 | ||
| B2 | 1 | 138 | 138 | 5.16 | 0.1078 | ||
| Residual | 3 | 80 | 27 | 41.83 | 0.0056 | ||
| Core Total | 8 | 5689.94 | |||||
| Ni2+ | Model | 0.21 | 5 | 246 | 49 | 11.16 | 0.0373 |
| A: PH | 1 | 6.7 | 6.7 | 1.51 | 0.3066 | ||
| B:Asorbent dose (g/l) | 1 | 145 | 145 | 32.94 | 0.0105 | ||
| AB | 1 | 0.1 | 0.1 | 0.0218 | 0.8921 | ||
| A2 | 1 | 41 | 41 | 9.28 | 0.0556 | ||
| B2 | 1 | 5.5 | 5.5 | 1.24 | 0.3463 | ||
| Residual | 3 | 13 | 4.4 | ||||
| Core Total | 8 | 260 | 4.4 |
Table 2: ANOVA analysis of response surface for removal of toxic heavy metal (Ni+2) and brilliant green (BG) by gC3N4/PVA@ algina
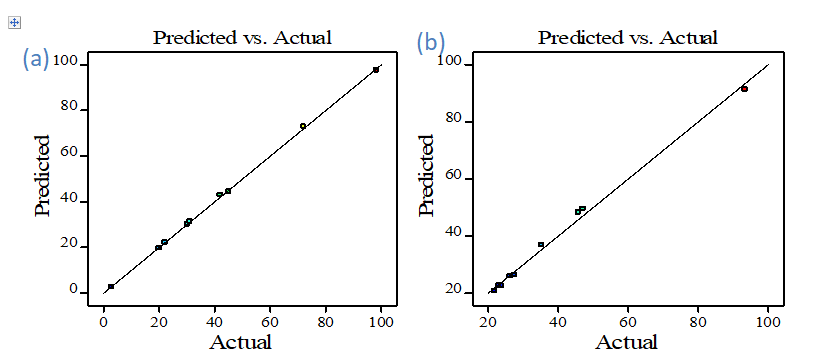
The degree of freedom (DF), which relates to the overall values employed across the most recent statistical computations that change freely, is a component of an ANOVA investigation. In addition to mean squares (MS), which are linked to an SS split with its appropriate DF and used to compute the F-ratio, the sum of squares (SS) is a computational technique used to evaluate the dispersion of data sets and determine whether data might be matched to a function. A very significant regression model is justified by a lowering P-value (probability) and an increasing F-value, which is a proportion between the model’s mean square and residual error. While numbers˃ 0.05 also have a large impact, the likelihood numbers̃ 0.05 have a non-significant impact. R2 is a regression coefficient that evaluates the correlation between observed and predicted data analytically. Another indicator of fitness is adjusted R2, which adjusts the R2 values for outcome in the style using the degrees of freedom computation [48]. In accordance to the adjusted R2 outcomes (0.962 & 0.954, respectively), the model R2 outcomes show good worth for the removal of BG dye and Ni2+ ions by gC3N4/ PVA@alginate beads (R2 = 0.985 and 0.949, respectively). This suggests that the model suggests astonishingly acceptable outcomes to anticipate a response. By measuring the probability value (0.0056 and 0.0373 for both BG dye and Ni2+ ions, respectively), which ˂ 0.05 indicated that models have been significant, the model F-values (41.83 and 1.16 for BG dye and Ni2+ ions, respectively) demonstrated that statistical analysis has been relevant. Figure 6 displays the expected results versus actual BG dye and Ni2+ removal percentage by gC3N4/PVA@alginate beads findings. The results were found to be evenly distributed close to the straight line, indicating an amazing correlation between the anticipated and real output results.
Combined Influence of Ph with the Adsorbent Doses and Adsorbent Surface Charge
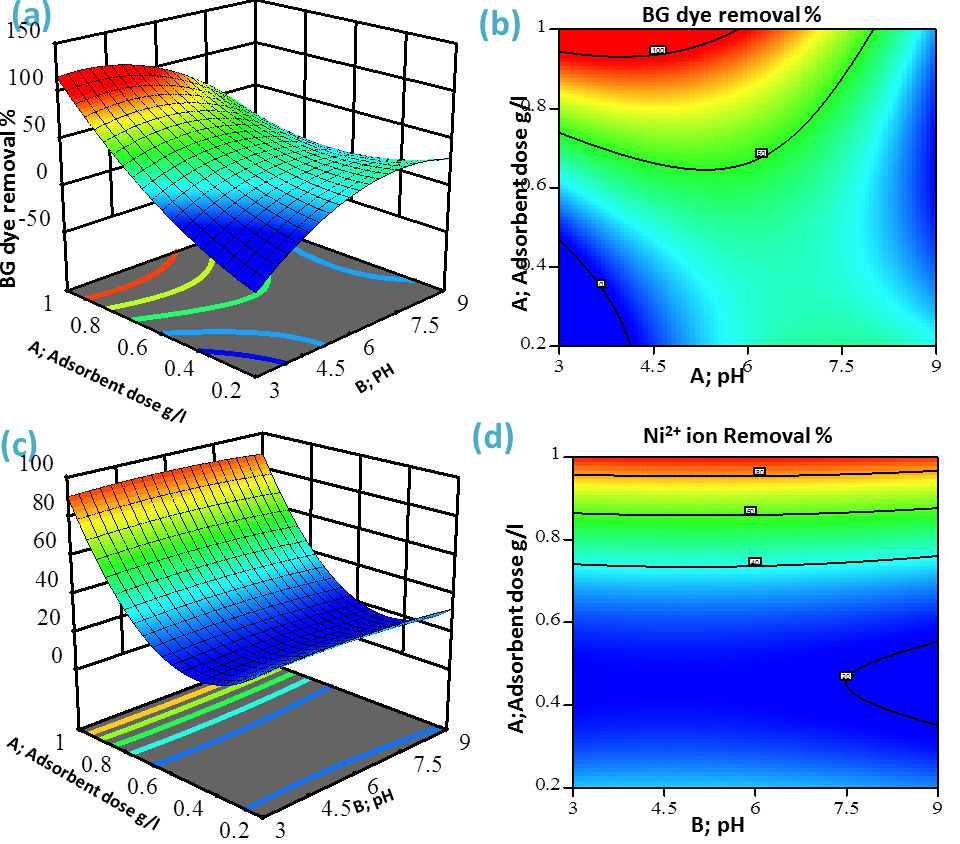
Figures 7(a-d) shows the dual impact of PH and adsorbent dosages on the elimination percentage of BG dye and Ni2+ ions 3D surface plots. The effects of PH on BG dye and Ni2+ ions sorption ranged from 3-9 at 298 K with initial concentrations of 50 mg/L and reaction time of 4 and 5 hours for BG and Ni2+, respectively, because changes in PH have a significant impact on the adsorbent surface-active groups. Using the adsorbent’s surface charge at a specific pH
level, the mechanism underlying pH-based dye removal may
explain [47]. The remediation of pollutants increased as the
pH increased reaching ideal PH values of 7.5 and 6 for BG dye
and Ni2+ ion, respectively. There are two possible sorption
mechanisms (i)chemical reaction among the reactive
compounds in BG or Ni2+ ions and the –NH, -NH2, -COOH
and -OH groups of gC3N4/PVA@alginate beads, which causes
these individuals to adsorb on the outermost layer, and (ii)
the mechanism of electrostatic interaction between the
protonated and deprotonated divides of the adsorbent with
the BG dye or Ni2+ ions. The gC3N4/PVA@alginate beads’s
surface is protonated at pH < 7.5, as seen below:
OH− + H+→ OH2 + (12)
COOH- + H+ → COOH2
$$ \begin{array}{l} \mathrm {O O H} ^ {-} + \mathrm {H} ^ {+} \rightarrow \mathrm {C O O H} _ {2} ^ {+} (1 3) \\ \mathrm {N H} ^ {-} + \mathrm {H} ^ {+} \rightarrow \mathrm {N H} _ {2} ^ {+} (1 4) \\ \mathrm {N H} _ {2} ^ {-} + \mathrm {H} ^ {+} \rightarrow \mathrm {N H} _ {3} ^ {+} (1 5) \\ \end{array} $$ NH2 +/ NH3 +/COOH2 +/OH2 + + BG+, Ni2+ → NH2 +/ NH3 +/ COOH2 +/OH2 +… BG+, Ni2+ (repulsion) The BG dye and Ni2+ ion adsorption improved progressively at pH values of 7.5 and 6, where deprotonation takes place and free nitrogen and oxygen is released from the gC3N4/PVA@alginate bead surface. This increases adsorption by generating electrostatic attraction with the cations.
OH−→ O− + H+ (16)
COOH−→ COO− + H++ (17) NH-→ + H++ (18) NH2 -→+ H2 + + (19) COO− /O− + BG+, Ni2+→ COO− /O−… BG+, Ni2+ (attraction) (20) A higher pH should lead to more BG dye and Ni2+ ion adsorption because the adsorbent has more negatively charged surface sites, which creates electrostatic attraction [49, 50, 51].
However, more adsorbent surface area and active sites were made available as the dose rose. Also, the findings shown in Figures 7a-d indicate that raising the adsorbent dose from 0.2 to 1 g/L increased the removal percentage to 98.3% and 93.42% for BG and Ni2+, respectively. As adsorbent dosage rises, function binding groups are more prevalent on the sorbent surficial layer, which can be explained by a rise in the adsorbent’s surface area and active sites [52]. The model demonstrated the optimal conditions for the remediation of BG dye Ni2+ ions by gC3N4/PVA@alginate beads were an adsorbent dose of 1 g/L with PH of 7.5 and 6 for BG and Ni2+ respectively, with actual removal 98.3% and 93.42%, for BG and Ni2+, Furthermore, the maximum adsorption capabilities for BG and Ni2+ were determined to be 45.3 and 38.71 mg/g, respectively. Based on the ideal conditions that the RSM/ CCD developed model produced, additional adsorption experiments were conducted.
Effect of Contact Time on the Adsorption Capacity and Kinetics Study
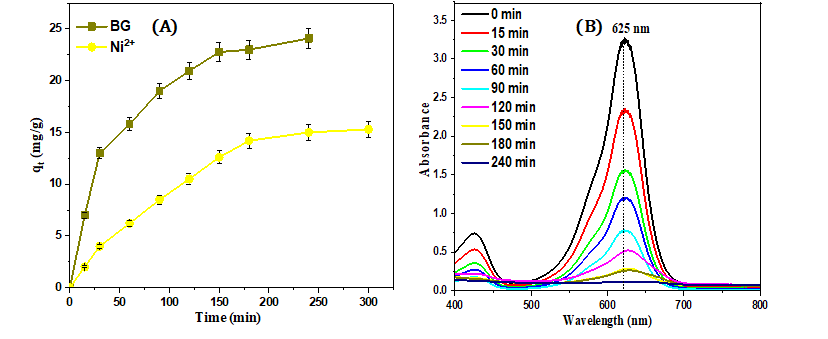
At an initial concentration of 25 ppm and an adsorbent dose of 1g/L for both BG and Ni2+, with PH values of 7.5 and 6 for BG and Ni2+, respectively, the removal effectiveness of gC3N4/PVA@alginate beads concerning contact time was investigated. Figure 8a demonstrates how adsorption on gC3N4/PVA@alginate beads increases the elimination of nickel and BG dye over time. Because BG dye and Ni2+ ions had a greater possibility of being adsorbed by binding active sites. Because most of the adsorbent sites were saturated, the removal capacities for the adsorption of BG dye and Ni2+ ions grew more slowly and progressively from 60 to 90 to 180 minutes, after 180 minutes, no change in removal capacities was seen.
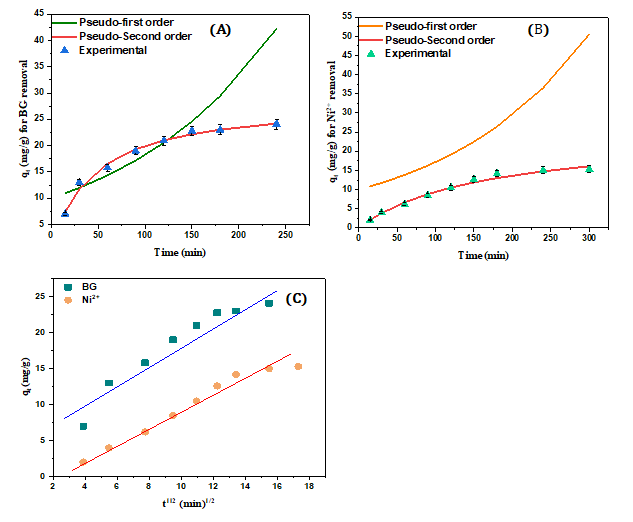
Additionally, Figure 8b displays the UV-visible spectra of brilliant green dye solutions following varying adsorption times with gC3N4/PVA@alginate beads; the bands at 625 nm exhibit a decrease in intensity, indicating that they have been removed by adsorption. With removal capabilities of 24.09 and 15.3 mg/g for BG dye and Ni2+ ions, respectively, the removal efficiency reached equilibrium at 240 and 300 minutes. Pseudo-1st order, pseudo-2nd order, and fickian diffusion law kinetic models have been examined using the kinetic study results of the adsorption equilibrium time study with the ideal parameters of brilliant green dye and nickel ions sorption behavior evaluated with the response surface methodology. Table 3 discusses the outcomes that were achieved.
| Kinetics Model | Kinetics Parameters | BG | Ni2+ |
| Pseudo-first order | R2 | 0.93 | 0.832 |
| Pseudo-first order | K1(min-1) | 0.0138 | 0.0023 |
| Pseudo-first order | qe,cal(mg/g) | 42.2 | 50.53 |
| Pseudo-Second order | R2 | 0.997 | 0.97 |
| Pseudo-Second order | K2(g/mg min) | 0.0008 | 0.00024 |
| Pseudo-Second order | qe,cal(mg/g) | 24.2 | 16.08 |
| Intra particle diffusion | R2 | 0.927 | 0.965 |
| Intra particle diffusion | K1(mg/g min0.5) | 1.431 | 1.079 |
| Intra particle diffusion | X | 4.119 | 1.709 |
Table 3: Kinetic parameters of pseudo-first order, pseudo – second order and fickian diffusion law kinetic for sorption of Brilli
Kinetic designs have been used to analyze data and identify the mechanism underlying the sorption phenomena. Figures 9 A,9B shows the graph of the pseudo-1st order, pseudo-2nd design linearized kinetic equation for both BG and Ni2+ gC3N4/PVA@alginate beads that are best fitted with pseudo–2nddesign, which has high correlation coefficient values R2 (0.997 & 0.970). It was suggested that a chemical reaction between sorbent and BG dye, Ni2+ occurred during adsorption, involving active sites in the gC3N4/PVA@alginate beads surface that incorporated valance forces by sharing or transferring electrons. Low correlation coefficient values for both BG and Ni2+ were shown with pseudo-1st order design R2 values of 0.930 and 0.832, respectively [53, 54].
The R2 values (0.927 and 0.965) of graphing qt against t0.5 toward removal of both BG dye and Ni2+ ions with gC3N4/PVA@alginate, respectively, for the Fickian intra- particle diffusion model shown in Figure 9c suggest that intra-particle diffusion design plays a significant role in degrading BG dye and Ni2+ ions, which had intercepts of
4.119 and 1.709, respectively, that ≠ zero, indicating that the line does not pass through the origin and highlighting the importance of other adsorption mechanisms in addition to the rate-controlling step of the intra-particle diffusion model [55].
Effect of the Initial BG Dye and Ni2+ Concentration on the Adsorption Capacity and Isothermal Study
The starting dosage has a direct impact on the rate of adsorption and is an essential variable in adsorption investigations. The direct relationship amongst an adsorbent surface’s accessible binding sites and the concentration of either BG dye or Ni2+ ions determines the impact of the initial BG dye and Ni2+ ions concentration factor [56].
At starting concentrations of 5, 15, 25, 40, 50, and 60 for BG dye and 25, 50, 100, 150, 200, 250, and 300 mg/L for Ni2+ ions, pH of 7.5 and 6 for both respectively, and adsorbent dose of 1g/L, at 298 K, Figures 10a,10b illustrates the effect of BG dye and Ni2+ ion adsorption by gC3N4/PVA@alginate beads. The sorption capacity increased from 4.7 to 46 mg/g when the concentration of BG dye raised from 5 to 60 mg/L, and from 15.3 to 42 mg/g when the concentration of Ni2+ ions raised from 25 to 300 mg/L. This represents a result of the adsorbents’ limited quantity of active binding sites. Following a specific level, the adsorbents became saturated and all of these active sites were packed with dye and metal ion molecules. However, the quantity of dye molecules rose as the concentration gradient grew, increasing the pushing force between the liquid and solid phases, which aids in overcoming the dye molecules’ resistance to mass transition [57]. Sorption isotherms are crucial for solid-liquid adsorption systems because they provide insight into the adsorption capacity at a given temperature and clarify the interaction between the adsorbent and adsorbate. The dual models that are frequently utilized to explain equilibrium adsorption are the Freundlich and Langmuir isotherm models [58].
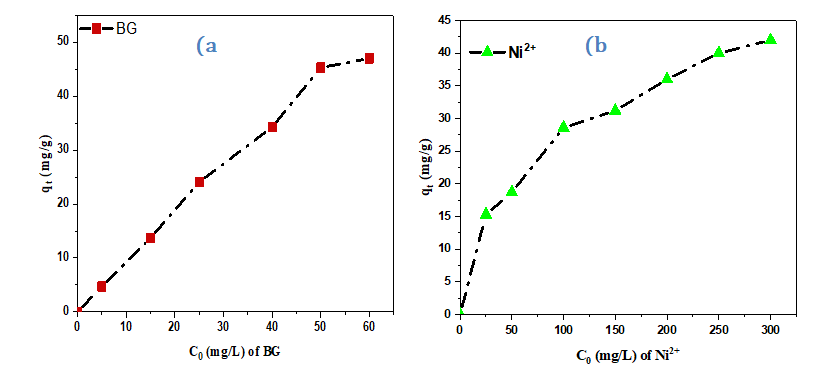
Figure10: The effect of the initial concentration of (a) BG and (b) Ni2+ on adsorption capacity of gC3N4/PVA@alginate beads.
The Langmuir and Freundlich isothermal models have been used to assess the obtained data in Figures 10a,b. Table 4 lists the correlation coefficient R2 values and variables determined for the two equilibrium styles. Additionally, Figures 11a & 11b displays the fitting of the two isothermal equations for the sorption of both BG and Ni2+ by gC3N4/ PVA@alginate beads.
| Adso rbate | Langmuir Model | Freundlich Model | |||||
|---|---|---|---|---|---|---|---|
| Q (mg/g) L | K (L/ L mg) | R2 | R L | K f (mg/g) | n | R2 | |
| BG | 47.1 | 2.76586 | 0.934 | 0.598 | 13.8452 | 1.73 | 0.818 |
| Ni2+ | 44.2 | 41.5472 | 0.979 | 0.802 | 6.88652 | 3.09 | 0.976 |
Table 4: Isothermal parameters of Langmuir and Freundlich for sorption of B dye and Ni+2 ions onto gC3N4/PVA@ alginate beads.
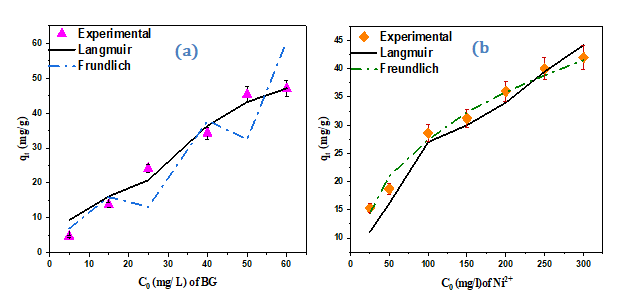
The correlation coefficient amounts suggested a stronger fit for Langmuir than Freundlich styles to describe BG dye sorption into gC3N4/PVA@alginate beads, based on the outcomes shown in Table 4. According to the Langmuir perspective, BG dye is absorbed uniformly by the monolayer on the surface of the bead with equivalent sorption energy and no dye-molecule interaction [59]. On the other hand, the sorption of Ni2+ suggested that the Freundlich and Langmuir models suit gC3N4/PVA@alginate beads well. This implies that the monolayer integrates both homogeneous and heterogeneous Ni2+ ion sorption onto the bead’s surface with equal sorption energy and without molecule interaction. Furthermore, the heterogeneity styles are improved by good fitting to the Freundlich model, and the Freundlich
parameters are found to confirm that the values of n for BG and Ni2+ are 1.73 and 3.09, respectively, suggesting that the sorption is favorable. The KL value for the sorption of Ni2+ ions was greater than that of BG, suggesting that Ni2+ binds to the bead surface more strongly than it does to BG dye. The dimensionless constant known as the separation factor (RL), which used to notify the impacts of Langmuir isotherma [60].
$$ \mathrm {R} _ {\mathrm {L}} = 1 / \left(1 + \mathrm {K} _ {\mathrm {L}} \mathrm {C} _ {0}\right) \tag {21} $$
Where C0 (mg/L) is the starting concentration and KL
(L/mg) is the Langmuir constant related to sorption energy.
According to the RL value, sorption properties are irreversible
when RL = zero, linear when RL =1, and undesired when RL is
< 1. Sorption mechanism of BG dye and Ni2+ is advantageous
for the Langmuir isothermal concept, as indicated by the
computed RL in Table 4, which is 0.598 and 0.802 for both,
respectively.
Effect of Temperature on the Adsorption Capacity and Thermodynamic Study
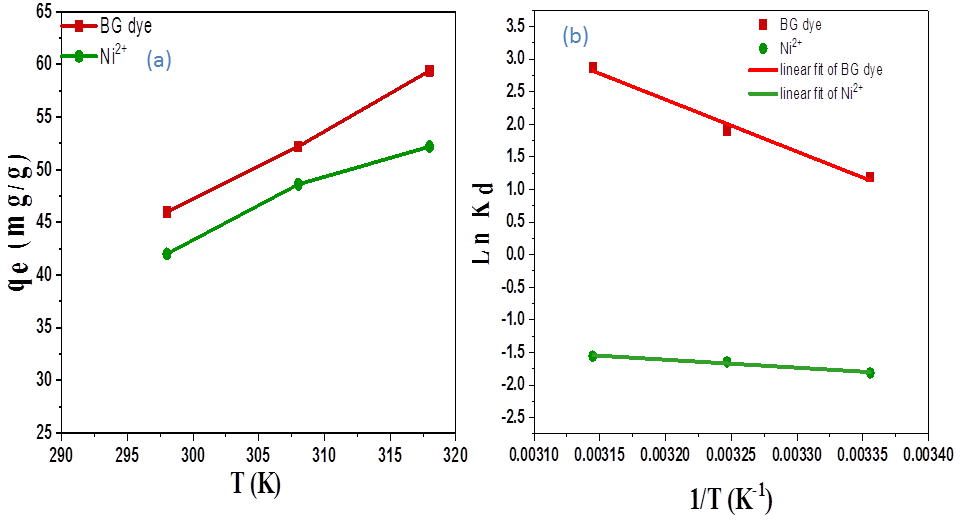
The adsorption temperature, which varied between 298 K and 318 K, at optimal pHs of 7.5 and 6, an adsorbent dosage of 1g/L for BG dye and Ni2+ ions, respectively, experiments were done utilizing a 20 mL contaminated solution containing 60, 300 ppm of BG dye and Ni2+ for six hours. The temperature has a significant effect on BG dye and Ni2+ ions uptake, according to the dynamic data results in Figure 12a at three distinct temperatures. The adsorption mechanism is positively impacted by temperature, as evidenced by the adsorption capacity increasing with temperature, reaching 56.8 and 52.2 mg/g for BG dye and Ni2+ ions, respectively, at 318K. The existence of active sites for sorption is increased and the porosity of the adsorbent pore volume is improved by temperature. As the temperature rises, the viscosity of the solution reduces, increasing the rate at which the adsorbate diffuses through the adsorbent’s inner and outer pores. This implies that the process of adsorption is endothermic [61]. To find out more about the energy changes and if an adsorption process is spontaneous, thermodynamic analysis can be used to study any sorption phenomena. The Van’t Hoff equation was used to compute the thermodynamic parameters, such as Gibb’s free energy change (ΔG°), enthalpy change (ΔH°), and entropy change (ΔS°) beads.
Table 5 lists the thermodynamic data obtained by graphing lnKd versus 1/T in Figure 12b. An endothermic mechanism was proposed by the positive ΔH° amounts for BG dye and Ni2+ ions adsorption. Similarly, a significant ΔS° value for the adsorption of BG dye and Ni2+ suggests an increase in randomness at the solid–liquid interface throughout the adsorption process. Notwithstanding the large temperature range, BG dye adsorption showed negative ΔG° values, indicating spontaneous adsorption, but Ni2+ adsorption showed positive ΔG° values, indicating nonspontaneous adsorption onto gC3N4/PVA@alginate beads. The fact that ΔG° rose with temperature indicates that the mechanism can tolerate higher temperatures [62]initial dye concentration, adsorbent dose, the particle size of CHAC Z, agitation speed, temperature, and contact time was explored. The equilibrium adsorption data were analyzed using two widely applied isotherms: Langmuir, Freundlich. Best fits were found to be Freundlich isotherm. Langmuir adsorption capacity (Q m. Enthalpy change values larger than 0.04 kJ/mol are indicative of chemical adsorption but values less than 0.04 kJ/mol are indicative of physical adsorption, per published research. In this investigation, the enthalpy changes for the adsorption of BG dye and Ni2+ ions were 66.31 and 10.18 kJ/ mol, respectively. Thus, BG dye and Ni2+ ions adsorption onto gC3N4/PVA@alginate beads occurs by chemical adsorption.
| Pollutant | Temp. (K) | K d | ΔG° | ΔH° | ΔS° |
|---|---|---|---|---|---|
| (KJ/ mol) | (KJ/ mol) | (KJ/ mol/K) | |||
| BG dye | 298 | 3.285714 | -2.9473 | 66.31 | 0.232 |
| 308 | 6.692308 | -4.8678 | |||
| 318 | 17.75 | -7.6047 | |||
| Ni2+ ions | 298 | 0.162791 | 4.4975 | 10.18 | 0.0192 |
| 308 | 0.193317 | 4.2083 | |||
| 318 | 0.210654 | 4.1179 |
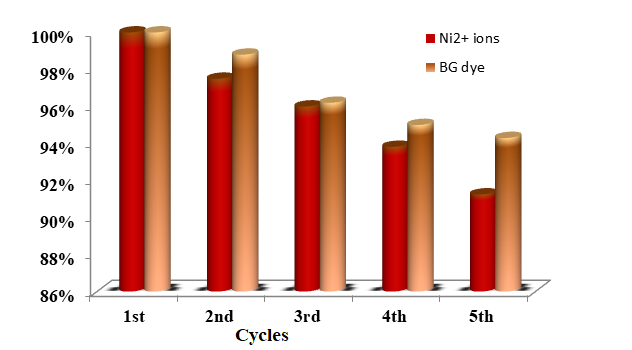
Regeneration and Stability Investigations
From an economic perspective, adsorbents’ regeneration and long-term stability are important characteristics. Experiments for reuse & desorption using ethanol solution were conducted to examine the regeneration and stability of gC3N4/PVA@alginate beads for the adsorption of BG dye and Ni+2 ions. The BG dye and Ni+2 ion removal capacities in the first cycle were 46 and 42 mg/g, respectively. The adsorption capacity was assessed for every cycle, and by relating it to the initial run (adsorption capacity being 100%), the relative adsorption capacity was calculated in percentage terms. Figure 13 illustrates the recuperation of gC3N4/PVA@ alginate beads for five cycles, it was obvious that following the fifth adsorption-desorption goes the efficiency of gC3N4/ PVA@alginate beads maintained with high absorbing capacity for both BG dye and Ni+2 ions 94.3% and 91.25% i.e. 43.37 and 38.32 mg/g, respectively, without significant loss. This demonstrates that the gC3N4/PVA@alginate bead’s functional groups were not significantly lost and that the composite adsorbent exhibits long-term stability, allowing for post-recycling reuse.
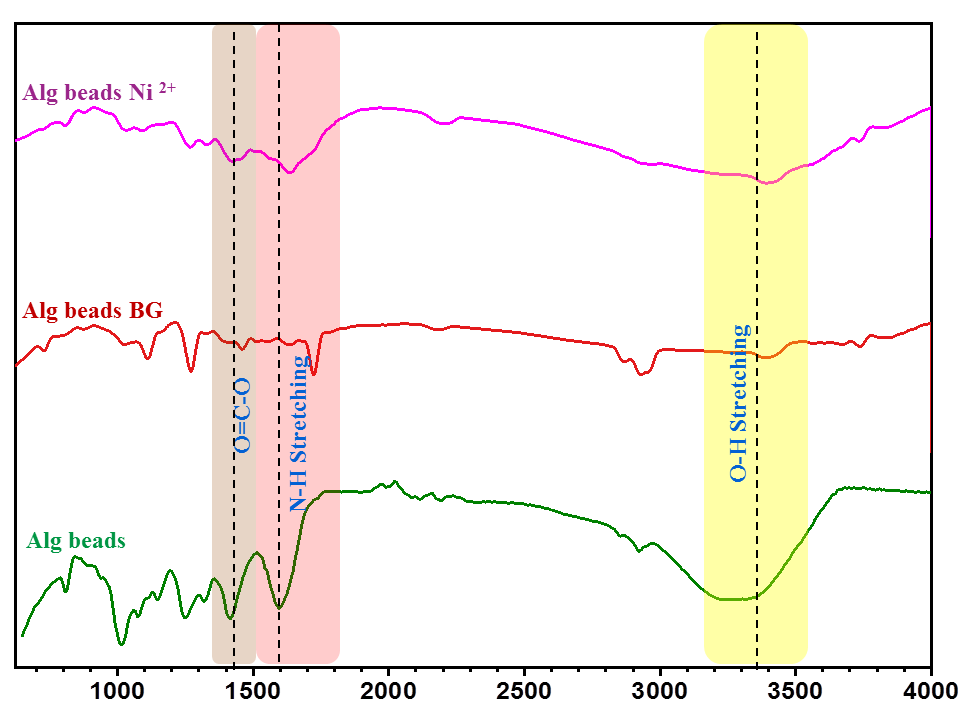
Mechanism of BG dye and Ni 2+ Elimination from Water
To clarify the potential eradication mechanism for BG dye and Ni2+ ions adsorption by gC3N4/PVA@alginate beads, FTIR analysis was performed before and after BG dye and Ni2+ions sorption and displayed in Figure 14. A discernible shift in the location of particular peaks in the sorbent was observed upon adsorption. Following the adsorption procedure, the broad peak at 3415 cm-1 that corresponded to the O-H group and the band assigned to the carboxylate groups (O=C-O-) in the alginate polymer at 1635 and 1420 cm−1 were displaced.
Furthermore, there was a shift in the position of the N-H group peak at 1630 cm-1 in gC3N4, indicating that additional processes helped to increase the removal of BG dye and Ni2+ ions. Electronegative oxygen in O=C-O-groups found in alginic beads can connect with heavy metal cations firmly by electrostatic attraction force. However, by complexation, N centers in gC3N4 can draw in the heavy metal ions. It is noteworthy that the oxygen centers found in the alginic beads’ hydroxyl (-OH) and carboxylate (-COO-) groups are strong, easily accessible sites that can interact with positively charged BG dye and Ni2+ ions through cation exchange and chelation.
Conclusion
In the current study, BG dye and Ni+2 ions waa remediated from their aqueous solutions by adsorption onto gC3N4/PVA@alginate beads. Sorption variables were optimized utilizing Response surface methodology (RSM), indicating optimal remediation performance of 98.3% and 93.42%, for either BG dye and Ni+2, respectively, at PH of 7.7, 6 with sorbent dosages of 1 g/L. Also, either BG dye and Ni+2 sorption obeyed pseudo-2nd order concepts, and was a good match for the Langmuir model for BG, while Ni+2 sorption was strongly matched for Langmuir and Freundlich isothermal concepts, Furthermore, there was a rise in randomness thus the sorption process was spontaneous with endothermic characteristics.
References
-
Khezami L (2023) Remediation of heavy metals from water using CaTiO3@g-C3N4 nanocomposite as adsorbent: Synthesis, performance, kinetic modeling and mechanistic insights. Diam Relat Mater 136: 109996.
-
Ghiloufi I, Ghoul J, Modwi A, Mir L (2016) Ga-doped ZnO for adsorption of heavy metals from aqueous solution. Mater Sci Semicond Process 42: 102-106.
-
Modwi A, Ghanem MA, Mayouf AM, Houas A (2018) Lowering energy band gap and enhancing photocatalytic properties of Cu/ZnO composite decorated by transition metals. J Mol Struct 1173: 1-6.
-
Modwi A, Idriss H, Khezami L, Albadri A, Ismail M, et al. (2023) Stripping of Cu Ion from Aquatic Media by Means of MgY2O4@g-C3N4 Nanomaterials. Water 15: 1188.
-
Bessadok J, Khezami L, Modwi A, Ben A, Mokraoui S, et al. (2023) Hybrid CaO@MgO@g-C3N4 nanostructure as a cost-effective sorbent for hazardous organic dyes activated by additives. Diam Relat. Mater 133: 109757.
-
AbuMousa R, Khezami L, Ismail M, Ben A, Modwi A, et al. (2022) Efficient Mesoporous MgO/g-C3N4 for Heavy Metal Uptake: Modeling Process and Adsorption Mechanism. Nanomater 12: 3945.
-
Khan K, Lu Y, Khan H, Zakir S, Khan S, et al. (2013) Health risks associated with heavy metals in the drinking water of Swat, northern Pakistan. J Environ Sci 25: 2003-2013.
-
Cataldo S, Gianguzza A, Milea D, Muratore N, Pettignano A (2016) Pb(II) adsorption by a novel activated carbon alginate composite material. A kinetic and equilibrium study. Int J Biol Macromol 92: 769-778.
-
Wang S, Terdkiatburana T, Tade MO (2008) Adsorption of Cu(II), Pb(II) and humic acid on natural zeolite tuff in single and binary systems. Sep Purif Technol 62: 64-70.
-
Li L, Breedveld V, Hess D (2012) Creation of superhydrophobic stainless steel surfaces by acid treatments and hydrophobic film deposition. ACS Appl Mater Interfaces 4: 4549-4556.
-
Yeganeh M, Afyuni M, Khoshgoftarmanesh A, Khodakarami L, Amini M, et al. (2013) Mapping of human health risks arising from soil nickel and mercury contamination. J Hazard Mater, pp: 244-245.
-
Soni S, Bajpai P, Mittal J, Arora C (2020) Utilisation of cobalt doped Iron based MOF for enhanced removal and recovery of methylene blue dye from waste water. J Mol Liq 314: 113642.
-
Saif R, Munir M, Ashfaq M, Rashid N, Nazar M, et al. (2013) Adsorption of Brilliant Green dye from aqueous solution onto red clay. Chem Eng J 228: 54-62.
-
Soni S, Bajpai P, Mittal J, Arora C (2020) Utilisation of cobalt doped Iron based MOF for enhanced removal and recovery of methylene blue dye from waste water. J Mol Liq 314.
-
Modwi A, Basith N, Ghoniem M, Ismail M, Ben A, et al. (2023) Efficient Pb(II) adsorption in aqueous solution by hierarchical 3D/2D TiO2/CNNS nanocomposite. Mater Sci Eng B 289: 116191.
-
Palanisamy G, Bhuvaneswari K, Srinivasan M, Vignesh S, Elavarasan N, et al. (2021) Two-dimensional g-C3N4 nanosheets supporting Co3O4-V2O5 nanocomposite for remarkable photodegradation of mixed organic dyes based on a dual Z-scheme photocatalytic system. Diam Relat Mater 118: 108540.
-
Modwi A, Elamin MR, Idriss H, Elamin NY, Adam FA, et al. (2022) Excellent Adsorption of Dyes via MgTiO3@g-C3N4 Nanohybrid: Construction, Description and Adsorption Mechanism. Inorganics 10: 210.
-
Guo J, Chen T, Zhou X, Zheng T, Xia W, et al. (2019) Preparation and Pb (II) adsorption in aqueous of 2D/2D g-C3N4/MnO2 composite. Appl Organomet Chem 33: e5119.
-
Zhang J, Zeng L, Qiao Z, Wang J, Jiang X, et al. (2020) Functionalizing Double-Network Hydrogels for Applications in Remote Actuation and in Low- Temperature Strain Sensing. ACS Appl Mater Interfaces 12: 30247-30258.
-
Narita Y, Nishi K, Matsuyama T, Ida J (2024) Reusable isotype heterojunction g-C3N4/alginate hydrogel spheres for photocatalytic wastewater treatment. RSC Adv 14: 20898-20907.
-
Bahrami Z, Akbari A, Eftekhari-Sis B (2019) Double network hydrogel of sodium alginate/polyacrylamide cross-linked with POSS: Swelling, dye removal and mechanical properties. International Journal of Biological Macromolecules 129: 187-197.
-
Shen W, Qing-Da A, Xiao ZY, Zhai SR, Hao JA, et al. (2020) Alginate modified graphitic carbon nitride composite hydrogels for efficient removal of Pb(II), Ni(II) and Cu(II) from water. International Journal of Biological Macromolecules 148: 1298-1306.
-
Senasu T, Lorwanishpaisarn N, Hemavibool K, Nijpanich S, Chanlek N, et al. (2023) Construction of g-C3N4/BiOCl/ CdS heterostructure photocatalyst for complete removal of oxytetracycline antibiotic in wastewater. Separation and Purification Technology 306: 122735.
-
Zeng Z, Li K, Yuan T, Liang Y, Yang J, et al. (2021) Facile synthesis of BiOCl/g-C3N4 heterojunction via in situ hydrolysis of Bi nanospheres: a high-efficiency visible- light-driven photocatalyst. Journal of Materials Science: Materials in Electronics 32: 9972-9989.
-
Hao D, Huang Q, Wei W, Bai X, Ni BJ (2021) A reusable, separation-free and biodegradable calcium alginate/ g-C3N4 microsphere for sustainable photocatalytic wastewater treatment. Journal of Cleaner Production 314: 128033.
-
Dai H, Ou S, Liu Z, Huang H (2017) Pineapple peel carboxymethyl cellulose/polyvinyl alcohol/mesoporous silica SBA-15 hydrogel composites for papain immobilization. Carbohydrate Polymers 169: 504-514.
-
Jose J, Al-Harthi MA, AlMa’adeed MAA, Dakua JB, De SK (2015) Effect of graphene loading on thermomechanical properties of poly(vinyl alcohol)/starch blend. Journal of Applied Polymer Science 132(16): 41827.
-
Liu D, Bian Q, Li Y, Wang Y, Xiang A, et al. (2016) Effect of oxidation degrees of graphene oxide on the structure and properties of poly (vinyl alcohol) composite films. Composites Science and Technology 129: 146-152.
-
Huang W, Shen J, Li N, Ye M (2015) Study on a new polymer/graphene oxide/clay double network hydrogel with improved response rate and mechanical properties. Polymer Engineering and Science 55(6): 1361-1366.
-
Wang G, Wang X, Huang L (2017) Feasibility of chitosan- alginate (Chi-Alg) hydrogel used as scaffold for neural tissue engineering: a pilot study in vitro. Biotechnology & Biotechnological Equipment 31(4): 766-773.
-
Maghfirah A, Fahma F, Lisdayana N, Yunus M, Kusumaatmaja A, et al. (2021) On the Mechanical and Thermal Properties of Poly(Vinyl Alcohol) – Alginate Composite Yarn Reinforced with Nanocellulose from Oil Palm Empty Fruit Bunches. Indonesian Journal of Chemistry 22(1): 114-125.
-
Kamaci UD, Peksel A (2021) Enhanced Catalytic Activity of Immobilized Phytase into Polyvinyl Alcohol-Sodium Alginate Based Electrospun Nanofibers. Catalysis Letters 151: 821-831.
-
Zeng Z, Li K, Yuan T, Liang Y, Yang J, et al. (2021) Facile synthesis of BiOCl/g-C3N4 heterojunction via in situ hydrolysis of Bi nanospheres: a high-efficiency visible- light-driven photocatalyst. Journal of Materials Science: Materials in Electronics 32: 9972-9989.
-
Xu H, Yan J, She X, Xu L, Xia J, et al. (2014) Graphene- analogue carbon nitride: Novel exfoliation synthesis and its application in photocatalysis and photoelectrochemical selective detection of trace amount of Cu2+. Nanoscale 6(3): 1406-1415.
-
Hu R, Wang X, Dai S, Shao D, Hayat T, et al. (2015) Application of graphitic carbon nitride for the removal of Pb(II) and aniline from aqueous solutions. Chemical Engineering Journal 260: 469-477.
-
Almulaiky YQ, Al-Harbi SA (2022) Preparation of a Calcium Alginate-Coated Polypyrrole/Silver Nanocomposite for Site-Specific Immobilization of Polygalacturonase with High Reusability and Enhanced Stability. Catalysis Letters 152: 28-42.
-
Younis SA, Motawea EA, Moustafa YM, Lee J, Kim KH (2020) A strategy for the efficient removal of chlorophenols in petrochemical wastewater by organophilic and aminated silica@alginate microbeads: Taguchi optimization and isotherm modeling based on partition coefficient. Journal of Hazardous Materials 397: 122792.
-
Sun Y, Qi X, Li R, Xie Y, Tang Q, et al. (2020) Hydrothermal synthesis of 2D/2D BiOCl/g-C3N4 Z-scheme: For TC degradation and antimicrobial activity evaluation. Optical Materials 108: 110170.
-
Zhang X, An D, Feng D, Liang F, Chen Z, et al. (2019) In situ surfactant-free synthesis of ultrathin BiOCl/g-C3N4 nanosheets for enhanced visible-light photodegradation of rhodamine B. Applied Surface Science 476: 706-715.
-
Hong J, Hwang DK, Selvaraj R, Kim Y (2019) Facile synthesis of Br-doped g-C3N4 nanosheets via one- step exfoliation using ammonium bromide for photodegradation of oxytetracycline antibiotics. Journal of Industrial and Engineering Chemistry 79: 473-481.
-
Majumdar A, Ghosh U, Pal A (2021) Novel 2D/2D g-C3N4/ Bi4NbO8Cl nano-composite for enhanced photocatalytic degradation of oxytetracycline under visible LED light irradiation. J Colloid Interface Sci 584: 320-331.
-
Jingyu H, Ran Y, Zhaohui L, Yuanqiang S, Lingbo Q, et al. (2019) In-situ growth of ZnO globular on g-C3N4 to fabrication binary heterojunctions and their photocatalytic degradation activity on tetracyclines. Solid State Sci 92: 60-67.
-
Ding H, Liu Z, Zhang Q, He X, Feng Q, et al. (2022) Biomass porous carbon as the active site to enhance photodegradation of oxytetracycline on mesoporous g-C3N4. RSC Adv 12: 1840-1849.
-
Han N, Xu Q, Beyene G, Zhang Q (2020) Enhanced photocatalytic activity over g-C3N4/(BiO)2(OH)xCl2−x Z-scheme heterojunction. Appl Surf Sci 521: 146464.
-
Bediako JK, Lin S, Sarkar AK, Zhao Y, Choi YW, et al. (2020) Benignly-fabricated crosslinked polyethylenimine/ calcium-alginate fibers as high-performance adsorbents for effective recovery of gold. J Clean Prod 252: 119389.
-
Nie YC, Yu F, Wang LC, Xing QJ, Liu X, et al. (2018) Photocatalytic degradation of organic pollutants coupled with simultaneous photocatalytic H2 evolution over graphene quantum dots/Mn-N-TiO2/g-C3N4 composite catalysts: Performance and mechanism. Appl Catal B Environ 227: 312-321.
-
Ali HR, Motawea EA (2021) Ternary Photodegradable Nanocomposite (BiOBr/ZnO/WO3) for the Degradation of Phenol Pollutants: Optimization and Experimental Design. ACS Omega 6: 22047-22064.
-
Younis SA, Motawea EA, Moustafa YM, Lee J, Kim K (2020) A strategy for the efficient removal of chlorophenols in petrochemical wastewater by organophilic and aminated silica @ alginate microbeads : Taguchi optimization and isotherm modeling based on partition coefficient. J Hazard Mater 397: 122792.
-
Wijeyawardana P, Nanayakkara N, Gunasekara C, Karunarathna A, Law D, et al. (2022) Removal of Cu, Pb and Zn from stormwater using an industrially manufactured sawdust and paddy husk derived biochar. Environ Technol Innov 28: 102640.
-
Chaudhry SA, Khan TA, Ali I (2016) Adsorptive removal of Pb(II) and Zn(II) from water onto manganese oxide- coated sand: Isotherm, thermodynamic and kinetic studies, Egypt. J Basic Appl Sci 3: 287-300.
-
Muhammad HN, Mahmud E, Huq AKO, Yahya RB (2016) The removal of heavy metal ions from wastewater/ aqueous solution using polypyrrole-based adsorbents: a review. RSC Adv 6: 14778-14791.
-
Tang R, Dai C, Li C, Liu W, Gao S, et al. (2017) Removal of Methylene Blue from Aqueous Solution Using Agricultural Residue Walnut Shell: Equilibrium, Kinetic, and Thermodynamic Studies. J Chem 2017: 8404965.
-
Swaminathan S, Muthumanickkam A, Imayathamizhan NM (2015) An effective removal of methylene blue dye using polyacrylonitrile yarn waste/graphene oxide nanofibrous composite. Int J Environ Sci Technol 12: 3499-3508.
-
Gharibzadeh F, Kalantary RR, Nasseri S, Esrafili A, Azari A (2016) Reuse of polycyclic aromatic hydrocarbons (PAHs) contaminated soil washing effluent by bioaugmentation/biostimulation process. Sep Purif Technol 168: 248-256.
-
Mashabi RA, Khan ZA, Elwakeel KZ (2022) Chitosan- or glycidyl methacrylate-based adsorbents for the removal of dyes from aqueous solutions: a review. Mater Adv 3: 5645-5671.
-
Mehmood A, Bano A, Fahim S, Parveen R, Khurshid S (2015) Efficient removal of crystal violet and eosin B from aqueous solution using Syzygium cumini leaves: A comparative study of acidic and basic dyes on a single adsorbent. Korean J Chem Eng 32: 882-895.
-
Baidya KS, Kumar U (2021) Adsorption of brilliant green dye from aqueous solution onto chemically modified areca nut husk. South African J Chem Eng 35: 33-43.
-
Tan IAW, Ahmad AL, Hameed BH (2008) Adsorption of basic dye on high-surface-area activated carbon prepared from coconut husk: Equilibrium, kinetic and thermodynamic studies. J Hazard Mater 154: 337-346.
-
Ghosh S, Bakshi M, Mahanty S, Gaine T, Bhattacharyya S, et al. (2021) Spatiotemporal distribution of potentially toxic elements in the lower Gangetic delta and their implications for non-carcinogenic health risk management. Geosci Lett 8: 1-14.
-
Umesh AS, Puttaiahgowda YM, Thottathil S (2024) Enhanced adsorption: Reviewing the potential of reinforcing polymers and hydrogels with nanomaterials for methylene blue dye removal. Surfaces and Interfaces 51: 104670.
-
Zhao S, Zhou F, Li L, Cao M, Zuo D, et al. (2012) Removal of anionic dyes from aqueous solutions by adsorption of chitosan-based semi-IPN hydrogel composites. Compos Part B Eng 43: 1570-1578.
-
Khodaie M, Ghasemi N, Moradi B, Rahimi M (2013) Removal of Methylene Blue from Wastewater by Adsorption onto ZnCl2 Activated Corn Husk Carbon Equilibrium Studies. J Chem 2013: 383985.
- Plant Diversity, Regeneration Dynamics, and Socio-Ecological Impacts at the Forest-Savanna Transition Zone, Cameroon
- Bird Community, Feeding Guilds and Habitat Associations Along the Proposed River Dibombe Hydropower and Transmission Line Project in Nkam and Moungo Divisions, Cameroon
- Plant Diversity and Carbon Storage Potential Across Different Land Use Types in Infrastructure Development Landscapes in Cameroon: Implications for no Net Loss of Biodiversity
- The Negative Implications of Using Cell Phones on Human Health and Environment
- A Comprehensive Survey of Population Ecology in Insects
- Evaluation of Coiled Tubing Limitations to Drill Out Frac Plugs