Dimensions of Urban Poverty in Slum Neighbourhoods of Yenagoa City, Bayelsa State
Urban poverty and slum development have become a reoccurring social phenomenon in urban societies of developing economies. The study aims to assess urban poverty in slum neighbourhoods of Yenagoa City, Bayelsa State. The objectives include identifying the characteristics of slum dwellers in the study area; ascertaining the dimension of urban poverty in the study area; assessing the impact of urban poverty in slum neighbourhoods and identifying measures aimed at reducing urban poverty in the study area. The study adopted a mixed-methods research approach. A total of 397 sample sizes were arrived at using the Taro Yamane formula at a 5% precision level. Only 380 questionnaires were retrieved, collated, and analysed using univariate statistics. The study found that urban poverty is high in the study leading to an increase in crime, insecurity, and poor tenure security affecting residents’ environmental conditions. The study recommends that the Bayelsa State Government and local governments should collaborate with international donor agencies and NGOs to provide appropriate skills acquisition and training programmes, and institute schemes to develop the skills of residents to be self-reliant, provide basic infrastructure, facilities, and services in all the neighbourhoods to improve the quality of life and encourage residents to diversify into other sources of income. The government should collaborate with security agencies and communities to establish community policing to improve security architecture and crime prevention strategies in the study area.
Introduction
Globally, the population of people living in urban areas has continued to increase over the years. The United Nations Department of Economic and Social Affairs projects that Africa and Asia together will account for 86 per cent of all growth in the world’s urban population over the next four decades as against the paltry 30% in 1950. Also, this unprecedented increase will pose new challenges in terms of jobs, housing, and infrastructure. It is projected that Africa’s urban population will increase from 414 million in 2010 to over 1.2 billion by 2050, while that of Asia will soar from 1.9 billion to 3.3 billion. The largest increase in urban population is expected in India, China, Nigeria, the United States of America and Indonesia. Over the next four decades, India will add another 497 million, China-341 million, Nigeria-200 million, USA-103 million, and Indonesia-92 million to their urban population [1].
The quest for better living conditions and opportunities has led to the massive influx of people to the urban areas thereby increasing the rate of urbanization. Inevitably, cities or urban areas have become centres of attraction for people seeking brighter futures and better opportunities. In a world where more than half of the population lives in cities, poverty is increasingly an urban phenomenon. As more people migrate into cities which are often ill-equipped to handle the influx, experts are trying to find ways of defining and measuring urban poverty. Their findings influence humanitarian policy and programs as well as basic services, including health, water and sanitation and education. Ironically, most of the urban poor find themselves in a slum environment. This is mostly because most of these migrants are poor and cannot afford to pay for accommodation in a better environment [2].
Yenagoa, an emerging city and the capital of Bayelsa State, Nigeria is gradually witnessing this trend of urbanization. Bayelsa state being the only homogeneous Ijaw state and Yenagoa serving as its capital has become the prime attraction of Ijaw people around the world. According to Professor Yemi Osibanjo, “Bayelsa State is the Jerusalem of the Ijaw nation”. There has been a significant surge in population into the capital territory of the State which is the only location where employment opportunities are available [3].
However, the expectations of most of these migrants are far from being met. The provision of infrastructure, housing, urban services, and employment opportunities has not been met with the surge in population. While the civil service accounts for the highest source of formal employment in Yenagoa, there is a sharp increase in the informal sector which also includes the provision of housing. Recently, it has been observed that there is an increase in the number of informal settlements or slums in Yenagoa.
Also, the economic fortunes of the state have experienced a nosedive, especially with the rising cost of living largely contributed by the COVID-19 pandemic and the recent removal of fuel subsidies. The National Bureau of Statistics [4] recently released the highly anticipated multidimensional poverty index report. The report put Nigeria’s poverty index at 0.257, with about 133 million people being multi-dimensionally poor. Based on the data, Bayelsa State is ranked as the second poorest state in Nigeria with a Multidimensional Poverty Index (MPI) of 0.401 and 2.61 million poor people, only second to Sokoto State with a poverty index of 0.409 and 5.81 million poor people [4].
In Yenagoa today, the average cost of decent accommodation with modern facilities and a decent environment is beyond the reach of the urban poor. Thus, the poor are forced to settle in slum environments where basic facilities such as good roads, pipe-borne water, and electricity are lacking, and the cost of housing is relatively cheap. Also the upsurge in population due to migration when the state was created further exacerbated the development of slums and its antecedents such as crime, prostitution, drug abuse, cultism and other social vices within Yenagoa metropolis. Community enclaves such as Amarata, Ovom, Onopa, Swali and Yenagoa main town amongst others became the centre of attraction as they accommodated the early migrants. Also, most of the local enclaves developed organically and lack basic infrastructure such as good roads, drainages, pipe-borne water and basic services. Due to the deplorable environmental conditions of these settlements, they have become the choice areas of the urban poor who cannot afford accommodation in other parts of the city. The rise of urban slums and the incidence of poverty and its manifestation have become a subject of concern and as such, it becomes necessary for researchers to assess urban poverty in slum neighbourhoods of Yenagoa city.
Statement of the Problem
Urban poverty is increasingly becoming synonymous with slum neighbourhoods as many urban dwellers who could not afford comfortable living quarters due to the high cost of building their own houses, high house rent and the exorbitant cost of acquisition of urban land have sought refuge in slum neighbourhoods of Yenagoa city [5].
Bayelsa State has been rated as the second poorest state in Nigeria based on the National Bureau of Statistics Multidimensional Poverty Index Report 2022 [4]. Yenagoa, the capital city of Bayelsa State has also witnessed a continued increase in population over the years due to rural-urban migration or urban–urban migration and most of these new migrants are found in the slum neighbourhoods which are extensions of the community settlements.
It has been observed over the years that more people are trapped within these slum neighbourhoods even when they wish to relocate due to their low income. There is also an increase in the rate of crimes such as snatching of phones, theft, cultism, prostitution, and lack of employment opportunities within these neighbourhoods which has further affected the economic fortunes of these areas as most investors are relocating to other parts of the city.
Aim and Objectives of the Study
Aim of the Study
This study aims to assess the dimensions of urban poverty in slum neighbourhoods of Yenagoa City, Bayelsa State.
Objectives of the Study
The Specific Objectives are to
- Identify the characteristics of slum dwellers in the study area.
- Ascertain the dimension of urban poverty in the study area.
- Assess the impact of urban poverty in slum neighbourhoods of Yenagoa City.
- Identify measures aimed at reducing urban poverty in slum neighbourhoods of Yenagoa City.
Scope of the Study
In the geographical context, the study will be limited to selected communities or neighbourhoods that fall within the immediate 5km radius of the Yenagoa Capital territory as shown in Figure 1. The communities with this scope are Akaba, Ogu, Obogoro, Famgbe, Yenaka, Bebelibiri, Yenagoa, Swali, Azikoro, Agbura, Amarata, Ovom, Onopa, Ekeki, Okaka, Yenezue-Epie and Kpansia.-Epie. The content scope includes examining the characteristics of slum dwellers, ascertaining the dimension of urban poverty, assessing the impact of urban poverty on slum neighbourhoods and identifying measures aimed at reducing urban poverty in slum neighbourhoods of Yenagoa. The temporal scope will include the extent or spatiotemporal area of the study area.
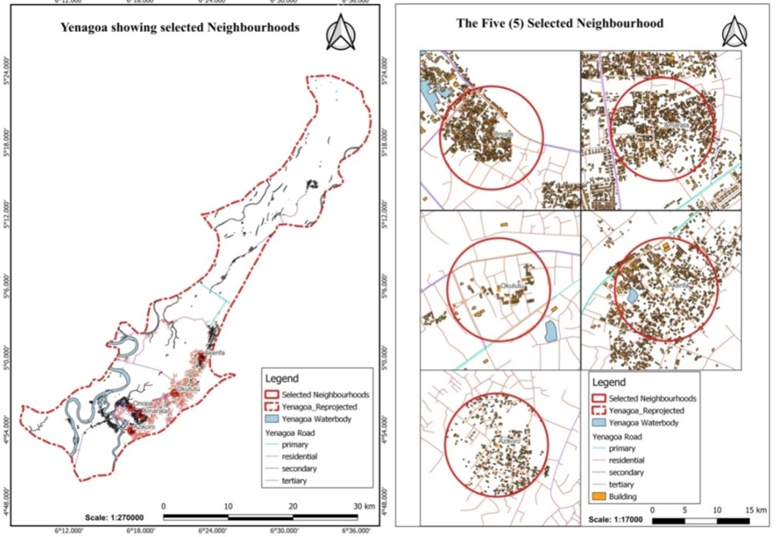
Source: Fieldwork, 2023.
Literature Review
In an analysis of urban poverty in slum neighbourhoods, researchers have come up with some theories that attempt to link urban poverty and slum neighbourhoods. This research depends on two theoretical frameworks which are the theory of marginality and the Theory of Dependency The theory of marginality was first introduced by Robert Park in 1928 and it attempts to explain the reason why poor migrants are mostly found in slum environments. Marginalization is a symbol that refers to processes by which individuals or groups of people are kept at or pushed beyond the edges of society. The term outsides may be used to refer to those individuals or groups who are marginalized [6] positing that due to the theory of marginality, the phenomenon of the growth of poor settlement is widely spread in urban areas due to the migration of rural people to cities with different rural lifestyles contrary to the city lifestyle.
Mostly, these migrants who are in search of greener pastures are found in slum areas where there is a lack of basic amenities and poor housing and environmental conditions. In cities, due to their poor economic level, they gather with people who are in the same conditions, then isolate themselves in poor settlements, in slums that are parochial and in a rustic lifestyle. In this socially isolated place, they are destitute, with inhuman environmental conditions and do not have permanent jobs [6]. The theory of dependency or dependency theory is an approach to understanding economic underdevelopment that emphasizes the constraints imposed by the global political and economic order. The theory was first proposed in the late 1950s by the Argentine economist and statesman Raúl Prebischin 1950 and the theory gained prominence in the 1960s and 70s. Concerning the emergence of slums and perpetuation of poverty in the less developed economies, the global west has continued to impoverish the poorer countries where the resources are sourced from. From the viewpoint of the theory of dependency, the phenomenon of poor urban settlements is a form of capitalist penetration product of rural communities which are structurally “lame” when compared to urban conditions [6]. Capital here in this case includes both technology and humans (skill/labour).
The presence of penetration especially in the form of capitalism experienced in rural areas results in the emergence of minority capitalist elites who dominate the fields of agricultural land ownership, knowledge, technology, information, and power, while most members of the community lack access to these resources. Before the capitalist penetration occurs in the countryside, the relationship between landlords and farm workers is quite harmonious, in the form of high personal and social relations rather than economic relations which tend to be rational and straightforward due to the capitalist penetration. The broad effect of capitalist penetration is increasing unemployment in rural areas because if they want to get involved, they must have access to capital, land, skills, information, and power, while the majority has nothing, so it leads to dependency on the elite living in the countryside.
The situation and conditions in rural areas force them to find a way out, such as migrating to big cities to find a job and boost their income. In other words, there is a push factor, that is, unemployment and poverty in rural areas, whereas another factor is the pull factor, which is interest and hope arising from rapid urban growth as a cause of their moves to cities. Because most migrants are not equipped with adequate skills, expertise, and education, it is difficult for them to get into formal economy fields, such as state companies, private companies, or government bureaucratic offices in big cities.
Impact of Urban Poverty
Urban poverty has significant effects on slum generation in neighbourhoods. In Nairobi, Kenya, Park [7] in his article titled; Poverty Trap; Neighbourhood and Violent Victimisation and Offending in Nairobi Kenya observed that there exists a robust and positive relationship between residential stability and personal victimisation, in addition to a positive association between household-level residential stability and family violence, shows support for the negative effects associated with poverty traps in urban Africa. Neighbourhood characteristics matter for public safety in Nairobi, but frameworks for examining neighbourhood effects must consider the context of chronically poor neighbourhoods in urban areas.
The European Union Urban Innovative Action, observes that poverty has multiple contributing factors such as unemployment or working in precarious jobs, low income/ pensions and inadequate social benefits, low educational attainment, health inequalities, high housing costs/poor housing quality and location, barriers to access to quality services, childcare and education and inefficient service delivery, consistent rise in the level of household costs such as food, utility, transportation expenses, the rise of single households/single parents, discrimination and low level of participation in community and public life.
They further assert that these factors tend to combine with others to create a vicious cycle of poverty that is structural and visibly concentrated spatially in many EU cities and neighbourhoods. This point is particularly important - poverty not only exacerbates social differences between people and groups; but also leads to significant effects on the way that cities define their spaces and zones. As poverty increases, so too does the risk of concentration of the urban poor in deprived areas, which are characterised by social segregation, stigmatization of a wider section of citizens, reduced mobility, limited access to credit, housing deprivation and not only environmental degradation but reduced public spending on its prevention.
Methodology
The study adopted a mixed-method research approach. The Yenagoa Master Plan [8] was delineated into a Total Planning Area comprising an area 15km radius of the city centre and an immediate action area 5km radius. A total of 17 homogenous communities were identified to be within the immediate action area of a 5km radius. These communities include Akaba, Ogu, Obogoro, Famgbe, Yenaka, Bebelibiri, Yenagoa, Swali, Azikoro, Agbura, Amarata, OvomOnopa, Ekeki, Okaka, Yenezue- Epieand Kpansia.-Epie.
The Sample population is drawn randomly from five communities that fall within a 5km radius of the city centre. The simple random sampling technique was adopted in the selection of 30% of these neighbourhoods or communities which include Yenagoa, Swali, Ovom, Amarata and Azikoro. The disaggregated 1991 population figures for these communities were projected to 2023. The 1991 census figure for the target communities is 23477. The projected population figure of 57,283 was arrived at using the exponential equation with a growth rate of 2.83% suggested by the National Population Commission [9] as shown in Table 1.
| Sampled Communities | 1991 Population of Sampled | Projected Population 2023 | No. of Household | No. of Questionnaires Administered |
|---|---|---|---|---|
| Amarata | 3,371 | 8,225 | 82 | 57 |
| Azikoro | 2,543 | 6,205 | 1,241 | 43 |
| Swali | 2,520 | 6,148 | 1,229 | 42 |
| Ovom | 6,320 | 15,421 | 3,084 | 107 |
| Yenagoa | 8,723 | 21,284 | 4,256 | 148 |
| Total | 23,477 | 57,283 | 9,892 | 397 |
Table 1: Projected Population and the Household Sampled. Source: Fieldwork, 2023.
Results and Findings
Socio-economics Characteristics of Residents
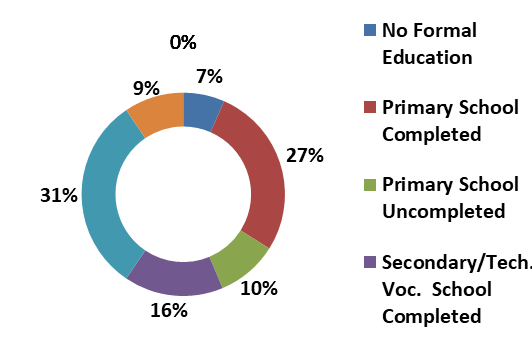
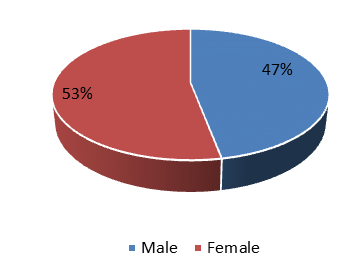
Figure 2 shows that 53% of the respondents are female while 47% are men implying there are more females than males in the study area. Also, the marital status reveals that 50% of the respondents are married and 29% are single. The age distribution also signifies a very active population with respondents that fall within the age bracket 20-30 years, 31-40 years, and 41-50 years accounting for 23.68%, 26.32% and 24.47% as shown in Table 2. The study further reveals that the educational level of respondents as shown in Fig. 3 reveals that literate respondents represent 31% of the respondents who have completed tertiary education and 27% have completed primary school. Only 7% of the respondents did not have any formal education. In terms of employment, the study reveals that 70.78% of the respondents are employed which includes self-employed, employed, and retired while 28.42% are unemployed. The modal occupation of respondents is trader/businessman/ woman with 32.11% followed by Civil Servants at 18.16% implying a very high informal sector. The respondents are also engaged in other occupations as shown in Table 2.
The study further reveals in Table 3 that the modal income level of respondents is also below the national minimum wage with 32.11% of respondents earning an average monthly income of less than N30,000.00 and 18.42% earning between N 30,001- N 60,000. Only 0.53% earn above N 150,000, per month. This goes to show that the poverty level of respondents in the study area is on the high side.
| S/No. | Age | N | % |
|---|---|---|---|
| 1 | Under 20 | 24 | 6.32 |
| 2 | 20-30 | 90 | 23.68 |
| 3 | 31-40 | 100 | 26.32 |
| 4 | 41-50 | 93 | 24.47 |
| 5 | 51-60 | 53 | 13.95 |
| 6 | 61+ | 20 | 5.26 |
| Total | 380 | 100 |
Table 3: Age of Respondents. Source: Fieldwork, 2023
Source: Fieldwork, 2023.
| Income (Naira) | N | % |
|---|---|---|
| Less than N30,000 | 122 | 32.11 |
| N30,001-N60,000, | 70 | 18.42 |
| N60,001-N90,000, | 53 | 13.95 |
| N90,001-N120,000, | 27 | 7.11 |
| N120,001-N150,000, | 7 | 1.84 |
| N150,001-N180,000, | 2 | 0.53 |
| N180,001-N210,000, | 2 | 0.53 |
| N210,001+ | 0 | 0 |
| No response | 97 | 25.53 |
| Total | 380 | 100 |
Table 2: Income Level of Respondents (Naira). Source: Fieldwork, 2023.
Dimension of Urban Poverty in the Study Area
Baharoglu and Kessides [10] outlined five dimensions of poverty which include income and consumption, health, education, security, and empowerment. Respondents were assessed based on their accessibility and affordability of basic needs.
Access to Health Facility
With regards to respondents’ access to health facilities, the study reveals that 61.32% have access to health facilities, and they travel an average distance of between 100m - 400m to reach the health facilities. Further observations from the various communities further affirm the availability of health centres in all the selected communities with high patronage by residents within the study area. This is indeed within the neighbourhood threshold for the location of facilities.
Also, 37.37% said they cannot afford the health facility while 33.68% said they can afford the services of the health facility. Interestingly, the Bayelsa state government and the Federal government operate health insurance schemes in the state which are open to the public where residents can register by paying a monthly fee of Two Thousand Naira (N2,000) only and become part of the program. The schemes cover a family of six persons which include the husband and his wife and four children below the age of 18 years. Unfortunately, the data shown in Figure 4 shows that most of the respondents did not register in the health scheme as 54.21% of the respondents have no health insurance and only 25% have health insurance. It can be deduced here that while this program is open to all, poverty has hindered most respondents from being part of the scheme thereby affecting the respondents’ access to health facilities. Figure 5 shows the administrative building of the Bayelsa State Health Insurance Scheme (BHIS).
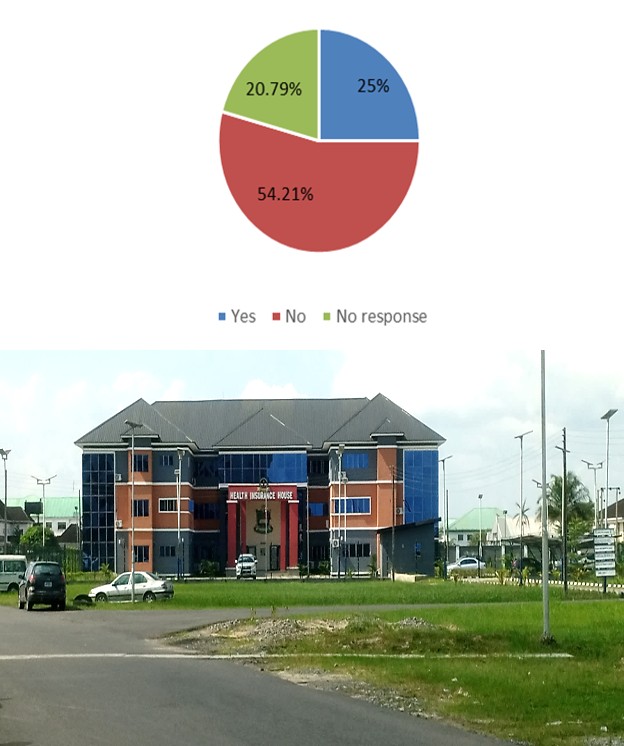
Plate 1: Approach view of the Bayelsa Health Insurance Office, State Secretariat Complex, Yenagoa. Source: Fieldwork, 2023.
Access to Educational Facility
Another dimension of urban poverty is the individual’s access to education. With regards to respondent’s access to education, the study reveals that 77.63% of the respondents have access to education while 19.74% said they don’t have access to education. A breakdown of the type of educational institutions attended by household members also reveals that respondents’ household members have access to both public primary and secondary at 28.49% and 20.54% respectively, while those that attend private primary and secondary account for 23.64% and 13.57% respectively. The study also reveals that the government has provided educational institutions in all the selected communities with a vocational and technical school recently established in the Swali community to train technical manpower in the state. Furthermore, the modal distance travelled to access the educational facility is between 100m-400m. This is also within the recommended distance for educational facilities in a neighbourhood. The study further reveals that 48.42% can afford the fees while another 40% cannot afford the school fees. The reasons forwarded by the respondents who cannot afford the institution include high school fees at 22.37% and low-income level at 59.47% as shown in Table 4. This further goes to show that the low income level has affected some of the respondents’ access to education. The Bayelsa State government also runs an educational loans Board that gives interest-free loans to students. However, only 4.47% of respondents have accessed the loan.
| Reason for Not Affording the Educational Facilities | N | % |
|---|---|---|
| Too Expensive fees | 85 | 22.4 |
| Low level of Income | 226 | 59.5 |
| High medical bills | 6 | 1.58 |
| Lack of security | 7 | 1.84 |
| High cost of transportation | 3 | 0.79 |
| No facility within the neighbourhood | 1 | 0.26 |
| Non-response | 52 | 13.7 |
| Total | 380 | 100 |
Table 4: Reasons for Not Attending Educational Institutions. Source: Fieldwork, 2023.
Income and Consumption
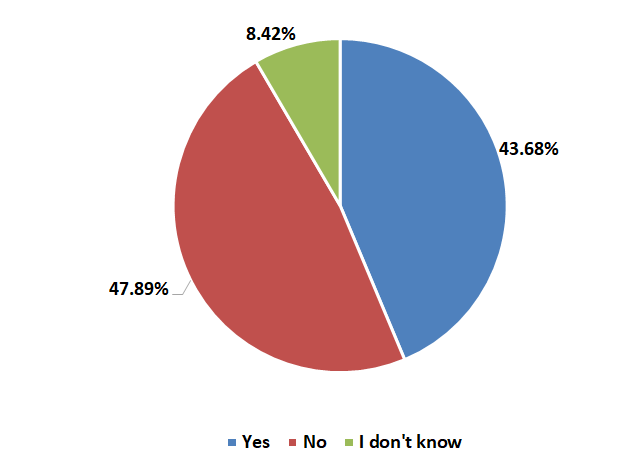
Available data in Table 3 shows the average monthly income levels of respondents in the study area. From the data obtained, the modal income range is less than N30, 000 which is followed by the income bracket of N30,000 – N60,000. It can therefore be deduced that the income level of the respondents in the study area is low. Already, the impact of the N30,000.00 minimum wage implemented in December 2019 has been grossly undermined by inflation and current economic realities which have further impoverished the citizens, especially slum dwellers. Access to Security and Tenure Security Another important dimension of urban poverty is the respondent’s access to security. Generally, security can be viewed as a state of being free or feeling secure from fear, anxiety, danger, and threats to humans and the environment. In this regard, respondents’ access to the security of life and property and the security of tenure is assessed. To assess the security of tenure, Figure 6 shows that 43.68% of respondents are landlords within the study area while 47.89% are tenants. However, the study also reveals that 56.32% of the buildings within the study area have no form of title documents over their property. Table 5 further shows that only 5% of the building has building plan approval and 16.84% have the Deed of Conveyance as their title document. This implies a very low tenure security which is one of the prominent features of slum neighbourhoods. Also, regarding the security of lives, the study reveals how poverty has contributed significantly to the prevalence of slums in the study area. From the data in Table 5, 27.89% of the respondents feel there is an increase in crime, cultism, and social vices. Consequently, this further reveals that the increase in crime is due to poverty. This shows a low level of security in the study area. In reaction to the respondents’ access to security, the state government has also intervened such that there is regular patrol by the government security outfit and the establishment of the community safety corps by the state government. Other interventions include the installation of solar streetlights in downtown Yenagoa have aided in improving security in the study.
Source: Fieldwork, 2023.
| Type of Title | N | % |
|---|---|---|
| Deed of conveyance | 64 | 16.84 |
| Power of attorney | 11 | 2.89 |
| C of O | 10 | 2.63 |
| Government allocation letter | 10 | 2.63 |
| Building plan approval | 19 | 5 |
| Temporary permit | 11 | 2.89 |
| Inheritance | 41 | 10.79 |
| None of the above | 214 | 56.32 |
| Total | 380 | 100 |
Table 5: Type of Land Title Available. Source: Fieldwork, 2023.
Access to Employment Opportunities and Empowerment
The study also revealed that in terms of access to employment opportunities in the study area is poor at 6.94%. Indeed, there are no industries located within the study area apart from the few informal sector activities such as trading.
Assess the Impact of Urban Poverty in Slums in the Study Area
The study shows that most of the respondents do not like the neighbourhood because the neighbourhood is a slum, which promotes insecurity, cultism, and prostitution. The study further shows that most of the respondents would like to relocate to better neighbourhoods. However, poverty has continued to hinder them from relocating as seen in Table 5 where 42.89% of the respondents said they cannot afford to pay rent in better neighbourhoods. Poverty has indeed negatively impacted slum neighbourhoods as revealed in Table 6. Also, 19% said that poverty has increased the crime rate and other social vices, 17.4% said it has led to overcrowding or encroaching on the right of way and more street trading 10.79% as observed in Figure 7.
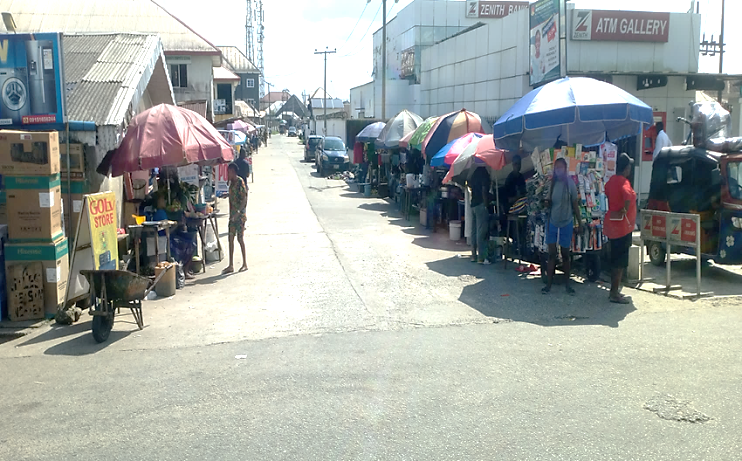
Plate 2: Traders Encroaching on an Access Road. Source: Fieldwork, 2023.
An assessment of the environmental and housing conditions also revealed that most of the buildings are rooming houses and the materials used are mostly sandscrete blocks as walls, corrugated roofing sheets, wooden doors, and GMP aluminium windows as seen in Also, the environment is in a poor condition as there is lack of proper access road without drainage as seen Figure 8.
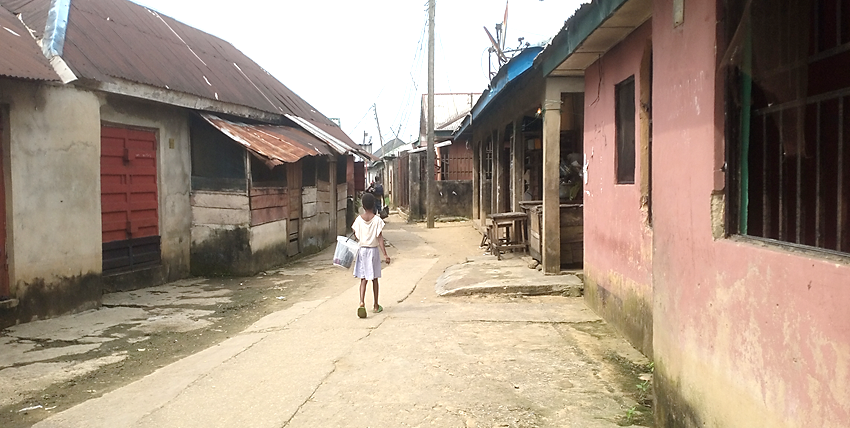
Plate 3: A View of an Access Road without Drainage.
Source: Fieldwork, 2023.
| Contribution of Poverty to Rising Slums in the Neighbourhood | N | % |
|---|---|---|
| It has led to more street trading | 41 | 7.4 |
| Building encroachment on government right of way (too close to the road) | 74 | 13.3 |
| Increase in crime, cultism and other social vices | 106 | 19 |
| Overcrowding/overdevelopment on plots of land | 97 | 17.4 |
| Increase in prostitution | 96 | 17.2 |
| Unfriendly neighbourhood | 93 | 16.7 |
| Police intimidation | 5 | 0.9 |
| No access road | 30 | 5.4 |
| No response | 15 | 2.7 |
| Total | 557 | 100 |
Table 6: Impact of Poverty on Slum Neighbourhoods. Source: Fieldwork, 2023.
Suggestions on Measure Aimed at Reducing Urban Poverty and Slums in the Study Area
To proffer a sustainable solution to reducing poverty in slum neighbourhoods, the respondents were further asked to suggest how they feel the major actors or stakeholders can contribute to reducing the problem of poverty and slums in the study area. The suggestions made are based on some key actors which include the private developer, community leaders, NGOs / CBOs, and the government. The suggestions include
- Sensitisation on the adherence of town planning regulations to reduce slums which can attract investment in the neighbourhood.
- The government should provide empowerment such as setting up capacity-building programmes and creating opportunities for members of the community.
- The government should provide education, especially in vocational education that will provide skills acquisitions which will promote self-reliance and reduce poverty in the study area.
- NGOs/CBOs/ Cooperatives can also engage the community in empowerment schemes and provision of starter packs for the beneficiaries.
- The respondents further suggest that the government should create job and empowerment opportunities and provide basic amenities.
- The respondents also suggested that the government should improve security in the neighbourhood to attract investment that will stimulate economic activities.
Conclusion
The study focused on an assessment of urban poverty in the slum neighbourhood of Yenagoa City, using some selected communities as the study area. The characteristics of slum dwellers were identified and further established that they are affected by urban poverty since they earn minimal income below the national minimum wage. The dimensions of poverty assessed in the study also reveal that the respondents have access to health care facilities and educational facilities, but poverty has also reduced most of the respondents from using the facility. The housing and environmental conditions were also observed to be poor, and poverty has further hindered most respondents from relocating to better neighbourhoods. The study further affirms that poverty has led to an increase in crime and criminality as well as insecurity of lives and poor tenure security as most property owner has no form of title documents over their landed property. Various suggestions were also made on how the various stakeholders can contribute to the reduction of poverty and improvement of the environment to enhance the liveability in the study area.
Recommendations
Based on the findings of the study, it is imperative that to reduce the incidence of urban poverty in slum areas, the following recommendations are hereby suggested:
- The Bayelsa State Government and urban communities should collaborate with Urban and Regional Planners in the designing and development of neighbourhoods to checkmate the emergence of slum development in the study area.
- The Bayelsa State Government and Yenagoa City Local Government Council should collaborate with urban communities to carry out urban renewal schemes and programmes in the affected neighbourhoods to improve residents’ living conditions, revitalise the local economy and social re-engineering of the communities to eliminate slum development.
- The government at the state and local levels should collaborate with international donor agencies and other NGOs to provide skills acquisition training programmes and schemes to develop the skills of residents to be self-reliant to have access to available employment opportunities in the city.
- Bayelsa State Government, Yenagoa City Local Government Council and other development agencies should form a development synergy to provide basic infrastructural facilities and services in the neighbourhoods to improve quality of life and encourage residents to diversify into other sources of income for economic sustainability.
- The Bayelsa State Government should collaborate with security agencies and communities to establish community policing to improve security architecture and crime prevention strategies in the study area.
References
-
Bakare GO (2014) Urbanisation, Urban Poverty, Slum and Sustainable Urban Development in Nigerian Cities: Challenges and Opportunities. Developing Country Studies.
-
The New Humanitarian (2012) Measure urban poverty. Aid and policy analysis.
-
Iyorakpo J (2015) Impact of rapid urbanization on environmental quality in Yenagoa Metropolis, Bayelsa state, Nigeria. European Scientific Journal 11.
-
National Bureau of Statistics (2022): Nigeria Multidimensional Poverty Index.
-
Pat-Mbano E, Nwadiaro ECC (2012) The rise of urban slum in Nigeria: Implications on the urbanLandscape. International Journal of Development and Management Review 7.
-
Mohammad AR, Sugiono S, Kistanto NH (2020) Theoretical Study of Poverty In Urban Slum Settlements. International journal of scientific & technology research 9(3): 1-5.
-
Parks MJ (2014) Urban Poverty Traps: Neighbourhoods and Violent Victimisation and Offending in Nairobi, Kenya. Urban Studies 51(9): 1812-1832.
-
Harcourt Adukeh and Associates (2004) Yenagoa Master Plan.
-
National Population Commision (2006) National Poulation Census. Abuja: National Population Commission, 422.
-
Baharoglu D, Kessides C (2002) Urban poverty: Macroeconomic and Sectoral Approaches, A Sourcebook for Poverty Reduction Strategies. In: Klugman J (Ed.), The World Bank Washington, USA, 2.
- Plant Diversity, Regeneration Dynamics, and Socio-Ecological Impacts at the Forest-Savanna Transition Zone, Cameroon
- Bird Community, Feeding Guilds and Habitat Associations Along the Proposed River Dibombe Hydropower and Transmission Line Project in Nkam and Moungo Divisions, Cameroon
- Plant Diversity and Carbon Storage Potential Across Different Land Use Types in Infrastructure Development Landscapes in Cameroon: Implications for no Net Loss of Biodiversity
- Optimization and Modelling for the Remediation of Brilliant Green Dye and Ni2+ ions from Water Using Advanced gC3N4/PVA@ Alginate Bio-Polymeric Hydrogel Beads
- The Negative Implications of Using Cell Phones on Human Health and Environment
- A Comprehensive Survey of Population Ecology in Insects