Neuroprotective (iNOS), fibrinolytic (FDP) Markers Analysisb of Biofield Treated Proprietary Test Formulation on Cecal Slurry, LPS and E. coli Induced Systemic Inflammatory Response Syndrome (SIRS) Model in Sprague Dawley Rats
The aim of this experiment was to evaluate the antioxidants and anti-inflammatory potential of the Biofield Energy Treated/ Blessed Proprietary Test Formulation and Biofield Energy Treatment per se to the animals on Cecal Slurry, LPS, and E. coliinduced systemic inflammatory response syndrome (SIRS) model in Sprague Dawley rats. The parameters like in brain (MMP9, FDP, Substance P, iNOS) and in heart (FDP, substance P, iNOS) were analysed using ELISA assay. A test formulation was formulated including minerals (magnesium, zinc, calcium, selenium, and iron), vitamins (ascorbic acid, pyridoxine HCl, vitamin E, cyanocobalamin, and cholecalciferol), cannabidiol (CBD) isolate, Panax ginseng extract, and β-carotene. The constituents of the test formulation were divided into two parts; one section was defined as the untreated test formulation, while the other portion of the test formulation and three group of animals received Biofield Energy Healing Treatment remotely for about 3 minutes by a renowned Biofield Energy Healer, Mr. Mahendra Kumar Trivedi. The level of MMP-9 in brain was significantly (p≤0.001) reduced by 48.63%, 36.81%, 40.84%, and 60.03% in the G6 (Cecal Slurry, LPS and E. coli along with Biofield Energy Treatment per se to animals from day -15); G7 (Cecal Slurry, LPS and E. coli along with the Biofield Energy Treated test formulation from day -15); G8 (Cecal Slurry, LPS and E. coli along with Biofield Energy Treatment per se plus the Biofield Energy Treated test formulation from day -15), and G9 (Cecal Slurry, LPS and E. coli along with Biofield Energy Treatment per se animals plus the untreated test formulation) groups, respectively as compared to the untreated test formulation (G4) group. The level of FDP in brain was significantly reduced by 43.10% (p≤0.001), 33.40%, 35.46%, and 62.11% (p≤0.001) in the G6, G7, G8, and G9 groups, respectively as compared to the G4 group. The level of substance P was significantly decreased in brain by 18.42% (p≤0.001), 53.79% (p≤0.001), 16.65%, 14.64%, and 28.43% (p≤0.001) in the G5, G6, G7, G8, and G9 groups, respectively as compared to the G4 group. The iNOS level in brain was significantly decreased by 35.92% (p≤0.001), 32.80%, 47.20% (p≤0.001), and 66.43% (p≤0.001) in the G6, G7, G8, and G9 groups, respectively than G4 group. Besides, FDP in heart tissue was significantly decreased by 15.66%, 17.41% (p≤0.05), 11.85%, and 13.02% in the G5, G6, G8, and G9 groups, respectively as compared to the G4 group. The levels of heart substance P and iNOS were altered. Overall, the Biofield Energy Treated test formulation and Biofield Energy Treatment per se along with preventive maintenance groups showed an antioxidant and anti-inflammatory potentials. Therefore, the results showed the significant slowdown the inflammationrelated disease progression and its complications/symptoms in the preventive groups (viz. G6, G7, G8, and G9) that might be beneficial various types of systemic inflammatory disorders specially sepsis, trauma, septic shock or any types of injuries.
Introduction
Systemic inflammatory response syndrome (SIRS) is a complex pathophysiologic defense response of the body to a noxious stressor such as infection, inflammation, or any others injuries [1, 2]. Sepsis is an infection which can considered as a systemic inflammatory response. Matrix metalloproteinases (MMPs) are zinc-dependent endopeptidase enzymes, responsible for tissue remodelling in both physiological and pathophysiological conditions [3]. Fibrin degradation products (FDP) are the components of blood produced by clot degeneration. In normal subjects, the plasma FDP levels are not detectable. When the levels are raised above 200 ng/ mL, it can be detectable in the plasma. Besides, in response to inflammation, the body produces more fibrinogen and its degradation products [4]. The neuropeptide substance P (SP) is an 11 amino acid peptide distributed throughout the nervous system of human and animal species. SP has a potent neuroimmunomodulatory actions through mediation of neurokinin-1 receptor and proinflammatory effects in vitro and in vivo, and also influence many immune and inflammatory disorders [5, 6]. There is increasing evidence that nitric oxide (NO) is an important factor in the pathogenesis of septic shock. According to Tsukahara et al. reported that the mRNA expression of inducible NO synthase (iNOS) has increased in both sepsis and SIRS cases, which measured in terms of polymorphonuclear neutrophils (PMNs) by reverse transcriptase polymerase chain reaction (RT-PCR) method [7]. Thus, in order to study the change in antioxidants and inflammatory biomarkers in lungs and liver in presence of Cecal Slurry, LPS and E. coli-induced systemic inflammatory response syndrome model in Sprague Dawley rats, a novel test formulation was designed with the combination of vital minerals (selenium, zinc, iron, calcium, and magnesium), essential vitamins (cyanocobalamin, ascorbic acid, pyridoxine HCl, vitamin E, and cholecalciferol), and nutraceuticals (β-carotene, Ginseng, cannabidiol isolate (CBD)). All the minerals and vitamins used in the test formulation have significant functional role to provide vital physiological roles [8, 9]. Besides, cannabidiol itself has wide range of pharmacological profile and has been reported to role in different disorders [10, 11], while ginseng extract is regarded as the one of the best immune booster for overall immunity [12]. The present study was aimed to evaluate the antioxidant and anti-inflammatory potential of the Biofield Energy Treated Proprietary Test Formulation and Biofield Energy Treatment per se to the animals on Cecal Slurry, LPS and E. coli-induced systemic inflammatory response syndrome model in Sprague Dawley rats. Biofield Energy Healing Treatment/Blessing has been reported with significant effects against various disorders, and defined as one of the best Complementary and Alternative Medicine (CAM) treatment approach [13, 14, 15]. National Center for Complementary/ Alternative Medicine (NCCAM) recommended CAM with several clinical benefits as compared with the conventional treatment approach [16]. National Centre of Complementary and Integrative Health (NCCIH) accepted Biofield Energy Healing as a CAM health care approach in addition to other therapies such as deep breathing, natural products, Tai Chi, yoga, therapeutic touch, Johrei, Reiki, pranic healing, chiropractic/osteopathic manipulation, guided imagery, meditation, massage, homeopathy, hypnotherapy, special diets, relaxation techniques, movement therapy, mindfulness, Ayurvedic medicine, traditional Chinese herbs and medicines in biological systems [17, 18]. The Trivedi Effect®- Consciousness Energy Healing was scientifically reported on various disciplines such as nutraceuticals [19], agriculture science [20], cardiac health [21], materials science [22, 23], antiaging [24], Gut health [25], pharmaceuticals [26], overall human health and wellness. In this study, the authors want to evaluate the impact of the Biofield Energy Treatment (the Trivedi Effect®) on the given novel test formulation and Biofield Energy Treatment per se to the animals on brain and heart biomarkers in presence of Cecal Slurry, LPS and E. coli- induced systemic inflammatory response syndrome model in in Sprague Dawley Rats using standard ELISA assay.
Material and Methods
Chemicals and Reagents
Pyridoxine hydrochloride (vitamin B6), zinc chloride, magnesium (II) gluconate, and β-carotene (retinol, provit A) were purchased from TCI, Japan. Cyanocobalamin (vitamin B12), calcium chloride, vitamin E (alpha-tocopherol), cholecalciferol (vitamin D3), iron (II) sulfate, and carboxymethyl cellulose sodium were procured from Sigma- Aldrich, USA. Ascorbic acid (vitamin C) and sodium selenate were obtained from Alfa Aesar, India. Panax ginseng extract and cannabidiol (CBD) isolate were obtained from Panacea Phytoextracts, India and Standard Hemp Company, USA, respectively. Dexamethasone was obtained from Clear synth, India. Specific ELISA kits were procured from CUSABIO, USA for the estimation of antioxidant and inflammatory biomarker panel in the heart such as FDP, Substance P, iNOS, and in brain such as MMP-9, FDP, Substance P, iNOS.
Maintenance of Animal
Randomly breed male Sprague Dawley (SD) rats with body weight ranges from 200 to 300gm were used in this study. The animals were purchased from M/s. Vivo Bio Tech, Hyderabad, India. Animals were randomly divided into nine groups based on their body weights consist of 10- 12 animals of each group. They were kept individually in sterilized polypropylene cages with stainless steel top grill having provision for holding pellet feed and drinking water bottle fitted with stainless steel sipper tube. The animals were maintained as per standard protocol throughout the experiment.
Consciousness Energy Healing Strategies
Each ingredient of the novel test formulation was divided into two parts. One part of the test compound did not receive any sort of treatment and were defined as the untreated or control sample. The second part of the test formulation was treated with the Trivedi Effect® - Energy of Consciousness Healing Treatment (Biofield Energy Treatment) by a renowned Biofield Energy Healer, Mr. Mahendra Kumar Trivedi under laboratory conditions for ~3 minutes. Besides, three group of animals also received Biofield Energy Healing Treatment (known as the Trivedi Effect®) by Mr. Mahendra Kumar Trivedi under similar laboratory conditions for ~3 minutes. The Biofield Energy Healer was located in the USA, however the test formulation were located in the research laboratory of Dabur Research Foundation, New Delhi, India. The energy transmission/Blessing (prayer) was done remotely to the samples or animals for about 3 minutes via online web-conferencing platform. After that, the Biofield Energy Treated samples was kept in the similar sealed condition and used as per the study plan. In the same manner, the control test formulation group was subjected to “sham” healer for ~3 minutes treatment, under the same laboratory conditions. The “sham” healer did not has any knowledge about the Biofield Energy Treatment. The Biofield Energy Treated animals were also taken back to experimental room for further proceedings.
Experimental Procedure
Seven days after acclimatization, animals were randomized and grouped based on the body weight. The test formulation was prepared freshly prior to dosing and administered to the animals using an oral intubation needle attached to an appropriately graduated disposable syringe. The dose volume was 10 mL/kg in morning and evening based on body weight. The experimental groups were divided as G1 as normal control (vehicle, 0.5% w/v CMC-Na); G2 as disease control (Cecal Slurry, LPS and E. coli + 0.5% CMC-Na); G3 as reference item (Cecal Slurry, LPS and E. coli + Dexamethasone); G4 includes Cecal Slurry, LPS and E. coli along with untreated test formulation; G5 as Cecal Slurry, LPS and E. coli along with the Biofield Energy Treated test formulation; G6 group includes Cecal Slurry, LPS and E. coli along with Biofield Energy Treatment per se to animals from day -15; G7 as Cecal Slurry, LPS and E. coli along with the Biofield Energy Treated test formulation from day -15; G8 group includes Cecal Slurry, LPS and E. coli along with Biofield Energy Treatment per se plus the Biofield Energy Treated test formulation from day -15, and G9 group denoted Cecal Slurry, LPS and E. coli along with Biofield Energy Treatment per se animals plus the untreated test formulation. Dosing for groups G7 and G8 were started on Day -15 and continued till end of the experiment. However, Group G1 to G5 and G9 animals were dosed with respective formulations from Day 1 and continued till the end of the experiment. Group G6 animals received Biofield Energy Treatment on Day-15 and were not dosed throughout the experimental period. At the end of the experimental period (8 weeks treatment), the animals were sacrifice and heart and brain were collected, homogenised, and the supernatant subjected for estimation of MMP-9, FDP, Substance P, iNOS in brain and FDP, substance P, iNOS in heart.
Induction of Systemic Inflammatory Response Syndrome (SIRS) Model
A combination model of sepsis was developed in SD rats by administering Cecal slurry (from donor animals, intraperitoneally, at the dose of 400 mg/kg) in combination with LPS (at the dose of 100 µg/animal) and E. coli [Escherichia coli; 0.2 mL (2M CFU)/animal]). The animals were monitored for various parameters for up to 56 days after disease (SIRS) induction. Ten Donor (~20 weeks old) rats were anesthetized. A midline laparotomy was performed on them and the cecum was extruded. A 0.5 cm incision was made on the anti-mesenteric surface of the cecum, and the cecum was squeezed to expel the feces. The feces from different donor animals was collected and weighed. Immediately after collection, the feces were pooled, diluted 1:3 with 5% dextrose solution and filtered to get a homogeneous suspension. Bacterial viability in the cecal slurry was analyzed. Cecal slurry prepared from donor rats was injected intraperitoneally into experimental rats (G2 to G9) at the dose of 400 mg/kg within 2 hours of preparation. After 3 hours, lipopolysaccharide (LPS) at the dose of 100 µg/animal, and gram-negative viable bacteria such as E. coli [0.2 mL (2M CFU)/animal] were injected, intraperitoneally (G2 to G9).
Preparation of Sample for the Estimation of Cytokine and Other Biomarkers
With the continued treatment to the respective groups of 8th week of the experimental period, all the animals were sacrificed; heart and brain were collected, homogenized and subjected for the estimation of cytokine and other biomarkers. The tissue from all the groups was stored at -20°C for further estimation. Alternatively, aliquot all the samples and store samples at -20°C or -80°C. Avoid repeated freeze-thaw cycles, which may alter the level of biomarkers during final calculations.
Estimation of Cytokine and Other Biomarkers Levels
The heart and brain from all the groups was subjected for the estimation of vital functional biomarkers like FDP (CSB- E07942r), Substance P (CSB-E08358r), iNOS (CSB-E08325r), except cytokine MMP-9 (CSB-E08008r) in brain tissue only. All the biomarkers were estimated using ELISA method as per manufacturer’s recommended standard procedure. This was a quantitative method and the principle was based on the binding of antigen and antibody in sandwich manner assay.
Statistical Analysis
The data were represented as mean ± standard error of mean (SEM) and subjected to statistical analysis using Sigma-Plot statistical software (Version 11.0). For multiple comparison One-way analysis of variance (ANOVA) followed by post-hoc analysis by Dunnett’s test and for between two groups comparison Student’s t-test was performed. The p≤0.05 was considered as statistically significant.
Results and Discussion
Assessment of Biomarkers in Brain Homogenate
Estimation of Matrix Metallopeptidase 9 (MMP-9): The effect of the Biofield Treated/Blessed test formulation and Biofield Energy Treatment/Blessing per se to the animals on lungs matrix metallopeptidase 9 (MMP-9), and the results are graphically presented in Figure 1.
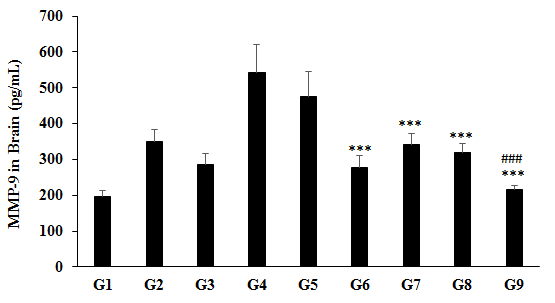
Figure 1: Expression the level of brain matrix metallopeptidase 9 (MMP-9) after administration of Biofield Treated/Untreated test formulation and Biofield Treatment/Blessing per se to Sprague Dawley rats. G1 as normal control (vehicle, 0.5% w/v CMC- Na); G2 as disease control (Cecal Slurry, LPS and E. coli + 0.5% CMC-Na); G3 as reference item (Cecal Slurry, LPS and E. coli + Dexamethasone); G4 includes Cecal Slurry, LPS and E. coli along with untreated test formulation; G5 as Cecal Slurry, LPS and E. coli along with the Biofield Energy Treated test formulation; G6 group includes Cecal Slurry, LPS and E. coli along with Biofield Energy Treatment per se to animals from day -15; G7 as Cecal Slurry, LPS and E. coli + Biofield Energy Treated test formulation from day -15; G8 group includes Cecal Slurry, LPS and E. coli + Biofield Energy Treatment per se + Biofield Energy Treated test formulation from day -15, and G9 group denoted Cecal Slurry, LPS and E. coli along with Biofield Energy Treatment per se animals plus the untreated test formulation. Values are presented as mean ± SEM (n=6-9). ***p≤0.001 vs. G4 and ###p≤0.001 vs. G2.
The disease control (Cecal Slurry, LPS and E. coli + 0.5% CMC-Na) group (G2) showed value of MMP-9 as 349.75 ± 33.03 pg/mL, which was increased by 78.76% as compared with the normal control (G1, 195.66 ± 17.72 pg/mL). Further, the positive control (Dexamethasone) treatment (G3) group decreased MMP-9 level by 18.36% i.e., 285.54 ± 30.10 pg/mL as compared to the G2 group. The level of MMP- 9 was significantly decreased by 20.48%, 2.18%, 8.42%, and 38.12% (p≤0.001) in the G6 (Cecal Slurry, LPS and E. coli + Biofield Energy Treatment per se to animals from day -15); G7 (Cecal Slurry, LPS and E. coli + Biofield Energy Treated test formulation from day -15); G8 (Cecal Slurry, LPS and E. coli + Biofield Energy Treatment per se + Biofield Energy Treated test formulation from day -15), and G9 (Cecal Slurry, LPS and E. coli + Biofield Energy Treatment per se animals + untreated test formulation) groups, respectively with reference to disease control (G2) group. Besides, the level of MMP-9 was significantly reduced by 12.30%, 48.63% (p≤0.001), 36.81% (p≤0.001), 40.84% (p≤0.001), and 60.03% (p≤0.001) in the G5 (Cecal Slurry, LPS and E. coli along with the Biofield Energy Treated test formulation), G6, G7, G8, and G9 groups, respectively as compared to the untreated test formulation (G4). MMP-9 is one of the family of MMPs, and is induced by various inflammatory factors, including interleukin (IL)- 1b, IL-8, and tumor necrosis factor (TNF)-α. It is normally stored in polymorphonuclear leukocytes, which are the key mediator for the etiology of sepsis. During inflammation the expression of MMPs are increased [27]. Further, the expression of MMP-9 is upregulated during inflammatory conditions like arthritis, diabetes, and cancer [28, 29]. In this study, the Biofield Energy Treated test formulation and Biofield Energy Treatment per se significantly reduced the level of MMP-9, which could be beneficial to combat inflammatory disease conditions. Additional evidence has demonstrated that matrix metalloproteinases (MMPs) play an important roles in different pathological processes, including inflammation, cardiovascular diseases, and pulmonary diseases [30]. Overall, here the Biofield Energy Treated test formulation and Biofield Energy Treatment per se significantly reduced the level of MMP-9, which could be beneficial in the SIRS and sepsis patients.
Estimation of Fibrin Degradation Products (FDP): Expression the level of brain fibrin degradation products (FDP) after administration of Biofield Treated/untreated test formulation and Biofield Treatment per se to Sprague Dawley rats, and the results are graphically shown in Figure 2.
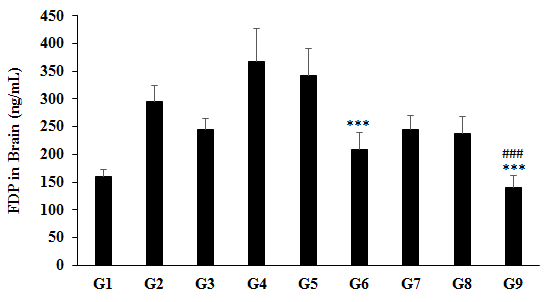
Figure 2: Expression the level of brain fibrin degradation products (FDP) after administration of Biofield Treated/untreated test formulation and Biofield Treatment per se to Sprague Dawley rats. G1 as normal control (vehicle, 0.5% w/v CMC-Na); G2 as disease control (Cecal Slurry, LPS and E. coli + 0.5% CMC-Na); G3 as reference item (Cecal Slurry, LPS and E. coli + Dexamethasone); G4 includes Cecal Slurry, LPS and E. coli along with untreated test formulation; G5 as Cecal Slurry, LPS and E. coli along with the Biofield Energy Treated test formulation; G6 group includes Cecal Slurry, LPS and E. coli along with Biofield Energy Treatment per se to animals from day -15; G7 as Cecal Slurry, LPS and E. coli + Biofield Energy Treated test formulation from day -15; G8 group includes Cecal Slurry, LPS and E. coli + Biofield Energy Treatment per se + Biofield Energy Treated test formulation from day -15, and G9 group denoted Cecal Slurry, LPS and E. coli + Biofield Energy Treatment per se animals plus the untreated test formulation. Values are presented as mean ± SEM (n=6-9). ***p≤0.001 vs. G4 and ###p≤0.001 vs. G2.
The disease control (Cecal Slurry, LPS and E. coli + 0.5% CMC-Na) group (G2) showed value of FDP as 296.24 ± 27.67 ng/mL, which was increased by 84.50% as compared with the normal control (G1, 160.56 ± 11.50 ng/mL). Further, the positive control (Dexamethasone) treatment (G3) showed decrease the level of FDP by 17.37% i.e., 244.79 ± 19.13 ng/mL as compared to the G2 group. The level of FDP was significantly decreased by 29.26%, 17.21%, 19.77%, and 52.89% (p≤0.001) in the G6 (Cecal Slurry, LPS and E. coli + Biofield Energy Treatment per se to animals from day -15); G7 (Cecal Slurry, LPS and E. coli + Biofield Energy Treated test formulation from day -15); G8 (Cecal Slurry, LPS and E. coli + Biofield Energy Treatment per se + Biofield Energy Treated test formulation from day -15), and G9 (Cecal Slurry, LPS and E. coli + Biofield Energy Treatment per se animals + untreated test formulation) groups, respectively with reference to disease control group (G2). Similarly, FDP level was significantly decreased by 7.22%, 43.10% (p≤0.001), 33.40%, 35.46%, and 62.11% (p≤0.001) in the G5 (Cecal Slurry, LPS and E. coli along with the Biofield Energy Treated test formulation), G6, G7, G8, and G9 groups, respectively with reference to untreated test formulation (G4). Inflammation and coagulation play a pivotal role in the pathogenesis of sepsis. The levels of D-dimer and fibrin/ fibrinogen degradation products (FDP) were significantly lower in patients with pre-disseminated intravascular coagulation (DIC) than DIC patients [31]. There is evidence to demonstrate that during the early phase of isolated traumatic brain injury the DIC as well as fibrinolysis were increased [32]. Sepsis is associated with systemic inflammatory responses and induction of intravascular fibrin formation. Based on one of the clinical trials observation, reported that patients with SIRS and associated with sepsis the level of FDP is too high in comparison with the healthy individuals [33]. Overall, here the Biofield Energy Treated test formulation and Biofield Energy Treatment per se significantly reduced the level of FDP, which could be beneficial in the SIRS and sepsis patients.
Estimation of Substance P: The level of brain substance P was detected in all the experimental groups and the data are presented in Figure 3. The disease control (Cecal Slurry, LPS and E. coli + 0.5% CMC-Na) group (G2) showed 144.82% increase the level of substance P as compared to the normal control group (56.72 ± 6.86 pg/mL). Further, positive control (Dexamethasone) treatment reduce the level of substance P by 12.17% as compared to the G2 group. The level of substance P was decreased by 25.23% in the G6 (Cecal Slurry, LPS and E. coli along with Biofield Energy Treatment per se to animals from day -15) as compared to the G2. Similarly, substance P level was significantly decreased by 18.42% (p≤0.001), 53.79% (p≤0.001), 16.65%, 14.64%, and 28.43% (p≤0.001) in the G5 (Cecal Slurry, LPS and E. coli along with the Biofield Energy Treated test formulation), G6, G7 (Cecal Slurry, LPS and E. coli along with the Biofield Energy Treated test formulation from day -15); G8 (Cecal Slurry, LPS and E. coli + Biofield Energy Treatment per se + Biofield Energy Treated test formulation from day -15), and G9 (Cecal Slurry, LPS and E. coli + Biofield Energy Treatment per se animals + untreated test formulation) groups, respectively with reference to untreated test formulation (G4) group. Neurogenic inflammation encircle a series of inflammatory responses that is triggered by the activation of primary sensory neurons and simultaneously release of inflammatory neuropeptides (i.e., substance P). It also reported that substance P is one important neural element that implicates in H2S-induced neurogenic inflammation in sepsis through a TRPV1 channel-dependent mechanism [34]. Overall, here the Biofield Energy Treated test formulation and Biofield Energy Treatment per se has significantly reduced the level of substance P, which could be beneficial for the management of systemic inflammation-related disorders.
![Figure 3: The disease control (Cecal Slurry, LPS and _E. coli_ + 0.5% CMC-Na) group (G2) showed 144.82% increase the level of substance P as compared to the normal control group (56.72 ± 6.86 pg/mL). Further, positive control (Dexamethasone) treatment reduce the level of substance P by 12.17% as compared to the G2 group. The level of substance P was decreased by 25.23% in the G6 (Cecal Slurry, LPS and _E. coli_ along with Biofield Energy Treatment _per se_ to animals from day -15) as compared to the G2. Similarly, substance P level was significantly decreased by 18.42% (_p_≤0.001), 53.79% (_p_≤0.001), 16.65%, 14.64%, and 28.43% (p≤0.001) in the G5 (Cecal Slurry, LPS and _E. coli_ along with the Biofield Energy Treated test formulation), G6, G7 (Cecal Slurry, LPS and _E. coli_ along with the Biofield Energy Treated test formulation from day -15); G8 (Cecal Slurry, LPS and _E. coli_ + Biofield Energy Treatment _per se_ + Biofield Energy Treated test formulation from day -15), and G9 (Cecal Slurry, LPS and _E. coli_ + Biofield Energy Treatment _per se_ animals + untreated test formulation) groups, respectively with reference to untreated test formulation (G4) group. Neurogenic inflammation encircle a series of inflammatory responses that is triggered by the activation of primary sensory neurons and simultaneously release of inflammatory neuropeptides (i.e., substance P). It also reported that substance P is one important neural element that implicates in H2S-induced neurogenic inflammation in sepsis through a TRPV1 channel-dependent mechanism [34]. Overall, here the Biofield Energy Treated test formulation and Biofield Energy Treatment _per se_ has significantly reduced the level of substance P, which could be beneficial for the management of systemic inflammation-related disorders.](/fulltextimages/7643/fig_3.png)
Figure 3: The effect of the test formulation on the level of brain Substance P in Sprague Dawley rats. G1 as normal control (vehicle, 0.5% w/v CMC-Na); G2 as disease control (Cecal Slurry, LPS and E. coli + 0.5% CMC-Na); G3 as reference item (Cecal Slurry, LPS and E. coli + Dexamethasone); G4 includes Cecal Slurry, LPS and E. coli along with untreated test formulation; G5 as Cecal Slurry, LPS and E. coli along with the Biofield Energy Treated test formulation; G6 group includes Cecal Slurry, LPS and E. coli along with Biofield Energy Treatment per se to animals from day -15; G7 as Cecal Slurry, LPS and E. coli along with the Biofield Energy Treated test formulation from day -15; G8 group includes Cecal Slurry, LPS and E. coli along with Biofield Energy Treatment per se plus the Biofield Energy Treated test formulation from day -15, and G9 group denoted Cecal Slurry, LPS and E. coli along with Biofield Energy Treatment per se animals plus the untreated test formulation. Values are presented as mean ± SEM (n=6-9). ***p≤0.001 vs. G4.
Estimation of Inducible Nitric Oxide Synthase (iNOS): The level of brain inducible nitric oxide synthase (iNOS) was detected in all the experimental groups and the data are presented in Figure 4. The disease control (Cecal Slurry, LPS and E. coli + 0.5% CMC-Na) group (G2) showed value of iNOS as 15.86 ± 1.50 IU/mL, which was increased by 99.24% as compared with the normal control (G1, 7.96 ± 0.57 IU/mL). Further, the positive control (Dexamethasone) treatment (G3) showed decreased iNOS level by 25.78% i.e., 11.77 ± 1.37 IU/mL as compared to the G2 group. The level of iNOS was significantly decreased by 20.40%, 16.53%, 34.42%, and 58.30% in the G6 (Cecal Slurry, LPS and E. coli along with Biofield Energy Treatment per se to animals from day -15); G7 (Cecal Slurry, LPS and E. coli + Biofield Energy Treated test formulation from day -15); G8 (Cecal Slurry, LPS and E. coli + Biofield Energy Treatment per se + Biofield Energy Treated test formulation from day -15), and G9 (Cecal Slurry, LPS and E. coli + Biofield Energy
Treatment per se animals + untreated test formulation) groups, respectively, as compared to the disease control group (G2). Similarly, iNOS level was decreased by 5.27%, 35.92% (p≤0.001), 32.80%, 47.20% (p≤0.001), and 66.43% (p≤0.001) in the G5 (Cecal Slurry, LPS and E. coli along with the Biofield Energy Treated test formulation), G6, G7, G8, and G9 groups, correspondingly with reference to untreated test formulation (G4) group. Activation of iNOS produce nitric oxide (NO) that affect to the neutrophils and endothelial cells contributes cerebral ischemic injury [35]. iNOS is expressed in brain cortex during stress, its overexpression causes neurodegenerative changes after repeated exposure stress factors mediated through translocation of nuclear factor kB (NF-kB) [36]. In this experiment, Mr. Trivedi’s Biofield Treatment significantly reduced the overexpression of iNOS due to induction of SIRS by Cecal Slurry, LPS and E. coli in rats treatment groups (G6, G8, and G9). Thus, Mr. Trivedi’s Biofield Treatment could be plays a possible neuroprotective role to the neurodegenerative patients to some extent induced by due to stress or inflammation.
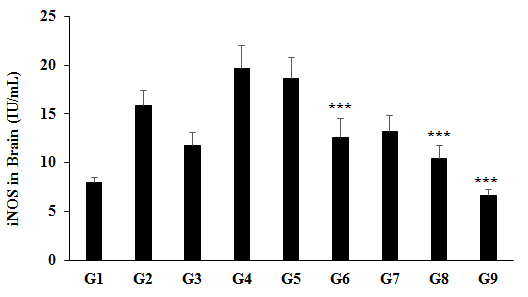
Figure 4: Expression the level of brain inducible nitric oxide synthase (iNOS) after administration of Biofield Treated/ untreated test formulation and Biofield Energy Healing per se to Sprague Dawley rats. G1 as normal control (vehicle, 0.5% w/v CMC-Na); G2 as disease control (Cecal Slurry, LPS and E. coli + 0.5% CMC-Na); G3 as reference item (Cecal Slurry, LPS and E. coli + Dexamethasone); G4 includes Cecal Slurry, LPS and E. coli along with untreated test formulation; G5 as Cecal Slurry, LPS and E. coli along with the Biofield Energy Treated test formulation; G6 group includes Cecal Slurry, LPS and E. coli along with Biofield Energy Treatment per se to animals from day -15; G7 as Cecal Slurry, LPS and E. coli + Biofield Energy Treated test formulation from day -15; G8 group includes Cecal Slurry, LPS and E. coli + Biofield Energy Treatment per se + Biofield Energy Treated test formulation from day -15, and G9 group denoted Cecal Slurry, LPS and E. coli + Biofield Energy Treatment per se animals + untreated test formulation. Values are presented as mean ± SEM (n=6-9). ***p≤0.001 vs. G4.
Assessment of Biomarkers in Heart Homogenate
Estimation of Fibrin Degradation Products (FDP): Estimation the level heart fibrin degradation products (FDP) after administration of Biofield Treated/untreated test formulation and Biofield Energy Healing/Blessing per se to Sprague Dawley rats, and the results are graphically shown in Figure 5. The disease control (Cecal Slurry, LPS and E. coli + 0.5% CMC-Na) group (G2) showed value of FDP as 209.47 ± 30.29 ng/mL, which was increased by 14.91% as compared with the normal control (G1, 182.29 ± 9.09 ng/mL). Further, the positive control (Dexamethasone) treatment (G3) showed decrease the level of FDP by 13.28% i.e., 181.64 ± 12.83 ng/mL as compared to the G2 group. The level of FDP was significantly decreased by 15.66%, 17.41% (p≤0.05), 8.31%, 11.85%, and 13.02% in the G5 (Cecal Slurry, LPS and E. coli + Biofield Energy Treated test formulation); G6 (Cecal Slurry, LPS and E. coli + Biofield Energy Treatment per se to animals from day -15); G7 (Cecal Slurry, LPS and E. coli + Biofield Energy Treated test formulation from day -15); G8 (Cecal Slurry, LPS and E. coli + Biofield Energy Treatment per se + Biofield Energy Treated test formulation from day -15), and G9 (Cecal Slurry, LPS and E. coli + Biofield Energy Treatment per se animals + untreated test formulation) groups, respectively, as compared to the untreated test formulation (G4). FDP are the degradation product of fibrin and fibrinogen that remain in bloodstream after breakdown of a blood clot. FDP levels after cardiac arrest might reflect whole body ischemia and hypoxia [37]. Overall, here the Biofield Energy Treated test formulation and Biofield Energy Treatment per se significantly reduced the level of FDP, which could be beneficial in cardiac ischemia and hypoxic and sepsis patients.
![Figure 5: The disease control (Cecal Slurry, LPS and _E. coli_ + 0.5% CMC-Na) group (G2) showed value of FDP as 209.47 ± 30.29 ng/mL, which was increased by 14.91% as compared with the normal control (G1, 182.29 ± 9.09 ng/mL). Further, the positive control (Dexamethasone) treatment (G3) showed decrease the level of FDP by 13.28% i.e., 181.64 ± 12.83 ng/mL as compared to the G2 group. The level of FDP was significantly decreased by 15.66%, 17.41% (p≤0.05), 8.31%, 11.85%, and 13.02% in the G5 (Cecal Slurry, LPS and _E. coli_ + Biofield Energy Treated test formulation); G6 (Cecal Slurry, LPS and _E. coli_ + Biofield Energy Treatment _per se_ to animals from day -15); G7 (Cecal Slurry, LPS and _E. coli_ + Biofield Energy Treated test formulation from day -15); G8 (Cecal Slurry, LPS and _E. coli_ + Biofield Energy Treatment _per se_ + Biofield Energy Treated test formulation from day -15), and G9 (Cecal Slurry, LPS and _E. coli_ + Biofield Energy Treatment _per se_ animals + untreated test formulation) groups, respectively, as compared to the untreated test formulation (G4). FDP are the degradation product of fibrin and fibrinogen that remain in bloodstream after breakdown of a blood clot. FDP levels after cardiac arrest might reflect whole body ischemia and hypoxia [37]. Overall, here the Biofield Energy Treated test formulation and Biofield Energy Treatment _per se_ significantly reduced the level of FDP, which could be beneficial in cardiac ischemia and hypoxic and sepsis patients.](/fulltextimages/7643/fig_5.png)
Figure 5: Estimation the level heart fibrin degradation products (FDP) after administration of Biofield Treated/untreated test formulation and Biofield Energy Healing/Blessing per se to Sprague Dawley rats. G1 as normal control (vehicle, 0.5% w/v CMC-Na); G2 as disease control (Cecal Slurry, LPS and E. coli + 0.5% CMC-Na); G3 as reference item (Cecal Slurry, LPS and E. coli + Dexamethasone); G4 includes Cecal Slurry, LPS and E. coli along with untreated test formulation; G5 as Cecal Slurry, LPS and E. coli along with the Biofield Energy Treated test formulation; G6 group includes Cecal Slurry, LPS and E. coli along with Biofield Energy Treatment per se to animals from day -15; G7 as Cecal Slurry, LPS and E. coli + Biofield Energy Treated test formulation from day -15; G8 group includes Cecal Slurry, LPS and E. coli + Biofield Energy Treatment per se + Biofield Energy Treated test formulation from day -15, and G9 group denoted Cecal Slurry, LPS and E. coli along with Biofield Energy Treatment per se animals plus the untreated test formulation. Values are presented as mean ± SEM (n=6-9). *p≤0.05 vs. G4.
Estimation of Substance P: The level of heart substance P was detected in all the experimental groups and the data are presented in Figure 6.
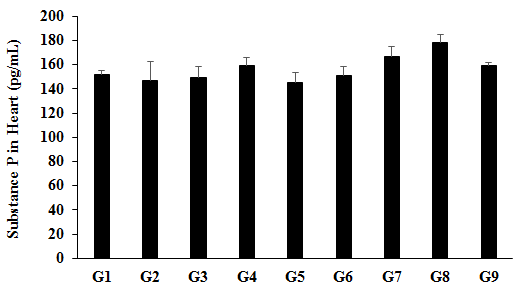
Figure 6: Expression the level of heart substance P after treatment with the Biofield Treated test formulation and Biofield Energy Healing per se to Sprague Dawley rats. G1 as normal control (vehicle, 0.5% w/v CMC-Na); G2 as disease control (Cecal Slurry, LPS and E. coli + 0.5% CMC-Na); G3 as reference item (Cecal Slurry, LPS and E. coli + Dexamethasone); G4 includes Cecal Slurry, LPS and E. coli along with untreated test formulation; G5 as Cecal Slurry, LPS and E. coli along with the Biofield Energy Treated test formulation; G6 group includes Cecal Slurry, LPS and E. coli along with Biofield Energy Treatment per se to animals from day -15; G7 as Cecal Slurry, LPS and E. coli + Biofield Energy Treated test formulation from day -15; G8 group includes Cecal Slurry, LPS and E. coli + Biofield Energy Treatment per se + Biofield Energy Treated test formulation from day -15, and G9 group denoted Cecal Slurry, LPS and E. coli along with Biofield Energy Treatment per se animals plus the untreated test formulation. Values are presented as mean ± SEM (n=6-9).
The disease control (Cecal Slurry, LPS and E. coli + 0.5% CMC-Na) group (G2) and positive control (Dexamethasone) treatment (G3) showed value of substance P as 146.96 ±
15.99 pg/mL and 149.72 ± 9.06 pg/mL, respectively. The level of substance P was decreased by 8.79% and 5.17% in the G5 (Cecal Slurry, LPS and E. coli along with the Biofield
Energy Treated test formulation) and G6 (Cecal Slurry, LPS and E. coli along with Biofield Energy Treatment per se to animals from day -15) groups, respectively as compared to the untreated test formulation (G4) group. According to Ang SF et al. (2011), reported that the expression of substance P has increased in inflammation/septic condition through the activation of the ERK-NF-κB pathway [34]. Overall, here the Biofield Energy Treated test formulation and Biofield Energy Treatment per se has significantly reduced the level of substance P, which could be beneficial for the management of systemic inflammation-related disorders.
Estimation of Inducible Nitric Oxide Synthase (iNOS): The level of heart inducible nitric oxide synthase (iNOS) was detected in all the experimental groups and the data are presented in Figure 7. The disease control (Cecal Slurry, LPS and E. coli + 0.5% CMC-Na) group (G2) the positive control (Dexamethasone) treatment (G3) group showed iNOS level by 24.24 ± 3.85 IU/mL and 26.05 ± 1.83 IU/mL, respectively.
The level of iNOS was decreased by 8.04%, 4.75%, and 9.27% in the G5 (Cecal Slurry, LPS and E. coli along with the Biofield Energy Treated test formulation); G6 (Cecal Slurry, LPS and E. coli along with Biofield Energy Treatment per se to animals from day -15); and G9 (Cecal Slurry, LPS and E. coli along with Biofield Energy Treatment per se animals plus the untreated test formulation) groups, respectively, as compared to the untreated test formulation (G4) group. Nitric oxide (NO) is the key endothelium-derived relaxing factor that maintain the vascular tone and reactivity. More generation of NO by the stimulation of iNOS have been proposed as a major mechanism of endothelial dysfunction, and that causes o abnormalities [38]. Besides, iNOS is expressed due to the effects of proinflammatory cytokines and can release more NO than other isoform of nitric oxide synthase enzymes [39]. Overall, here the Biofield Energy Treated test formulation and Biofield Energy Treatment per se significantly reduced the level of iNOS, which could be beneficial for the management of inflammation-related disorders.
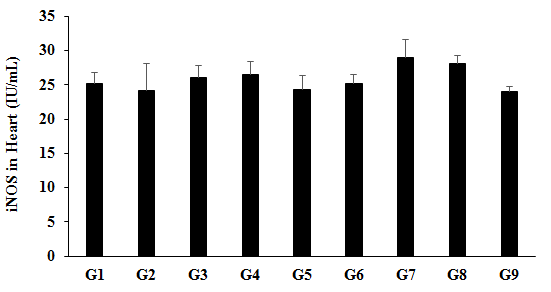
Figure 7: The effect of the test formulation on the level of heart inducible nitric oxide synthase (iNOS) in Sprague Dawley rats. G1 as normal control (vehicle, 0.5% w/v CMC-Na); G2 as disease control (Cecal Slurry, LPS and E. coli + 0.5% CMC-Na); G3 as reference item (Cecal Slurry, LPS and E. coli + Dexamethasone); G4 includes Cecal Slurry, LPS and E. coli along with untreated test formulation; G5 as Cecal Slurry, LPS and E. coli along with the Biofield Energy Treated test formulation; G6 group includes Cecal Slurry, LPS and E. coli along with Biofield Energy Treatment per se to animals from day -15; G7 as Cecal Slurry, LPS and E. coli + Biofield Energy Treated test formulation from day -15; G8 group includes Cecal Slurry, LPS and E. coli + Biofield Energy Treatment per se + Biofield Energy Treated test formulation from day -15, and G9 group denoted Cecal Slurry, LPS and E. coli + Biofield Energy Treatment per se animals plus the untreated test formulation. Values are presented as mean ± SEM (n=6-9).
Experiment includes four preventive maintenance groups (G6, G7, G8 and G9). The findings showed the significant slowdown of inflammation-related symptoms and also reduced the chances of disease susceptibility. All- inclusive, it indicate that the Trivedi Effect® was found to be most effective and benefited to protect different kinds of diseases and also improve the overall health and quality of life.
Conclusions
The level of MMP-9 in brain was significantly reduced by 48.63%, 36.81%, 40.84%, and 60.03% in the G6, G7, G8, and G9 groups, respectively as compared to the untreated test formulation (G4) group. FDP was significantly decreased by 43.10%, 33.40%, 35.46%, and 62.11% in the G6, G7, G8, and G9 groups, respectively with reference to G4 group. Moreover, the level of substance P in brain was significantly reduced by 18.42%, 53.79%, and 28.43% in the G5, G6, and G9 groups, respectively, as compared to the G4 group. Additionally, brain iNOS was significantly decreased by 35.92%, 32.80%, 47.20%, and 66.43% in G6, G7, G8, and G9 groups, correspondingly with reference to G4 group. Besides, heart FDP was significantly decreased by 15.66%, 17.41%, 11.85%, and 13.02% in G5, G6, G8, and G9 groups, correspondingly with reference to G4 group. Further, levels of heart substance P and iNOS were altered. Altogether, the Biofield Energy Treated test formulation and Biofield Energy Healing Treatment (the Trivedi Effect®) per se showed fruitful results with respect to different antioxidants and inflammatory biomarkers in the preventive maintenance groups (G7, G8, and G9) in Cecal Slurry, LPS and E. coli-induced systemic inflammatory response syndrome (SIRS) model rat model. Experiment includes four preventive maintenance groups (G6, G7, G8 and G9). The findings showed the significant slowdown of inflammation-related symptoms and also reduced the chances of disease susceptibility. All-inclusive, it indicate that the Trivedi Effect® was found to be most effective and benefited to protect different kinds of diseases and also improve the overall health and quality of life. It also helped to slowdown the inflammatory disease progression and disease-related complications. The study data showed that Biofield Energy Treated Test formulation and Biofield Energy Treatment per se would be one of the best treatment strategies to prevent the manifestation of diseases. Thus, the Biofield Energy Treatment might act as a preventive maintenance therapy to maintain and improve the overall health and quality of life and simultaneously reduce the severity of acute/chronic diseases. The test formulation can also be used against rheumatoid arthritis (RA), fibromyalgia, aplastic anaemia, Addison disease (AD), multiple sclerosis, myasthenia gravis, psoriasis, Crohn’s disease, ulcerative colitis, dermatitis, hepatitis, Parkinson’s, stroke, etc.
Acknowledgements
The authors are grateful to Dabur Research Foundation, Trivedi Science, Trivedi Global, Inc., and Trivedi Master Wellness for the assistance and support during the work.
References
-
Chakraborty RK, Burns B (2020) Systemic Inflammatory Response Syndrome In: StatPearls [Internet]. Treasure Island (FL): StatPearls LLC.
-
Balk RA (2014) Systemic inflammatory response syndrome (SIRS): Where did it come from and is it still relevant today?. Virulence 5(1): 20-26.
-
Yabluchanskiy A, Ma Y, Iyer RP, Hall ME, Lindsey ML (2013) Matrix metalloproteinase-9: Many shades of function in cardiovascular disease. Physiology (Bethesda) 28(6): 391-403.
-
Salvemini D, Riley DP (2000) Nonpeptidyl mimetics of superoxide dismutase in clinical therapies for diseases. Cell Mol Life Sci 57(11): 1489-1492.
-
Sternberg EM (2006) Neural regulation of innate immunity: A coordinated nonspecific host response to pathogens. Nat Rev Immunol 6(4): 318-328.
-
O’Connor TM, O’Connell J, O’Brien DI, Goode T, Bredin CP, et al. (2004) The role of substance P in inflammatory disease. J Cell Physiol 201(2): 167-180.
-
Tsukahara Y, Morisaki T, Horita Y, Torisu M, Tanaka M (1998) Expression of inducible nitric oxide synthase in circulating neutrophils of the systemic inflammatory response syndrome and septic patients. World J Surg 22(8): 771-777.
-
Rayman MP (2000) The importance of selenium to human health. Lancet 356(9225): 233-241.
-
Beard JL, Connor JR (2003) Iron status and neural functioning. Ann Rev Nutr 23: 41-58.
-
Peres FF, Lima AC, Hallak JEC, Crippa JA, Silva RH, et al. (2018) Cannabidiol as a promising strategy to treat and prevent movement disorders? Front Pharmacol 9: 482.
-
Nagarkatti P, Pandey R, Rieder SA, Hegde VL, Nagarkatti M (2009) Cannabinoids as novel anti-inflammatory drugs. Future Med Chem 1(7): 1333-1349.
-
Kang S, Min H (2012) Ginseng, the ‘Immunity Boost’: The effects of _Panax ginseng_ on immune system. J Ginseng Res 36(4): 354-368.
-
Maizes V, Rakel D, Niemiec C (2009) Integrative medicine and patient-centered care. Explore (NY) 5(5): 277-289.
-
Bischof M, Del Giudice E (2013) Communication and the emergence of collective behavior in living organisms: A quantum approach. Mol Biol Int 2013: 987549.
-
Cassidy CM (2004) What does it mean to practice an energy medicine? J Altern Complement Med 10(1): 79- 81.
-
Barnes PM, Bloom B, Nahin RL (2008) Complementary and alternative medicine use among adults and children: United States, 2007. Natl Health Stat Report 12: 1-23.
-
Fan K wai (2005) National center for complementary and alternative medicine website. J Med Libr Assoc 93(3): 410-412.
-
Wisneski L, Anderson L (2009) The Scientific Basis of Integrative Medicine. CRC Press, pp: 205.
-
Trivedi MK, Branton A, Trivedi D, Jana S (2021) Isotopic abundance ratio analysis of consciousness energy healing treated folic acid. Food Nutr Current Res 4(2): 290-295.
-
Trivedi MK, Branton A, Trivedi D, Nayak G, Mondal SC, Jana S (2015) Morphological characterization, quality, yield and DNA fingerprinting of biofield energy treated alphonso mango (_Mangifera indica_ L.). Journal of Food and Nutrition Sciences 3: 245-250.
-
Trivedi MK, Jana S (2019) In vitro assessment of the biofield treated test item on cardiac function using rat cardiomyocytes cell line (H9c2) _via_ multiparametric analysis. Journal of Hypertension and Cardiology 2(4): 1-12.
-
Trivedi MK, Branton A, Trivedi D, Jana S (2021) Effect of consciousness energy healing treatment on the metal profile and properties of tellurium. Eng Technol Open Acc 3(5): 555623.
-
Mahendra KT, Alice B, Dahryn T, Snehasis J (2021) Consciousness energy healing treatment impacted the isotopic abundance ratio of 6-Mercaptopurine (6-MP). Nov Appro Drug Des Dev 5(5): 555673.
-
Trivedi MK, Jana S (2021) Anti-aging activity of biofield energy treated novel proprietary test formulation by assessment of vital biomarkers in cerebrospinal fluid (CSF) in Sprague Dawley rats. On J Neur & Br Disord 5(2).
-
Trivedi MK, Jana S (2021) Evaluation of biofield energy healing treatment based proprietary test formulation on gut health potential in colon cancer cell line (HT-29). J Pharmacol Clin Res 8(4): 555743.
-
Trivedi MK, Branton A, Trivedi D, Jana S (2020) The consciousness energy healing treatment and its impact on the isotopic abundance ratio analysis of flutamide. Drug Des Int Prop Int J 3(5).
-
Wang M, Zhang Q, Zhao X, Dong G, Li C (2014) Diagnostic and prognostic value of neutrophil gelatinase-associated lipocalin, matrix metalloproteinase-9, and tissue inhibitor of matrix metalloproteinases-1 for sepsis in the Emergency Department: An observational study. Crit Care 18(6): 634.
-
Halade GV, Jin YF, Lindsey ML (2013) Matrix metalloproteinase (MMP)-9: A proximal biomarker for cardiac remodeling and a distal biomarker for inflammation. Pharmacol Ther 139(1): 32-40.
-
Lee AC, Trivedi K, Branton A, Trivedi D, Nayak G, Mondal SC, Jana S (2018) The potential benefits of biofield energy treated vitamin D3 on bone mineralization in human bone osteosarcoma cells (MG-63). International Journal of Nutrition and Food Sciences 7(1): 30-38.
-
Yan Y, Jiang L, Li M, et al. (2020) Levels of matrix metalloproteinase-9 and tissue inhibitor of metalloproteinase-1 are related to cardiopulmonary injury in foetal inflammatory response syndrome. Clinics (Sao Paulo) 75: e2049.
-
Ding R, Meng Y, Ma X (2018) “The central role of the inflammatory response in understanding the heterogeneity of sepsis-3”. BioMed Research International 2018: 1-10.
-
Wada T, Gando S, Maekaw K, Kenichi K, Hisako S et al. (2017) Disseminated intravascular coagulation with increased fibrinolysis during the early phase of isolated traumatic brain injury. Crit Care 21(1): 219.
-
Toh JM, Ken-Dror G, Downey C, Abrams ST (2013) The clinical utility of fibrin-related biomarkers in sepsis. Blood Coagul Fibrinolysis 24(8): 839-843.
-
Ang SF, Moochhala SM, MacAry PA, Bhatia M (2011) Hydrogen sulfide and neurogenic inflammation in polymicrobial sepsis: Involvement of substance P and ERK-NF-κB signaling. PLOS ONE 6(9): e24535.
-
Garcia-Bonilla L, Moore JM, Racchumi G, Ping Zhou, Jason M. Butler, et al. (2014) Inducible nitric oxide synthase in neutrophils and endothelium contributes to ischemic brain injury in mice. J Immunol 193(5): 2531-2537.
-
Madrigal JL, Moro MA, Lizasoain I, Lorenzo P, Castrillo A, et al. (2001) Inducible nitric oxide synthase expression in brain cortex after acute restraint stress is regulated by nuclear factor kappaB-mediated mechanisms. J Neurochem 76(2): 532-538.
-
Ono Y, Hayakawa M, Maekawa K, Kodate A, Sadamoto Y, et al. (2017) Fibrin/fibrinogen degradation products (FDP) at hospital admission predict neurological outcomes in out-of-hospital cardiac arrest patients. Resuscitation 111: 62-67.
-
Tang EH, Vanhoutte PM (2010) Endothelial dysfunction: A strategic target in the treatment of hypertension?. Pflugers Arch 459(6): 995-1004.
-
Besedina A (2016) NO-synthase activity in patients with coronary heart disease associated with hypertension of different age groups. J Med Biochem 35(1): 43‐49.
- Epidemiological and Clinical Aspects of Intestinal Parasitoses Among Students in the City of Bocaranga, Central African Republic
- Artificial Intelligence Empowers Global Infectious Disease Prevention and Control: Opportunities and Challenges
- Factors that Affect the Incidence of Babesia and Blood Donor Testing in Select States: A Regression Analysis
- Neuro-TB: The Battle between Tuberculosis and the Nervous System
- The Biological and Health Implications of Cat Fleas (Ctenocephalides felis): Assessing Zoonotic Risks and Hygiene Strategies
- Biostatistical Analysis of Medicinal Plants for Treating Schizophrenia