Epidemiological Overview HIV AIDS in the Microregion of Varginha (MG)
Since the emergence of the Human Immunodeficiency Virus (HIV), with the consequent development of the Acquired Immunodeficiency Syndrome (AIDS) in the 1980s, the identification of the infection has been a milestone for science and is considered a public health problem. Currently, about 38 million people live with HIV/AIDS in the world, of which 920,000 of these people are in Brazil, in the micro-region of Varginha (Varginha, Três Corações, Três Pontas, Campos Gerais, Boa Esperança, Elói Mendes , Campanha, Guapé, Ilicínea, Carmo da Cachoeira, Campo do Meio, Coqueiral, Monsenhor Paulo, Santana da Vargem, São Thomé das Letras and São Bento Abade), with an estimated population of 478 thousand inhabitants, between 2010 and 2020, 510 people were diagnosed with HIV and 533 people living with AIDS. In this way, the present article aimed to carry out a survey of epidemiological data on HIV/AIDS in the last 10 years, on platforms made available by the Government, and to relate it to the variables of sex and age, where it was possible to observe a masculinization of cases, with higher prevalence in the age group of 30 to 39 years in the general population. The importance of understanding the infection at its beginning is essential for diagnosis, since it allows alternative therapeutic decisions to be made, avoiding exacerbated viral replication, mitigating the AIDS pathology picture and its subsequent systemic damage to the body, which promotes greater expenses for the patient's public agencies. Therefore, the epidemiological study of HIV/AIDS is of great importance, as it can assist in the development of effective programs to control the infection by governments, in addition to contributing to the control and awareness of vulnerable populations, bringing benefits to public health in the region.
Introduction
The Human Immunodeficiency Virus (HIV) is the etiological agent of the Acquired Immunodeficiency Syndrome (AIDS), which attacks the TCD4+ cells of the immune system, a situation in which the body cannot fight the virus present in these cells for its elimination and consequent cure, leaving the infected person vulnerable to diseases, that is, once infected, the individual will live with the pathogen for the rest of his life, however, he will not necessarily develop AIDS, since nowadays antiretroviral therapy prevents the disease. It is worth mentioning that AIDS alone does not kill, but the entry of other pathogens, as a result of the weakened immune system, it further depresses it and can lead to death [1].
The AIDS pandemic is still a major public health problem and continues to grow steadily. Initially, in Brazil, the infection was characterized only by homosexual men infected by HIV, with a high level of education, then, due to the greater number of infections by injecting drug use, (it also reached heterosexuals, which consequently characterized the last and current stage of infection, in which men and women are infected, regardless of sexual orientation [2].
HIV transmission occurs through the exchange of body fluids, either in sexual intercourse without condoms with HIV-positive people (a person already infected with HIV), sharing contaminated sharp objects, or vertically (from a mother without treatment to her child), which may be during pregnancy, childbirth or breastfeeding. The first symptoms are similar to an indication of flu and appear between 3 to 6 weeks, with the production of anti-HIV antibodies to the virus circulating in the individual’s body within 8 to 12 weeks [3].
The distribution of HIV is present in several areas of Brazil. Resulting from social inequalities and lack of access to information by large groups in society [4]. The importance of understanding the infection at its beginning is essential for the diagnostic chain, since it allows alternative therapeutic decisions to be made, which avoids exacerbated viral replication, mitigating the AIDS pathology picture and its subsequent systemic damage to the body, which promotes greater expenses for public bodies. Its biggest obstacle is related to its ability to remain latent in the body until an opportunity for immune weakening arises [5].
Since the confirmation of the emergence of HIV and AIDS in the 1980s, the diagnosis of the infection has been a milestone for science and is considered a public health problem, where there is no distinction between colour, race, and economic power [6]. Currently, about 920,000 people living with HIV in Brazil, where in 2020 more than 13,000 cases were, diagnosed [7]. In Minas Gerais, about 28 thousand people live with AIDS in the last 10 years, of which 20 thousand are men and 8 thousand are women [8].
Methodology
In the present study, integrative review research was carried out on existing articles on electronic platforms with epidemiological data about the microregion of Varginha (Varginha, Três Corações, Três Pontas, Campos Gerais, Boa Esperança, Elói Mendes, Campanha, Guapé, Ilicínea, Carmo da Cachoeira, Campo do Meio, Coqueiral, Monsenhor Paulo, Santana da Vargem, São Thomé das Letras and São Bento Abade) and the Brazilian states, offering an overview of HIV/AIDS and possible correlations with the variables of sex and age, in addition to a descriptive study based on data platforms made available by the government, as a way of obtaining information and comparing it for confirmation. The search was carried out on sites such as Scielo, Pubmed, Science.gov, Ministry of Health, TabNet [9, 10], and DCCI [8], plotting the information in an Excel spread sheet for analysis and making graphs and tables.
The data were obtained by the government platforms, where it has the municipality of residence or the municipality of notification, for academic purposes, only the data obtained by residence will be used, as these data have confirmation on other existing government platforms, and there is still a discrepancy between these data between the 2020 database updates (version 2.4) to 2021 (version 3.0), but only the database with the 2020 update (version 2.4) was able to confirm and compare this data with other government- provided platforms, therefore, only version 2.4 will be used in specific analyses.
Results
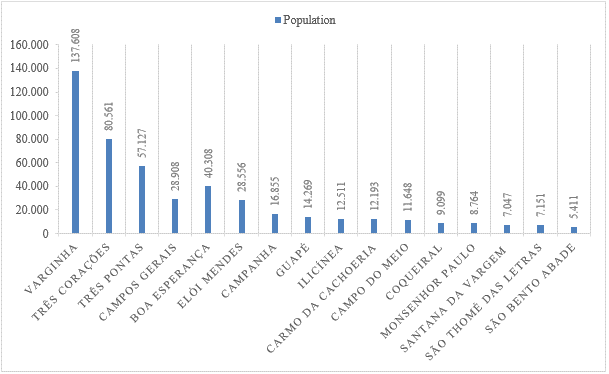
Data from a 10-year historical series were analysed, 2010-2020, in the municipalities of the micro-region of Varginha, which has about 478,106 (four hundred and seventy-eight thousand one hundred and six) inhabitants (Figure 1), and involves Varginha, Três Corações, Três Pontas, Campos Gerais, Boa Esperança, Elói Mendes, Campanha, Guapé, Ilicínea, Carmo da Cachoeira, Campo do Meio, Coqueiral, Monsenhor Paulo, Santana da Vargem, São Thomé das Letras and São Bento Abade. In Table 1, the data were analysed with the distinction between females and males, where it was not possible to obtain the age variable as well, as this was not available in government databases. Thus, it was possible to observe that of the 510 confirmed cases, 378 were male and 132 were female, in addition, the city that had the most inhabitants with HIV was Varginha with 234 cases, and the city that had the lowest incidence was Coqueiral with 0 cases.
| 2010 | 2011 | 2012 | 2013 | 2014 | 2015 | 2016 | 2017 | 2018 | 2019 | 2020 | Total | |||||||||||||
|---|---|---|---|---|---|---|---|---|---|---|---|---|---|---|---|---|---|---|---|---|---|---|---|---|
| Varginha | M | W | M | W | M | W | M | W | M | W | M | W | M | W | M | W | M | W | M | W | M | W | M | W |
| 11 | 10 | 6 | 3 | 10 | 4 | 13 | 3 | 13 | 4 | 18 | 6 | 18 | 3 | 23 | 4 | 27 | 6 | 23 | 1 | 25 | 3 | 187 | 47 | |
| Três Corações | 6 | 1 | 3 | 1 | 6 | 3 | 4 | 1 | 5 | 2 | 9 | 1 | 2 | 2 | 3 | 0 | 7 | 3 | 9 | 2 | 6 | 2 | 60 | 18 |
| Três Pontas | 2 | 3 | 4 | 2 | 5 | 2 | 6 | 3 | 3 | 4 | 4 | 2 | 6 | 3 | 1 | 2 | 2 | 2 | 7 | 1 | 0 | 2 | 40 | 26 |
| Boa Esperança | 2 | 0 | 3 | 3 | 0 | 3 | 2 | 0 | 2 | 0 | 1 | 1 | 1 | 1 | 0 | 2 | 3 | 0 | 0 | 1 | 1 | 0 | 15 | 11 |
| Campos Gerais | 2 | 0 | 0 | 0 | 0 | 1 | 1 | 1 | 1 | 1 | 2 | 0 | 0 | 1 | 1 | 2 | 0 | 0 | 0 | 0 | 0 | 0 | 7 | 6 |
| Eloi Mendes | 0 | 0 | 0 | 0 | 1 | 0 | 3 | 1 | 2 | 0 | 2 | 1 | 0 | 1 | 3 | 1 | 0 | 0 | 4 | 1 | 0 | 1 | 15 | 6 |
| Campanha | 5 | 1 | 1 | 0 | 1 | 1 | 2 | 1 | 0 | 0 | 2 | 1 | 0 | 0 | 0 | 0 | 1 | 0 | 1 | 0 | 1 | 0 | 14 | 4 |
| Guapé | 0 | 0 | 0 | 0 | 0 | 0 | 0 | 0 | 0 | 0 | 0 | 0 | 0 | 0 | 1 | 0 | 0 | 0 | 0 | 0 | 0 | 0 | 1 | 0 |
| Ilicínea | 0 | 0 | 0 | 0 | 0 | 0 | 0 | 0 | 0 | 0 | 0 | 0 | 0 | 0 | 1 | 0 | 0 | 0 | 1 | 0 | 1 | 0 | 3 | 0 |
| Carmo da Cachoeira | 3 | 3 | 3 | 2 | 5 | 0 | 0 | 1 | 1 | 2 | 1 | 0 | 1 | 0 | 2 | 0 | 2 | 1 | 1 | 0 | 1 | 0 | 20 | 9 |
| Campo do Meio | 0 | 0 | 0 | 0 | 0 | 0 | 1 | 0 | 3 | 0 | 3 | 0 | 0 | 0 | 0 | 0 | 0 | 0 | 0 | 0 | 0 | 0 | 7 | 0 |
| Coquetral | 0 | 0 | 0 | 0 | 0 | 0 | 0 | 0 | 0 | 0 | 0 | 0 | 0 | 0 | 0 | 0 | 0 | 0 | 0 | 0 | 0 | 0 | 0 | 0 |
| Monsenhor Paulo | 0 | 0 | 0 | 0 | 1 | 0 | 0 | 0 | 0 | 0 | 0 | 0 | 0 | 0 | 0 | 0 | 0 | 0 | 1 | 1 | 0 | 0 | 2 | 1 |
| Santana da Vargem | 1 | 0 | 0 | 0 | 1 | 0 | 1 | 0 | 0 | 0 | 0 | 0 | 0 | 0 | 1 | 0 | 0 | 0 | 0 | 0 | 0 | 0 | 4 | 0 |
| São Thome das Letras | 1 | 1 | 0 | 0 | 1 | 0 | 0 | 0 | 0 | 1 | 1 | 1 | 0 | 0 | 0 | 0 | 0 | 0 | 0 | 0 | 0 | 0 | 3 | 3 |
| São Bento Abade | 0 | 0 | 0 | 0 | 0 | 0 | 0 | 0 | 0 | 1 | 0 | 0 | 0 | 0 | 0 | 0 | 0 | 0 | 0 | 0 | 0 | 0 | 0 | 1 |
| Total | 33 | 19 | 20 | 11 | 31 | 14 | 33 | 11 | 30 | 15 | 43 | 13 | 28 | 11 | 36 | 11 | 42 | 12 | 47 | 7 | 35 | 8 | 510 | |
| 52 | 31 | 45 | 44 | 45 | 56 | 39 | 47 | 54 | 54 | 43 |
Table 1: Epidemiological survey of HIV by sex from 2010-2020.
In Table 2, data on Aidetic inhabitants are organized in general, in the municipalities of microregion Varginha concerning age group (< 1 year, 1 to 4 years, 5 to 9 years, 10 to 14 years, 15 to 19 years, 20 to 29 years, 30 to 39 years old,
40 to 49 years old, 50 to 59 years old, 60 to 69 years old, 70 to 79 years old and >80 years old) in the years 2010 to 2020. The city of Coqueiral was not available for analysis because there was no confirmed case of AIDS in this historical series (Tables 3 & 4).
| <1 | 1 a 4 | 5 a 9 | 10 a 14 | 15 a 19 | 20 a 29 | 30 a 39 | 40 a 49 | 50 a 59 | 60 a 69 | 70 a 79 | >80 | Total | |
|---|---|---|---|---|---|---|---|---|---|---|---|---|---|
| Varginha | 0 | 0 | 0 | 1 | 12 | 48 | 78 | 45 | 19 | 9 | 3 | 0 | 215 |
| Três Corações | 1 | 0 | 1 | 0 | 0 | 33 | 30 | 24 | 12 | 4 | 1 | 0 | 106 |
| Três Pontas | 1 | 0 | 0 | 0 | 2 | 16 | 28 | 17 | 16 | 1 | 1 | 0 | 82 |
| Boa Esperança | 1 | 0 | 0 | 0 | 0 | 1 | 9 | 6 | 7 | 2 | 0 | 0 | 26 |
| Campos Gerais | 0 | 0 | 0 | 0 | 0 | 3 | 3 | 5 | 1 | 1 | 0 | 0 | 13 |
| Elói Mendes | 0 | 0 | 0 | 0 | 0 | 5 | 7 | 9 | 0 | 0 | 0 | 0 | 21 |
| Campanha | 0 | 0 | 0 | 0 | 0 | 4 | 4 | 6 | 2 | 0 | 0 | 0 | 16 |
| Guapé | 0 | 0 | 0 | 0 | 0 | 0 | 0 | 0 | 0 | 0 | 1 | 0 | 1 |
| Ilicínea | 0 | 0 | 0 | 0 | 0 | 0 | 1 | 2 | 0 | 0 | 0 | 0 | 3 |
| Carmo da Cachoeira | 0 | 0 | 1 | 0 | 1 | 7 | 9 | 6 | 3 | 1 | 1 | 0 | 29 |
| Campo do Meio | 0 | 0 | 0 | 0 | 0 | 0 | 2 | 5 | 0 | 0 | 0 | 0 | 7 |
| Monsenhor Paulo | 0 | 0 | 0 | 0 | 0 | 0 | 1 | 0 | 2 | 0 | 0 | 0 | 3 |
| Santana da Vargem | 0 | 0 | 0 | 0 | 1 | 1 | 1 | 1 | 0 | 0 | 0 | 0 | 4 |
| São Thome das Letras | 0 | 0 | 0 | 0 | 1 | 0 | 1 | 1 | 3 | 0 | 0 | 0 | 6 |
| São Bento Abade | 0 | 0 | 0 | 0 | 0 | 0 | 0 | 1 | 0 | 0 | 0 | 0 | 1 |
| Total | 3 | 0 | 2 | 1 | 17 | 118 | 174 | 128 | 65 | 18 | 7 | 0 | 533 |
Table 2: General epidemiological survey of AIDS in the municipalities of the micro-region of Varginha, 2010-2020.
Then, the data was analysed by city with distinction of female or male sex and by age group. The city with the highest number of people with AIDS was Varginha with 215 cases, followed by Três Corações with 106 cases, with a predominance of males in both cities, and the cities with the lowest number of cases were São Bento Abade and Guapé with 1 case each one. In most cities, the age group was predominant from 30 to 39 years old, with 174 cases out of a total of 533 cases, of which 129 were male, revealing a predominance of the same.
| <1 | 1 a 4 | 5 a 9 | 10 a 14 | 15 a 19 | 20 a 29 | 30 a 39 | 40 a 49 | 50 a 59 | 60 a 69 | 70 a 79 | >80 | Total | ||
|---|---|---|---|---|---|---|---|---|---|---|---|---|---|---|
| 2010 | Masculine | 0 | 0 | 0 | 0 | 0 | 2 | 4 | 3 | 1 | 0 | 0 | 0 | 10 |
| 2010 | Feminine | 0 | 0 | 0 | 0 | 0 | 0 | 3 | 2 | 0 | 1 | 0 | 0 | 6 |
| 2011 | Masculine | 0 | 0 | 0 | 0 | 1 | 2 | 3 | 2 | 0 | 1 | 0 | 0 | 9 |
| 2011 | Feminine | 0 | 0 | 0 | 0 | 1 | 0 | 1 | 0 | 2 | 0 | 0 | 0 | 4 |
| 2012 | Masculine | 0 | 0 | 0 | 1 | 2 | 4 | 8 | 4 | 2 | 0 | 0 | 0 | 21 |
| 2012 | Feminine | 0 | 0 | 0 | 0 | 0 | 0 | 3 | 2 | 1 | 2 | 0 | 0 | 8 |
| 2013 | Masculine | 0 | 0 | 0 | 0 | 1 | 7 | 7 | 4 | 2 | 1 | 0 | 0 | 22 |
| 2013 | Feminine | 0 | 0 | 0 | 0 | 0 | 2 | 1 | 4 | 2 | 1 | 0 | 0 | 10 |
| 2014 | Masculine | 0 | 0 | 0 | 0 | 2 | 6 | 9 | 2 | 0 | 0 | 0 | 0 | 19 |
| 2014 | Feminine | 0 | 0 | 0 | 0 | 0 | 1 | 2 | 0 | 1 | 0 | 0 | 0 | 4 |
| 2015 | Masculine | 0 | 0 | 0 | 0 | 1 | 2 | 8 | 3 | 1 | 0 | 0 | 0 | 15 |
| 2015 | Feminine | 0 | 0 | 0 | 0 | 0 | 0 | 3 | 1 | 0 | 0 | 0 | 0 | 4 |
| 2016 | Masculine | 0 | 0 | 0 | 0 | 0 | 0 | 6 | 6 | 1 | 0 | 0 | 0 | 13 |
| 2016 | Feminine | 0 | 0 | 0 | 0 | 0 | 0 | 1 | 1 | 0 | 1 | 0 | 0 | 3 |
| 2017 | Masculine | 0 | 0 | 0 | 0 | 1 | 5 | 3 | 1 | 1 | 1 | 1 | 0 | 13 |
| 2017 | Feminine | 0 | 0 | 0 | 0 | 0 | 0 | 0 | 0 | 0 | 0 | 1 | 0 | 1 |
| 2018 | Masculine | 0 | 0 | 0 | 0 | 2 | 4 | 6 | 3 | 3 | 0 | 0 | 0 | 18 |
| 2018 | Feminine | 0 | 0 | 0 | 0 | 0 | 0 | 2 | 0 | 0 | 0 | 0 | 0 | 2 |
| 2019 | Masculine | 0 | 0 | 0 | 0 | 0 | 8 | 5 | 4 | 1 | 0 | 0 | 0 | 18 |
| 2019 | Feminine | 0 | 0 | 0 | 0 | 0 | 0 | 0 | 1 | 0 | 0 | 0 | 0 | 1 |
| 2020 | Masculine | 0 | 0 | 0 | 0 | 1 | 4 | 3 | 2 | 1 | 0 | 1 | 0 | 12 |
| 2020 | Feminine | 0 | 0 | 0 | 0 | 0 | 1 | 0 | 0 | 0 | 1 | 0 | 0 | 2 |
| Total | 0 | 0 | 0 | 1 | 12 | 48 | 78 | 45 | 19 | 9 | 3 | 0 | 215 |
Table 3: Epidemiological survey of AIDS by age group in the city of Varginha, 2010-2020.
| <1 | 1 a 4 | 5 a 9 | 10 a 14 | 15 a 19 | 20 a 29 | 30 a 39 | 40 a 49 | 50 a 59 | 60 a 69 | 70 a 79 | >80 | Total | ||
|---|---|---|---|---|---|---|---|---|---|---|---|---|---|---|
| 2010 | Masculine | 0 | 0 | 0 | 0 | 0 | 0 | 4 | 2 | 0 | 1 | 0 | 0 | 7 |
| 2010 | Feminine | 0 | 0 | 0 | 0 | 0 | 0 | 0 | 2 | 1 | 0 | 0 | 0 | 3 |
| 2011 | Masculine | 0 | 0 | 1 | 0 | 0 | 2 | 1 | 3 | 0 | 1 | 0 | 0 | 8 |
| 2011 | Feminine | 0 | 0 | 0 | 0 | 0 | 1 | 2 | 0 | 0 | 0 | 0 | 0 | 3 |
| 2012 | Masculine | 0 | 0 | 0 | 0 | 0 | 5 | 3 | 2 | 2 | 0 | 0 | 0 | 12 |
| 2012 | Feminine | 0 | 0 | 0 | 0 | 0 | 0 | 2 | 1 | 0 | 0 | 0 | 0 | 3 |
| 2013 | Masculine | 0 | 0 | 0 | 0 | 0 | 0 | 2 | 1 | 1 | 0 | 0 | 0 | 4 |
| 2013 | Feminine | 0 | 0 | 0 | 0 | 0 | 0 | 1 | 0 | 0 | 0 | 1 | 0 | 2 |
| 2014 | Masculine | 0 | 0 | 0 | 0 | 0 | 3 | 1 | 0 | 2 | 0 | 0 | 0 | 6 |
| 2014 | Feminine | 0 | 0 | 0 | 0 | 0 | 2 | 0 | 1 | 1 | 0 | 0 | 0 | 4 |
| 2015 | Masculine | 0 | 0 | 0 | 0 | 0 | 5 | 6 | 4 | 0 | 0 | 0 | 0 | 15 |
| 2015 | Feminine | 0 | 0 | 0 | 0 | 0 | 1 | 0 | 1 | 0 | 0 | 0 | 0 | 2 |
| 2016 | Masculine | 0 | 0 | 0 | 0 | 0 | 3 | 3 | 1 | 0 | 1 | 0 | 0 | 8 |
| 2016 | Feminine | 0 | 0 | 0 | 0 | 0 | 1 | 1 | 2 | 2 | 0 | 0 | 0 | 6 |
| 2017 | Masculine | 0 | 0 | 0 | 0 | 0 | 3 | 1 | 1 | 1 | 0 | 0 | 0 | 6 |
| 2017 | Feminine | 0 | 0 | 0 | 0 | 0 | 0 | 1 | 0 | 1 | 0 | 0 | 0 | 2 |
| 2018 | Masculine | 0 | 0 | 0 | 0 | 0 | 1 | 1 | 1 | 1 | 0 | 0 | 0 | 4 |
| 2018 | Feminine | 0 | 0 | 0 | 0 | 0 | 0 | 0 | 0 | 0 | 0 | 0 | 0 | 0 |
| 2019 | Masculine | 0 | 0 | 0 | 0 | 0 | 3 | 1 | 1 | 0 | 0 | 0 | 0 | 5 |
| 2019 | Feminine | 1 | 0 | 0 | 0 | 0 | 1 | 0 | 0 | 0 | 1 | 0 | 0 | 3 |
| 2020 | Masculine | 0 | 0 | 0 | 0 | 0 | 1 | 0 | 1 | 0 | 0 | 0 | 0 | 2 |
| 2020 | Feminine | 0 | 0 | 0 | 0 | 0 | 1 | 0 | 0 | 0 | 0 | 0 | 0 | 1 |
| Total | 1 | 0 | 1 | 0 | 0 | 33 | 30 | 24 | 12 | 4 | 1 | 0 | 106 |
Table 4: Epidemiological survey of AIDS by age group in the city of Três Corações, 2010-2020.
Finally, an analysis of the general panorama of AIDS cases in the Brazilian states was carried out (Acre, Alagoas, Amapá, Amazonas, Bahia, Ceará, Federal District, Espírito Santo, Goiás, Maranhão, Mato Grosso, Mato Grosso do Sul, Minas Gerais , Pará, Paraíba, Paraná, Pernambuco, Piauí, Rio de Janeiro, Rio Grande do Norte, Rio Grande do Sul, Rondônia, Roraima, Santa Catarina, São Paulo, Sergipe, Tocantins) to compare the data obtained, observing if the same happens in different regions of Brazil, thus, it was observed that there are four states with the highest prevalence of cases: São Paulo (88,147), Rio de Janeiro (53,076), Rio Grande do Sul (44,472) and Minas Gerais (30,977). In addition, it was also observed that in all the analyzed states, there was a higher prevalence among males (Tables 5-10).
| <1 | 1 a 4 | 5 a 9 | 10 a 14 | 15 a 19 | 20 a 29 | 30 a 39 | 40 a 49 | 50 a 59 | 60 a 69 | 70 a 79 | >80 | Total | ||
|---|---|---|---|---|---|---|---|---|---|---|---|---|---|---|
| 2010 | Masculine | 0 | 0 | 0 | 0 | 0 | 0 | 1 | 0 | 0 | 0 | 0 | 0 | 1 |
| 2010 | Feminine | 0 | 0 | 0 | 0 | 0 | 2 | 3 | 2 | 0 | 0 | 0 | 0 | 7 |
| 2011 | Masculine | 0 | 0 | 0 | 0 | 0 | 0 | 0 | 1 | 1 | 0 | 0 | 0 | 2 |
| 2011 | Feminine | 0 | 0 | 0 | 0 | 0 | 1 | 2 | 0 | 1 | 0 | 0 | 0 | 4 |
| 2012 | Masculine | 0 | 0 | 0 | 0 | 0 | 0 | 4 | 5 | 0 | 0 | 0 | 0 | 9 |
| 2012 | Feminine | 0 | 0 | 0 | 0 | 0 | 0 | 0 | 1 | 1 | 0 | 0 | 0 | 2 |
| 2013 | Masculine | 0 | 0 | 0 | 0 | 0 | 4 | 0 | 0 | 1 | 0 | 0 | 0 | 5 |
| 2013 | Feminine | 0 | 0 | 0 | 0 | 0 | 0 | 0 | 0 | 1 | 0 | 0 | 0 | 1 |
| 2014 | Masculine | 0 | 0 | 0 | 0 | 1 | 2 | 4 | 1 | 2 | 1 | 0 | 0 | 11 |
| 2014 | Feminine | 0 | 0 | 0 | 0 | 0 | 0 | 1 | 1 | 1 | 0 | 0 | 0 | 3 |
| 2015 | Masculine | 0 | 0 | 0 | 0 | 1 | 2 | 2 | 1 | 1 | 0 | 0 | 0 | 7 |
| 2015 | Feminine | 0 | 0 | 0 | 0 | 0 | 0 | 1 | 1 | 0 | 0 | 0 | 0 | 2 |
| 2016 | Masculine | 1 | 0 | 0 | 0 | 0 | 1 | 2 | 2 | 1 | 0 | 0 | 0 | 7 |
| 2016 | Feminine | 0 | 0 | 0 | 0 | 0 | 0 | 1 | 0 | 2 | 0 | 0 | 0 | 3 |
| 2017 | Masculine | 0 | 0 | 0 | 0 | 0 | 2 | 2 | 0 | 1 | 0 | 0 | 0 | 5 |
| 2017 | Feminine | 0 | 0 | 0 | 0 | 0 | 0 | 1 | 0 | 2 | 0 | 0 | 0 | 3 |
| 2018 | Masculine | 0 | 0 | 0 | 0 | 0 | 1 | 1 | 0 | 0 | 0 | 0 | 0 | 2 |
| 2018 | Feminine | 0 | 0 | 0 | 0 | 0 | 0 | 1 | 0 | 1 | 0 | 0 | 0 | 2 |
| 2019 | Masculine | 0 | 0 | 0 | 0 | 0 | 1 | 2 | 1 | 0 | 0 | 0 | 0 | 4 |
| 2019 | Feminine | 0 | 0 | 0 | 0 | 0 | 0 | 0 | 1 | 0 | 0 | 0 | 0 | 1 |
| 2020 | Masculine | 0 | 0 | 0 | 0 | 0 | 0 | 0 | 0 | 0 | 0 | 1 | 0 | 1 |
| 2020 | Feminine | 0 | 0 | 0 | 0 | 0 | 0 | 0 | 0 | 0 | 0 | 0 | 0 | 0 |
| Total | 1 | 0 | 0 | 0 | 2 | 16 | 28 | 17 | 16 | 1 | 1 | 0 | 82 |
Table 5: Epidemiological survey of AIDS by age group in the city of Três Pontas, 2010-2020.
| <1 | 1 a 4 | 5 a 9 | 10 a 14 | 15 a 19 | 20 a 29 | 30 a 39 | 40 a 49 | 50 a 59 | 60 a 69 | 70 a 79 | >80 | Total | ||
|---|---|---|---|---|---|---|---|---|---|---|---|---|---|---|
| 2010 | Masculine | 0 | 0 | 0 | 0 | 0 | 0 | 2 | 0 | 0 | 0 | 0 | 0 | 2 |
| 2010 | Feminine | 0 | 0 | 0 | 0 | 0 | 0 | 0 | 0 | 0 | 0 | 0 | 0 | 0 |
| 2011 | Masculine | 0 | 0 | 0 | 0 | 0 | 0 | 1 | 0 | 2 | 0 | 0 | 0 | 3 |
| 2011 | Feminine | 0 | 0 | 0 | 0 | 0 | 0 | 3 | 0 | 0 | 0 | 0 | 0 | 3 |
| 2012 | Masculine | 0 | 0 | 0 | 0 | 0 | 0 | 0 | 0 | 0 | 0 | 0 | 0 | 0 |
| 2012 | Feminine | 1 | 0 | 0 | 0 | 0 | 0 | 0 | 1 | 0 | 1 | 0 | 0 | 3 |
| 2013 | Masculine | 0 | 0 | 0 | 0 | 0 | 0 | 0 | 2 | 0 | 0 | 0 | 0 | 2 |
| 2013 | Feminine | 0 | 0 | 0 | 0 | 0 | 0 | 0 | 0 | 0 | 0 | 0 | 0 | 0 |
| 2014 | Masculine | 0 | 0 | 0 | 0 | 0 | 0 | 0 | 1 | 1 | 0 | 0 | 0 | 2 |
| 2014 | Feminine | 0 | 0 | 0 | 0 | 0 | 0 | 0 | 0 | 0 | 0 | 0 | 0 | 0 |
| 2015 | Masculine | 0 | 0 | 0 | 0 | 0 | 0 | 0 | 1 | 0 | 0 | 0 | 0 | 1 |
| 2015 | Feminine | 0 | 0 | 0 | 0 | 0 | 0 | 0 | 1 | 0 | 0 | 0 | 0 | 1 |
| 2016 | Masculine | 0 | 0 | 0 | 0 | 0 | 0 | 0 | 0 | 0 | 1 | 0 | 0 | 1 |
| 2016 | Feminine | 0 | 0 | 0 | 0 | 0 | 0 | 0 | 0 | 1 | 0 | 0 | 0 | 1 |
| 2017 | Masculine | 0 | 0 | 0 | 0 | 0 | 0 | 0 | 0 | 0 | 0 | 0 | 0 | 0 |
| 2017 | Feminine | 0 | 0 | 0 | 0 | 0 | 0 | 0 | 0 | 2 | 0 | 0 | 0 | 2 |
| 2018 | Masculine | 0 | 0 | 0 | 0 | 0 | 1 | 1 | 0 | 1 | 0 | 0 | 0 | 3 |
| 2018 | Feminine | 0 | 0 | 0 | 0 | 0 | 0 | 0 | 0 | 0 | 0 | 0 | 0 | 0 |
| 2019 | Masculine | 0 | 0 | 0 | 0 | 0 | 0 | 0 | 0 | 0 | 0 | 0 | 0 | 0 |
| 2019 | Feminine | 0 | 0 | 0 | 0 | 0 | 0 | 1 | 0 | 0 | 0 | 0 | 0 | 1 |
| 2020 | Masculine | 0 | 0 | 0 | 0 | 0 | 0 | 1 | 0 | 0 | 0 | 0 | 0 | 1 |
| 2020 | Feminine | 0 | 0 | 0 | 0 | 0 | 0 | 0 | 0 | 0 | 0 | 0 | 0 | 0 |
| Total | 1 | 0 | 0 | 0 | 0 | 1 | 9 | 6 | 7 | 2 | 0 | 0 | 26 |
Table 6: Epidemiological survey of AIDS by age group in the city of Boa Esperança, 2010-2020.
| AGE | <1 | 1a 4 | 5 a 9 | 10 a 14 | 15 a 19 | 20 a 29 | 30 a 39 | 40 a 49 | 50 a 59 | 60 a 69 | 70 a 79 | > 80 | Total | |
|---|---|---|---|---|---|---|---|---|---|---|---|---|---|---|
| 2010 | Masculine | 0 | 0 | 0 | 0 | 0 | 0 | 0 | 2 | 0 | 0 | 0 | 0 | 2 |
| Feminine | 0 | 0 | 0 | 0 | 0 | 0 | 0 | 0 | 0 | 0 | 0 | 0 | 0 | |
| 2011 | Masculine | 0 | 0 | 0 | 0 | 0 | 0 | 0 | 0 | 0 | 0 | 0 | 0 | 0 |
| Feminine | 0 | 0 | 0 | 0 | 0 | 0 | 0 | 0 | 0 | 0 | 0 | 0 | 0 | |
| 2012 | Masculine | 0 | 0 | 0 | 0 | 0 | 0 | 0 | 0 | 0 | 0 | 0 | 0 | 0 |
| Feminine | 0 | 0 | 0 | 0 | 0 | 0 | 0 | 1 | 0 | 0 | 0 | 0 | 1 | |
| 2013 | Masculine | 0 | 0 | 0 | 0 | 0 | 0 | 0 | 0 | 0 | 1 | 0 | 0 | 1 |
| Feminine | 0 | 0 | 0 | 0 | 0 | 0 | 0 | 0 | 1 | 0 | 0 | 0 | 1 | |
| 2014 | Masculine | 0 | 0 | 0 | 0 | 0 | 0 | 0 | 1 | 0 | 0 | 0 | 0 | 1 |
| Feminine | 0 | 0 | 0 | 0 | 0 | 0 | 1 | 0 | 0 | 0 | 0 | 0 | 1 | |
| 2015 | Masculine | 0 | 0 | 0 | 0 | 0 | 2 | 0 | 0 | 0 | 0 | 0 | 0 | 2 |
| Feminine | 0 | 0 | 0 | 0 | 0 | 0 | 0 | 0 | 0 | 0 | 0 | 0 | 0 | |
| 2016 | Masculine | 0 | 0 | 0 | 0 | 0 | 0 | 0 | 0 | 0 | 0 | 0 | 0 | 0 |
| Feminine | 0 | 0 | 0 | 0 | 0 | 0 | 0 | 1 | 0 | 0 | 0 | 0 | 1 | |
| 2017 | Masculine | 0 | 0 | 0 | 0 | 0 | 1 | 0 | 0 | 0 | 0 | 0 | 0 | 1 |
| Feminine | 0 | 0 | 0 | 0 | 0 | 0 | 2 | 0 | 0 | 0 | 0 | 0 | 2 | |
| 2018 | Masculine | 0 | 0 | 0 | 0 | 0 | 0 | 0 | 0 | 0 | 0 | 0 | 0 | 0 |
| Feminine | 0 | 0 | 0 | 0 | 0 | 0 | 0 | 0 | 0 | 0 | 0 | 0 | 0 | |
| 2019 | Masculine | 0 | 0 | 0 | 0 | 0 | 0 | 0 | 0 | 0 | 0 | 0 | 0 | 0 |
| Feminine | 0 | 0 | 0 | 0 | 0 | 0 | 0 | 0 | 0 | 0 | 0 | 0 | 0 | |
| 2020 | Masculine | 0 | 0 | 0 | 0 | 0 | 0 | 0 | 0 | 0 | 0 | 0 | 0 | 0 |
| Feminine | 0 | 0 | 0 | 0 | 0 | 0 | 0 | 0 | 0 | 0 | 0 | 0 | 0 | |
| Total | 0 | 0 | 0 | 0 | 0 | 3 | 3 | 5 | 1 | 1 | 0 | 0 | 13 | |
| AGE | <1 | 1 a 4 | 5 a 9 | 10 a 14 | 15 a 19 | 20 a 29 | 30 a 39 | 40 a 49 | 50 a 59 | 60 a 69 | 70 a 79 | >80 | Total | |
| 2010 | Masculine | 0 | 0 | 0 | 0 | 0 | 0 | 0 | 0 | 0 | 0 | 0 | 0 | 0 |
| Feminine | 0 | 0 | 0 | 0 | 0 | 0 | 0 | 0 | 0 | 0 | 0 | 0 | 0 | |
| 2011 | Masculine | 0 | 0 | 0 | 0 | 0 | 0 | 0 | 0 | 0 | 0 | 0 | 0 | 0 |
| Feminine | 0 | 0 | 0 | 0 | 0 | 0 | 0 | 0 | 0 | 0 | 0 | 0 | 0 | |
| 2012 | Masculine | 0 | 0 | 0 | 0 | 0 | 0 | 1 | 0 | 0 | 0 | 0 | 0 | 1 |
| Feminine | 0 | 0 | 0 | 0 | 0 | 0 | 0 | 0 | 0 | 0 | 0 | 0 | 0 | |
| 2013 | Masculine | 0 | 0 | 0 | 0 | 0 | 2 | 1 | 0 | 0 | 0 | 0 | 0 | 3 |
| Feminine | 0 | 0 | 0 | 0 | 0 | 1 | 0 | 0 | 0 | 0 | 0 | 0 | 1 | |
| 2014 | Masculine | 0 | 0 | 0 | 0 | 0 | 0 | 0 | 2 | 0 | 0 | 0 | 0 | 2 |
| Feminine | 0 | 0 | 0 | 0 | 0 | 0 | 0 | 0 | 0 | 0 | 0 | 0 | 0 | |
| 2015 | Masculine | 0 | 0 | 0 | 0 | 0 | 0 | 0 | 2 | 0 | 0 | 0 | 0 | 2 |
| Feminine | 0 | 0 | 0 | 0 | 0 | 0 | 0 | 1 | 0 | 0 | 0 | 0 | 1 | |
| 2016 | Masculine | 0 | 0 | 0 | 0 | 0 | 0 | 0 | 0 | 0 | 0 | 0 | 0 | 0 |
| Feminine | 0 | 0 | 0 | 0 | 0 | 1 | 0 | 0 | 0 | 0 | 0 | 0 | 1 | |
| 2017 | Masculine | 0 | 0 | 0 | 0 | 0 | 1 | 1 | 1 | 0 | 0 | 0 | 0 | 3 |
| Feminine | 0 | 0 | 0 | 0 | 0 | 0 | 1 | 0 | 0 | 0 | 0 | 0 | 1 | |
| 2018 | Masculine | 0 | 0 | 0 | 0 | 0 | 0 | 0 | 0 | 0 | 0 | 0 | 0 | 0 |
| Feminine | 0 | 0 | 0 | 0 | 0 | 0 | 0 | 0 | 0 | 0 | 0 | 0 | 0 | |
| 2019 | Masculine | 0 | 0 | 0 | 0 | 0 | 0 | 2 | 2 | 0 | 0 | 0 | 0 | 4 |
| Feminine | 0 | 0 | 0 | 0 | 0 | 0 | 0 | 1 | 0 | 0 | 0 | 0 | 1 | |
| 2020 | Masculine | 0 | 0 | 0 | 0 | 0 | 0 | 0 | 0 | 0 | 0 | 0 | 0 | 0 |
| Feminine | 0 | 0 | 0 | 0 | 0 | 0 | 1 | 0 | 0 | 0 | 0 | 0 | 1 | |
| Total | 0 | 0 | 0 | 0 | 0 | 5 | 7 | 9 | 0 | 0 | 0 | 0 | 21 |
Table 7: Epidemiological survey of AIDS by age group in the city of Campos Gerais, 2010-2020.
| <1 | 1a 4 | 5 a 9 | 10 a 14 | 15 a 19 | 20 a 29 | 30 a 39 | 40 a 49 | 50 a 59 | 60 a 69 | 70 a 79 | >80 | Total | ||
|---|---|---|---|---|---|---|---|---|---|---|---|---|---|---|
| 2010 | Masculine | 0 | 0 | 0 | 0 | 0 | 1 | 1 | 3 | 0 | 0 | 0 | 0 | 5 |
| 2010 | Feminine | 0 | 0 | 0 | 0 | 0 | 0 | 0 | 1 | 0 | 0 | 0 | 0 | 1 |
| 2011 | Masculine | 0 | 0 | 0 | 0 | 0 | 0 | 1 | 0 | 0 | 0 | 0 | 0 | 1 |
| 2011 | Feminine | 0 | 0 | 0 | 0 | 0 | 0 | 0 | 0 | 0 | 0 | 0 | 0 | 0 |
| 2012 | Masculine | 0 | 0 | 0 | 0 | 0 | 0 | 1 | 0 | 0 | 0 | 0 | 0 | 1 |
| 2012 | Feminine | 0 | 0 | 0 | 0 | 0 | 0 | 0 | 1 | 0 | 0 | 0 | 0 | 1 |
| 2013 | Masculine | 0 | 0 | 0 | 0 | 0 | 0 | 1 | 1 | 0 | 0 | 0 | 0 | 2 |
| 2013 | Feminine | 0 | 0 | 0 | 0 | 0 | 0 | 0 | 0 | 0 | 0 | 0 | 0 | 0 |
| 2014 | Masculine | 0 | 0 | 0 | 0 | 0 | 0 | 0 | 0 | 0 | 0 | 0 | 0 | 0 |
| 2014 | Feminine | 0 | 0 | 0 | 0 | 0 | 0 | 0 | 0 | 0 | 0 | 0 | 0 | 0 |
| 2015 | Masculine | 0 | 0 | 0 | 0 | 0 | 1 | 0 | 1 | 0 | 0 | 0 | 0 | 2 |
| 2015 | Feminine | 0 | 0 | 0 | 0 | 0 | 0 | 0 | 0 | 0 | 0 | 0 | 0 | 0 |
| 2016 | Masculine | 0 | 0 | 0 | 0 | 0 | 0 | 0 | 0 | 0 | 0 | 0 | 0 | 0 |
| 2016 | Feminine | 0 | 0 | 0 | 0 | 0 | 0 | 0 | 0 | 0 | 0 | 0 | 0 | 0 |
| 2017 | Masculine | 0 | 0 | 0 | 0 | 0 | 0 | 0 | 0 | 0 | 0 | 0 | 0 | 0 |
| 2017 | Feminine | 0 | 0 | 0 | 0 | 0 | 0 | 0 | 0 | 0 | 0 | 0 | 0 | 0 |
| 2018 | Masculine | 0 | 0 | 0 | 0 | 0 | 1 | 0 | 0 | 0 | 0 | 0 | 0 | 1 |
| 2018 | Feminine | 0 | 0 | 0 | 0 | 0 | 0 | 0 | 0 | 0 | 0 | 0 | 0 | 0 |
| 2019 | Masculine | 0 | 0 | 0 | 0 | 0 | 1 | 0 | 0 | 0 | 0 | 0 | 0 | 1 |
| 2019 | Feminine | 0 | 0 | 0 | 0 | 0 | 0 | 0 | 0 | 0 | 0 | 0 | 0 | 0 |
| 2020 | Masculine | 0 | 0 | 0 | 0 | 0 | 0 | 0 | 0 | 1 | 0 | 0 | 0 | 1 |
| 2020 | Feminine | 0 | 0 | 0 | 0 | 0 | 0 | 0 | 0 | 0 | 0 | 0 | 0 | 0 |
| Total | 0 | 0 | 0 | 0 | 0 | 4 | 4 | 6 | 2 | 0 | 0 | 0 | 16 |
Table 8: Epidemiological survey of AIDS by age group in the city of Campanha, 2010-2020.
| <1 | 1 a 4 | 5 a 9 | 10 a 14 | 15 a 19 | 20 a 29 | 30 a 39 | 40 a 49 | 50 a 59 | 60 a 69 | 70 a 79 | >80 | Total | ||
|---|---|---|---|---|---|---|---|---|---|---|---|---|---|---|
| 2017 | Masculine | 0 | 0 | 0 | 0 | 0 | 0 | 0 | 0 | 0 | 0 | 1 | 0 | 1 |
| 2017 | Feminine | 0 | 0 | 0 | 0 | 0 | 0 | 0 | 0 | 0 | 0 | 0 | 0 | 0 |
| Total | 0 | 0 | 0 | 0 | 0 | 0 | 0 | 0 | 0 | 0 | 1 | 0 | 1 |
Table 9: Epidemiological survey of AIDS by age group in the city of Guapé, 2017.
Discussion
After analysing the graphs and tables, it was found that, from 2010 to 2020, there were 510 diagnosed cases of HIV and 533 individuals living with AIDS, with most of these cases, being both for patients with AIDS and individuals with HIV infection. HIV, belongs to the male sex (392 cases of AIDS and 378 cases of HIV), which is confirmed through the literature, which claimed that there are more cases of HIV/AIDS in male patients than female patients, in which the prevalence ratio of AIDS (number of cases in men divided by the number of cases in women), carried out by the Ministry of Health in 2009, was about 1.6 cases of AIDS in men for each woman [11], in this study the prevalence was approximately
2.8 cases of AIDS in men for each woman, differing about the proportion proposed previously.
Regarding the average age, the age group was predominant from 30 to 39 years old, with 174 cases, the maximum age group presented was 70 to 79 years old and the minimum age group was less than 1 year old, this fact is in agreement with another study, where the average age was 39 years, with a maximum of 71 years, differing only in the minimum of 9 years [11]. According to data obtained from the Government database, they suggest that the highest incidence of AIDS occurs between 20 and 59 years of age [12] (Tables 11-13).
| AGE | <1 | 1 a 4 | 5 a 9 | 10 a 14 | 15 a 19 | 20 a 29 | 30 a 39 | 40 a 49 | 50 a 59 | 60 a 69 | 70 a 79 | > 80 | Total | |
|---|---|---|---|---|---|---|---|---|---|---|---|---|---|---|
| 2017 | Masculine | 0 | 0 | 0 | 0 | 0 | 0 | 0 | 1 | 0 | 0 | 0 | 0 | 1 |
| Feminine | 0 | 0 | 0 | 0 | 0 | 0 | 0 | 0 | 0 | 0 | 0 | 0 | 0 | |
| 2018 | Masculine | 0 | 0 | 0 | 0 | 0 | 0 | 0 | 0 | 0 | 0 | 0 | 0 | 0 |
| Feminine | 0 | 0 | 0 | 0 | 0 | 0 | 0 | 0 | 0 | 0 | 0 | 0 | 0 | |
| 2019 | Masculine | 0 | 0 | 0 | 0 | 0 | 0 | 0 | 1 | 0 | 0 | 0 | 0 | 1 |
| Feminine | 0 | 0 | 0 | 0 | 0 | 0 | 0 | 0 | 0 | 0 | 0 | 0 | 0 | |
| 2020 | Masculine | 0 | 0 | 0 | 0 | 0 | 0 | 1 | 0 | 0 | 0 | 0 | 0 | 1 |
| Feminine | 0 | 0 | 0 | 0 | 0 | 0 | 0 | 0 | 0 | 0 | 0 | 0 | 0 | |
| Total | 0 | 0 | 0 | 0 | 0 | 0 | 1 | 2 | 0 | 0 | 0 | 0 | 3 | |
| AGE | <1 | 1a4 | 5a9 | 10 a14 | 15a19 | 20a29 | 30a39 | 40a49 | 50a59 | 60a69 | 70a79 | > 80 | Total | |
| 2010 | Masculine | 0 | 0 | 0 | 0 | 1 | 2 | 0 | 0 | 0 | 0 | 0 | 0 | 3 |
| Feminine | 0 | 0 | 0 | 0 | 0 | 0 | 1 | 1 | 1 | 0 | 0 | 0 | 3 | |
| 2011 | Masculine | 0 | 0 | 0 | 0 | 0 | 0 | 2 | 1 | 0 | 0 | 0 | 0 | 3 |
| Feminine | 0 | 0 | 0 | 0 | 0 | 1 | 1 | 0 | 0 | 0 | 0 | 0 | 2 | |
| 2012 | Masculine | 0 | 0 | 1 | 0 | 0 | 0 | 2 | 1 | 1 | 0 | 0 | 0 | 5 |
| Feminine | 0 | 0 | 0 | 0 | 0 | 0 | 0 | 0 | 0 | 0 | 0 | 0 | 0 | |
| 2013 | Masculine | 0 | 0 | 0 | 0 | 0 | 0 | 0 | 0 | 0 | 0 | 0 | 0 | 0 |
| Feminine | 0 | 0 | 0 | 0 | 0 | 0 | 0 | 0 | 0 | 1 | 0 | 0 | 1 | |
| 2014 | Masculine | 0 | 0 | 0 | 0 | 0 | 0 | 1 | 0 | 0 | 0 | 0 | 0 | 1 |
| Feminine | 0 | 0 | 0 | 0 | 0 | 0 | 0 | 1 | 1 | 0 | 0 | 0 | 2 | |
| 2015 | Masculine | 0 | 0 | 0 | 0 | 0 | 1 | 0 | 0 | 0 | 0 | 0 | 0 | 1 |
| Feminine | 0 | 0 | 0 | 0 | 0 | 0 | 0 | 0 | 0 | 0 | 0 | 0 | 0 | |
| 2016 | Masculine | 0 | 0 | 0 | 0 | 0 | 0 | 0 | 1 | 0 | 0 | 0 | 0 | 1 |
| Feminine | 0 | 0 | 0 | 0 | 0 | 0 | 0 | 0 | 0 | 0 | 0 | 0 | 0 | |
| 2017 | Masculine | 0 | 0 | 0 | 0 | 0 | 0 | 1 | 1 | 0 | 0 | 0 | 0 | 2 |
| Feminine | 0 | 0 | 0 | 0 | 0 | 0 | 0 | 0 | 0 | 0 | 0 | 0 | 0 | |
| 2018 | Masculine | 0 | 0 | 0 | 0 | 0 | 1 | 0 | 0 | 0 | 0 | 1 | 0 | 2 |
| Feminine | 0 | 0 | 0 | 0 | 0 | 1 | 0 | 0 | 0 | 0 | 0 | 0 | 1 | |
| 2019 | Masculine | 0 | 0 | 0 | 0 | 0 | 1 | 0 | 0 | 0 | 0 | 0 | 0 | 1 |
| Feminine | 0 | 0 | 0 | 0 | 0 | 0 | 0 | 0 | 0 | 0 | 0 | 0 | 0 | |
| 2020 | Masculine | 0 | 0 | 0 | 0 | 0 | 0 | 1 | 0 | 0 | 0 | 0 | 0 | 1 |
| Feminine | 0 | 0 | 0 | 0 | 0 | 0 | 0 | 0 | 0 | 0 | 0 | 0 | 0 | |
| Total | 0 | 0 | 1 | 0 | 1 | 7 | 9 | 6 | 3 | 1 | 1 | 0 | 29 |
Table 10: Epidemiological survey of AIDS by age group in the city of Ilicínea, 2017-2020.
| <1 | 1 a 4 | 5 a 9 | 10 a 14 | 15 a 19 | 20 a 29 | 30 a 39 | 40 a 49 | 50 a 59 | 60 a 69 | 70 a 79 | > 80 | Total | ||
|---|---|---|---|---|---|---|---|---|---|---|---|---|---|---|
| 2013 | Masculine | 0 | 0 | 0 | 0 | 0 | 0 | 0 | 1 | 0 | 0 | 0 | 0 | 1 |
| 2013 | Feminine | 0 | 0 | 0 | 0 | 0 | 0 | 0 | 0 | 0 | 0 | 0 | 0 | 0 |
| 2014 | Masculine | 0 | 0 | 0 | 0 | 0 | 0 | 0 | 3 | 0 | 0 | 0 | 0 | 3 |
| 2014 | Feminine | 0 | 0 | 0 | 0 | 0 | 0 | 0 | 0 | 0 | 0 | 0 | 0 | 0 |
| 2015 | Masculine | 0 | 0 | 0 | 0 | 0 | 0 | 2 | 1 | 0 | 0 | 0 | 0 | 3 |
| 2015 | Feminine | 0 | 0 | 0 | 0 | 0 | 0 | 0 | 0 | 0 | 0 | 0 | 0 | 0 |
| Total | 0 | 0 | 0 | 0 | 0 | 0 | 2 | 5 | 0 | 0 | 0 | 0 | 7 |
Table 11: Epidemiological survey of AIDS by age group in the city of Campo do Meio, 2013-2015.
The HIV incidence rate in the present study has remained constant over the years, ranging from 31 to 54 cases, where the peak occurred in the years 2018 and 2019, with 54 cases. On the other hand, the AIDS incidence rate has decreased over the years, where the peak occurred in 2012 with 70 cases, reaching 23 cases in the last year of analysis, data that are in agreement with what was described by another author, to say that since 2012 there has been a decrease in the detection rate of new infections in Brazil, from 21.9 cases per 100,000 inhabitants to 17.8 cases per 100,000 inhabitants [12]. A study carried out by Martins, et al. [13] also says that in recent years the detection of AIDS in the country has increased by 2%, but in the Southeast and South regions there was a decrease compared to other regions (Tables 14 & 15).
| <1 | 1 a 4 | 5 a 9 | 10 a 14 | 15 a 19 | 20 a 29 | 30 a 39 | 40 a 49 | 50 a 59 | 60 a 69 | 70 a 79 | >80 | Total | ||
|---|---|---|---|---|---|---|---|---|---|---|---|---|---|---|
| 2012 | Masculine | 0 | 0 | 0 | 0 | 0 | 0 | 0 | 0 | 1 | 0 | 0 | 0 | 1 |
| Feminine | 0 | 0 | 0 | 0 | 0 | 0 | 0 | 0 | 0 | 0 | 0 | 0 | 0 | |
| 2019 | Masculine | 0 | 0 | 0 | 0 | 0 | 0 | 1 | 0 | 0 | 0 | 0 | 0 | 1 |
| Feminine | 0 | 0 | 0 | 0 | 0 | 0 | 0 | 0 | 1 | 0 | 0 | 0 | 1 | |
| 2020 | Masculine | 0 | 0 | 0 | 0 | 0 | 0 | 0 | 0 | 0 | 0 | 0 | 0 | 0 |
| Feminine | 0 | 0 | 0 | 0 | 0 | 0 | 0 | 0 | 0 | 0 | 0 | 0 | 0 | |
| Total | 0 | 0 | 0 | 0 | 0 | 0 | 1 | 0 | 2 | 0 | 0 | 0 | 3 |
Table 12: Epidemiological survey of AIDS by age group in the city of Monsenhor Paulo, 2013-2015.
| <1 | 1 a 4 | 5 a 9 | 10 a 14 | 15 a 19 | 20 a 29 | 30 a 39 | 40 a 49 | 50 a 59 | 60 a 69 | 70 a 79 | > 80 | Total | ||
|---|---|---|---|---|---|---|---|---|---|---|---|---|---|---|
| 2010 | Feminine | 0 | 0 | 0 | 0 | 0 | 0 | 1 | 0 | 0 | 0 | 0 | 0 | 1 |
| Masculine | 0 | 0 | 0 | 0 | 0 | 0 | 0 | 0 | 0 | 0 | 0 | 0 | 0 | |
| 2011 | Feminine | 0 | 0 | 0 | 0 | 0 | 0 | 0 | 0 | 0 | 0 | 0 | 0 | 0 |
| Masculine | 0 | 0 | 0 | 0 | 0 | 0 | 0 | 0 | 0 | 0 | 0 | 0 | 0 | |
| 2012 | Feminine | 0 | 0 | 0 | 0 | 0 | 1 | 0 | 0 | 0 | 0 | 0 | 0 | 1 |
| Masculine | 0 | 0 | 0 | 0 | 0 | 0 | 0 | 0 | 0 | 0 | 0 | 0 | 0 | |
| 2013 | Feminine | 0 | 0 | 0 | 0 | 0 | 0 | 0 | 1 | 0 | 0 | 0 | 0 | 1 |
| Masculine | 0 | 0 | 0 | 0 | 0 | 0 | 0 | 0 | 0 | 0 | 0 | 0 | 0 | |
| 2017 | Feminine | 0 | 0 | 0 | 0 | 1 | 0 | 0 | 0 | 0 | 0 | 0 | 0 | 1 |
| Total | 0 | 0 | 0 | 0 | 1 | 1 | 1 | 1 | 0 | 0 | 0 | 0 | 4 |
Table 13: Epidemiological survey of AIDS by age group in the city of Santana da Vargem, 2010-2013 and 2017.
However, it must be taken into account that the reason for the number of AIDS cases decreasing and the number of HIV cases to be constant was because there are currently antiretroviral drugs, which prevent the virus from multiplying so that the pathogen is often almost undetectable, the patient does not develop the most advanced stage of the infection and reduces the effects caused by it, with consequent benefits for the individual, such as increased disposition, energy and appetite, increased life expectancy and non-development of opportunistic diseases, resulting in a greater number of people living with HIV [14] (Table 16).
| <1 | 1 a 4 | 5 a 9 | 10 a 14 | 15 a 19 | 20 a 29 | 30 a 39 | 40 a 49 | 50 a 59 | 60 a 69 | 70 a 79 | >80 | Total | ||
|---|---|---|---|---|---|---|---|---|---|---|---|---|---|---|
| 2010 | Masculine | 0 | 0 | 0 | 0 | 1 | 0 | 0 | 0 | 0 | 0 | 0 | 0 | 1 |
| Feminine | 0 | 0 | 0 | 0 | 0 | 0 | 0 | 0 | 1 | 0 | 0 | 0 | 1 | |
| 2011 | Masculine | 0 | 0 | 0 | 0 | 0 | 0 | 0 | 0 | 0 | 0 | 0 | 0 | 0 |
| Feminine | 0 | 0 | 0 | 0 | 0 | 0 | 0 | 0 | 0 | 0 | 0 | 0 | 0 | |
| 2012 | Masculine | 0 | 0 | 0 | 0 | 0 | 0 | 0 | 0 | 1 | 0 | 0 | 0 | 1 |
| Feminine | 0 | 0 | 0 | 0 | 0 | 0 | 0 | 0 | 0 | 0 | 0 | 0 | 0 | |
| 2013 | Masculine | 0 | 0 | 0 | 0 | 0 | 0 | 0 | 0 | 0 | 0 | 0 | 0 | 0 |
| Feminine | 0 | 0 | 0 | 0 | 0 | 0 | 0 | 0 | 0 | 0 | 0 | 0 | 0 | |
| 2014 | Masculine | 0 | 0 | 0 | 0 | 0 | 0 | 0 | 0 | 0 | 0 | 0 | 0 | 0 |
| Feminine | 0 | 0 | 0 | 0 | 0 | 0 | 0 | 0 | 1 | 0 | 0 | 0 | 1 | |
| 2015 | Masculine | 0 | 0 | 0 | 0 | 0 | 0 | 0 | 1 | 0 | 0 | 0 | 0 | 1 |
| Feminine | 0 | 0 | 0 | 0 | 0 | 0 | 1 | 0 | 0 | 0 | 0 | 0 | 1 | |
| Total | 0 | 0 | 0 | 0 | 1 | 0 | 1 | 1 | 3 | 0 | 0 | 0 | 6 |
Table 14: Epidemiological survey of AIDS by age group in the city of São Thomé das Letras, 2010-2015.
Concerning the data found in the Government database (TabNet and DCCI), governed by Sinan (Information System on Notifiable Diseases), which has the objective of the recording and processing the data on the complaints of compulsory notification and providing information for analysis of the incidence rate and prevalence of the disease [15], it was possible to observe that there were divergences between the various updates, in addition to some variables, such as the age group in HIV, not being present. Gonçalves, et al. [16] consider this fact a reflection of underreporting, lack of organization of systems and low-quality of data collection systems, where often obtaining these data is very bureaucratic and limited, resulting in inconsistent and inconsistent information, compromising In addition to epidemiological analyses, Rique and Silva [15] considered that the country’s databases are underused for decision- making and scientific production.
Another point that must be taken into account is the knowledge of the population regarding their diagnosis, today it is estimated that 920 thousand people living with HIV/ AIDS in Brazil, but 135 thousand individuals are unaware of their diagnosis, therefore, the Ministry of Saúde launches campaigns that encourage people to prevent themselves and seek Basic Health Units to perform the rapid test, and if positive, continue with the treatment [17] (Table 17).
| <1 | 1 a 4 | 5 a 9 | 10 a 14 | 15 a 19 | 20 a 29 | 30 a 39 | 40 a 49 | 50 a 59 | 60 a 69 | 70 a 79 | >80 | Total | ||
|---|---|---|---|---|---|---|---|---|---|---|---|---|---|---|
| 2014 | Masculine | 0 | 0 | 0 | 0 | 0 | 0 | 0 | 0 | 0 | 0 | 0 | 0 | 0 |
| 2014 | Feminine | 0 | 0 | 0 | 0 | 0 | 0 | 0 | 1 | 0 | 0 | 0 | 0 | 1 |
| Total | 0 | 0 | 0 | 0 | 0 | 0 | 0 | 1 | 0 | 0 | 0 | 0 | 1 |
Table 15: Epidemiological survey of AIDS by age group in the city of São Bento Abade, 2014.
Finally, when carrying out the epidemiological analysis in each state of Brazil, the predominance of São Paulo, Rio de Janeiro, Rio Grande do Sul and Minas Gerais was observed. The discrepancy in the number of cases occurring in these regions is notable. In short, the most important thing in this observation was to verify that with a small study, that is, carried out in a micro-region with only 16 cities, it was possible to characterize what happens in an entire country, the growing number of cases mainly among men [18].
Conclusion
The epidemiological analysis of HIV/AIDS in the 16 cities of the micro-region of Varginha, from 2010 to 2020, followed its evolution, prevalence, and incidence, where it was possible to observe that it had a higher prevalence in men and greater detection in the age group from 30 to 39 years in the general population, in which the city that presented the most cases was Varginha, mainly because it has the largest number of inhabitants in the region and the city that had the lowest number of cases was in Coqueiral.
The study presented difficulties given the scarcity and inconsistency of data in the available epidemiological portals, which suggests the need to train professionals on the importance of obtaining the greatest number of reliable information from patients, in addition to notifying these cases in the information systems, so that studies like these are not harmed, since these data can be important sources of information for planning public policies to face HIV/AIDS.
Finally, further studies and greater communications between professionals and these databases are suggested, for better knowledge and decision-making, in addition to reducing the bureaucracy of the distribution of this data so that the general population can know that HIV/AIDS is still a problem. an important pathology present nowadays, and that governmental bodies can contribute to effective prevention and control measures of the disease.
References
-
UNAIDS (2017) Do you know what is HIV and what is AIDS?
-
de Moura JP, de Faria MR (2017) Characterization and epidemiological profile of people living with HIV/AIDS. J Nurs UFPE 11(12): 5214-5220.
-
Ministry of Health (2016) HIV e aids.
-
Brito AM, Castilho EA, Szwarcwald CL (2001) AIDS and HIV infection in Brazil: a multifaceted epidemic. Rev Soc Bras Med Trop 34(2): 207-217.
-
Sónia LM, Pereira JA (2012) HIV infection-importance of early stages and early diagnosis. Acta Farm Port 1(2).
-
de Sousa Dantas M, Maria da Silva Abrão F, Geraldo da Costa SF, Cristina de Oliveira D (2015) HIV/AIDS: meanings given by male health professionals. Esc Anna Nery 19(2): 323-330.
-
Ministry of Health (2020) HIV/AIDS Epidemiological Bulletin 2020.
-
DCCI (2021) Basic HIV/AIDS Indicators and Data in Brazilian Cities.
-
Tabnet (2020) AIDS cases identified in Brazil.
-
Tabnet (2021) Confirmed adult AIDS cases by place of notification, Minas Gerais.
-
Chaves de CS, Regina Ferreira da ML, Cissa A, Regina Gontijo GC, Cabreira Panitz CGE, et al. (2013) Internalization of HIV/AIDS in Brazil: An epidemiological study. Revista Brasileira de Ciências da Saúde 11(35): 25-30.
-
Ministry of Health (2020) AIDS cases decrease in Brazil.
-
Telma Alves M, Regina Franco Sansigolo KL, Carl K, Maria Salani MR (2014) Epidemiological Scenario of HIV Infection and AIDS in the World. Rev Fisioter S Fun 3(1): 4-7.
-
Fettig J, Swaminathan M, Murrill CS, Kaplan JE (2014) Global Epidemiology of HIV. Infect Dis Clin North Am 28(3): 323-337.
-
Rique J, da Silva MD (2011) Study of underreporting of AIDS cases in Alagoas (Brazil), 1999-2005. Cien Saude Colet 16(2): 599-603.
-
Gonçalves VF, Sansigolo Kerr LRF, Salani mota RM, Araújo mota JM (2008) Estimation of underreporting of AIDS cases in a Brazilian Northeast metropolis. Rev Bras Epidemiol 11(3): 356-364.
-
Ministry of Health (2020) 135,000 Brazilians live with HIV and do not know.
-
IBGE (2021) Cities and States.
- Epidemiological and Clinical Aspects of Intestinal Parasitoses Among Students in the City of Bocaranga, Central African Republic
- Artificial Intelligence Empowers Global Infectious Disease Prevention and Control: Opportunities and Challenges
- Factors that Affect the Incidence of Babesia and Blood Donor Testing in Select States: A Regression Analysis
- Neuro-TB: The Battle between Tuberculosis and the Nervous System
- The Biological and Health Implications of Cat Fleas (Ctenocephalides felis): Assessing Zoonotic Risks and Hygiene Strategies
- Biostatistical Analysis of Medicinal Plants for Treating Schizophrenia