Production of Açaí (Euterpe oleracea Mart.) under Different Agroforestry System Management Intensities in Amazonian Floodplain (Varzea) Forests
The Amazon region encompasses a wide range of vegetation formations due to variations in its conditions, from the Andean foothills to the mouth of the Amazon River. Among these are floodplain forests along the vast river network, which, despite their extent, remain poorly studied. Amazonian floodplain (várzea) forests sustain high biomass and socioecological value, yet their ecological functioning and response to management remain unclear, particularly for native açaí (Euterpe oleracea Mart.), a key species in regional agroextractive economies. This study assessed whether management intensity through canopy openness affects production in açaí stands within a riverine community on Ilha das Cinzas, Pará, shaped by seasonal flooding and long-term traditional use. Four sites were selected with two areas under high management (HM) and two areas with low management (LM) intensities were surveyed. Structural and floristic contrasts were evident: high intensity areas exhibited greater canopy openness (HM = 24.62%; LM = 11.83%) and reduced species richness (HM = 19; LM = 32), indicating simplified forest structure. Fruit yield mirrored clump architecture, with HM averaging 4 kg and 3 kg in LM per raceme, and fruit density per centimeter of rachis followed the same trend (HM = 41.7 g·cm-1; LM = 33,1 g·cm-1). Linear mixed-effects models revealed that this difference is linked to structural palm’s traits, rather than canopy openness. At the stem level, diameter of breast height (DBH) and rachis length positively influenced fruit weight, while total leaf area, stem height and radiance availability were not significant predictors. In floodplain açaí systems, productivity is governed primarily by intrinsic palm’s structural traits rather than selective thinning or canopy modification. Practices that maintain productive stems and ensure continuous recruitment are likely to sustain fruit yields. This approach fosters resilient agroextractive systems, stabilizes seasonal production, and safeguards the livelihoods of riverine communities that depend on these forests.
Goncalves V¹*, Righi CA¹, Mehta D¹, Tiruneh GA¹, Guedes MC², Pereira CR³, Polizel JL¹ and Batista JFL¹
¹Department of Forest Science, University of São Paulo, Brazil ²Brazilian Agricultural Research Corporation (EMBRAPA), Brazil ³Department of Agricultural and Environmental Engineering, Fluminense Federal University, Brazil safeguards the livelihoods of riverine communities that depend on these forests.
Abrreviations
PAE: Projeto Agroextrativista; DBH: Diameter at Breast Height; PCA: Principal Component Analysis; KDA: Kernel Density Estimation; NMDS: Non-metric Multidimensional Scaling; LOESS: Locally Estimated Scatterplot Smoothing; LMEM: Linear Mixed-Effects Models.
Introduction
The Amazon rainforest is often described as one of the most complex ecological systems on the planet, covering approximately 7.5 million km² and harboring nearly 25% of global biodiversity [1] it contains a remarkable variety of environments. This can be seen in the contrast between floodplain, known as várzea, and upland forests, which differ in soil properties, flooding regimes, and species adaptations [2]. Floodplain soils are more fertile than those of upland forests, yet frequent inundation limits gas exchange, leading to the accumulation of potentially toxic gases and constraining seed germination and plant growth [3]. This helps explain the lower species richness, diversity, and biomass of the floodplain when compared to upland forests, although they still maintain high overall biomass [4]. The reproductive seasonality of these forests, combined with tidal variation, further modulates aboveground biomass, with prolonged inundation favoring accumulation while intermediate flood durations often generate peak biomass stocks, highlighting the non-linear responses of trees to flooding [5].
These landscapes, however, are not shaped by ecological processes alone. Human occupation established in longstanding traditions of management and resource use has played an equally important role [1]. Despite their socioecological importance, government have promoted regional integration by encouraging demographic expansion and market driven agricultural and extractive production [6]. Floodplain forests continue to serve as a crucial subsistence base for riparian communities, who depend on small-scale agriculture, fishing, and plant extraction [7]. However, agriculture faces major constraints due to flooding in estuarine areas which restricts agricultural potential, the highly acidic, waterlogged soils of the floodplains are unsuitable for most conventional crops [8], which in turn confines a few floodplain endemic species to agroforestry practices and increases negative pressure on non-target species.
Among native managed resources in these ecosystems, açaí palm (Euterpe oleracea Mart., 1824) stands out as both a culturally significant species and a cornerstone of the Amazonian bioeconomy [9]. Historically used by Indigenous and riverine communities, açaí has gained prominence in national and international markets, with its reproductive season concentrated in the rainy months from June to August [10]. Over the past decades, increased production and price stability have fostered the emergence of a socioeconomic network encompassing production, distribution, processing, and marketing, creating a regional class of producers and workers transitioning from extractivists to agricultural roles [11].
Management practices vary between floodplain and upland environments. While floodplain production relies predominantly on low capital and smallholder approaches, the upland cultivation requires mechanized harvesting, irrigation, and higher investments [12]. Nevertheless, managed açaí floodplain areas have gained more economic value compared to other non-timber forest products in the floodplain forests, reinforcing the species’ potential within agroforestry bioeconomies [13]. Traditional practices generally allow sustainable production and help reduce socio-environmental risks. However, some common harvesting techniques, such as climbing with a rudimentary ankle strap (peconha), can make fruit collection more difficult and physically demanding [10].
Açaí agroforestry systems are typically managed through progressive thinning to enhance solar radiation and reduce competition, with practices of selective pruning to extend fruit production into the off season [12]. At the same time, the addition of intensification strategies such as increased clump density have led to reductions in forest diversity, with negative ecological effects particularly pronounced at densities exceeding 180–400 clumps per hectare, a process termed “açaízação” [14]. Current evidence in floodplain forests show that açaí based agroforestry substantially reduces total ecosystem carbon primarily due to declines in structural and functional diversity [15].
Floodplain landscapes are further shaped by dynamic sedimentary processes that continually alter riverbanks and margins. The removal of large native trees accelerates these changes by weakening riverbank stability, making floodplain ecosystems more vulnerable to erosion. Environmental and socio-economic data suggest that about half of the population in the Central Amazon is exposed to unstable riverscapes, with widespread erosion and sedimentation problems [16]. In response, communities have implemented restoration strategies such as enrichment planting, managing natural regeneration, and cultivating native species to recover lost diversity and restore ecological functions [17]. These efforts illustrate the ongoing trade-off between short term gains in productivity and the integrity of floodplain forests [18].
In conclusion, replacing native tree species with intensively managed açaí is believed to increase fruit yields [8, 10, 12, 19] but it often heightens ecological impacts [14-
16]. In contrast, more traditional, low intensity systems, mainly used for domestic consumption, maintain sustainable production, support local livelihoods, and help preserve ecological balance [20]. The remaining question is how far such systems can meet the income expectations of local families. Thus, given this complex socio-ecological context, this study aims to assess if the intensity of canopy opening as a strategy in management has a significant effect in the fruit production of native açaí agroforestry systems in a riverine agroextractivist community at the Amazonian floodplain (várzea) forests in Brazil. By relating production outcomes, forest structure, clump and raceme structure with management practices, we seek to determine whether greater canopy openness leads to measurable increases in açaí fruit yield, and whether production can be sustained under shaded conditions, providing evidence to guide management strategies.
Materials and Methods
Study Area
The study was conducted in the years 2024 and 2025 on Ilha das Cinzas, municipality of Gurupá, Pará, Eastern Amazon Brazil, within an alluvial dense ombrophylous forest [21], usually referred to as várzea or Amazonian floodplain forest, influenced by the seasonal flooding regime of the Amazon River (Figure 1). In 2024, the region experienced an average annual temperature of 35ºC, mean annual precipitation of 2,800 mm, and tidal variation reaching up to 3.2 m during the rainy season [22]. Soils are predominantly Gleysols, typical of periodically flooded environments, characterized by prolonged water saturation and reducing conditions [23]. These properties restrict the establishment of non-adapted species and shape forest successional patterns [3].
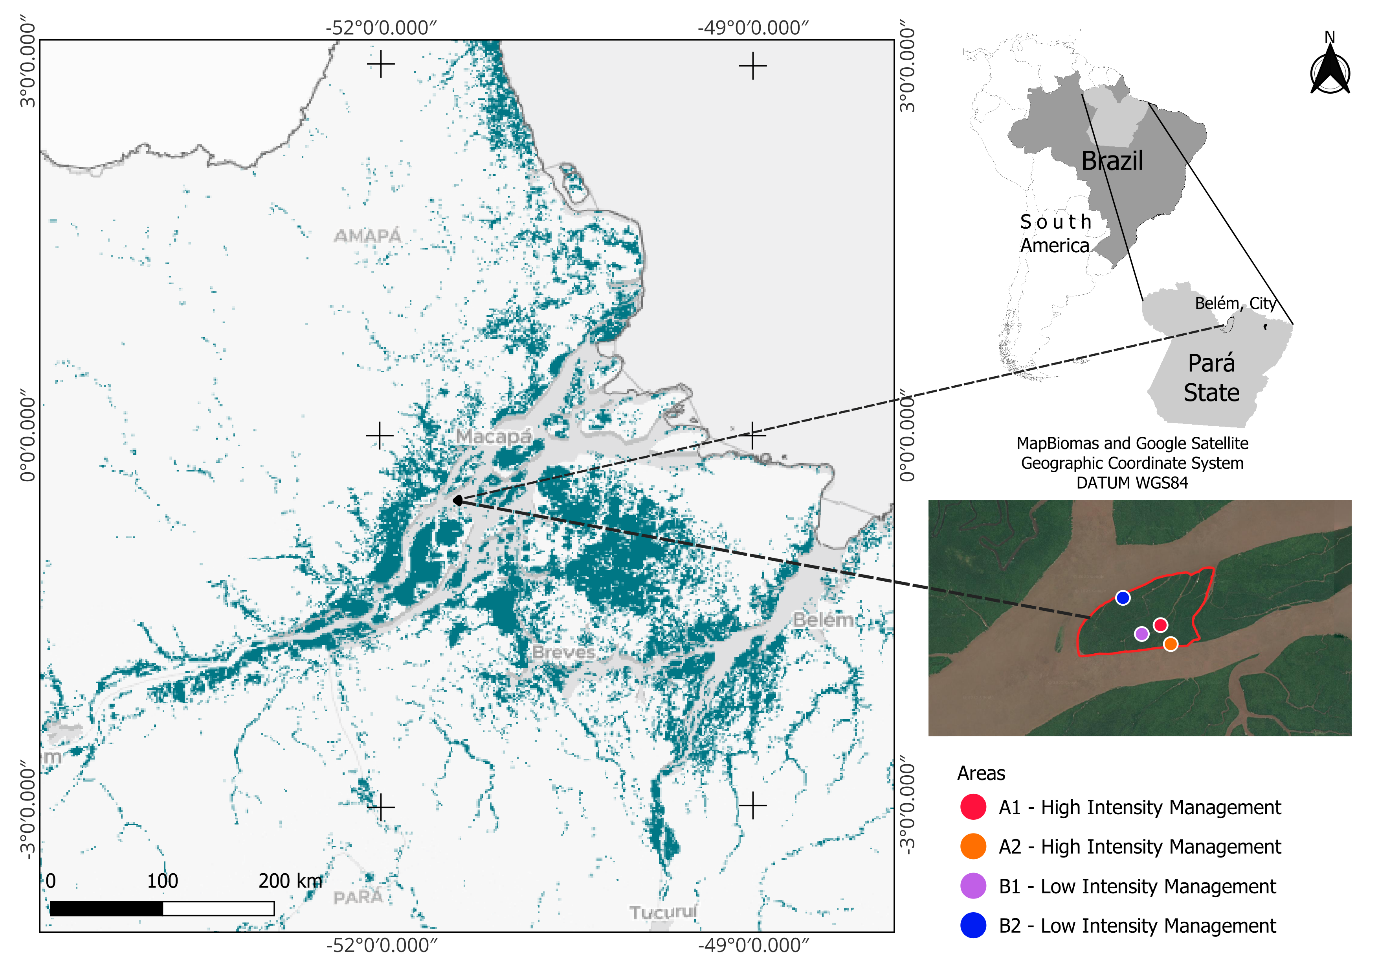
Figure 1: Location of the study area across four spatial scales. Brazil within South America, with the state of Pará. Pará state, indicating its capital, Belém; The Amazon River estuary within the Marajó Archipelago region, depicting the distribution of floodplain forests; and Ilha das Cinzas, with the study’s sampling areas marked in the legend.
The island covers approximately 3,000 ha and is home to nearly 80 families organized under an agroextractivist system. The area is classified as an Agroextractivist Settlement Program (PAE), granting residents the legal right to produce on the land [24]. Selected study sites have a history of açaí management with varying intensities of arboreal species removal and clump pruning. Four açaí stands were chosen, two under high intensity management (A1, A2) and two under low intensity management (B1, B2).
Experimental Design and Data Collection
Data collection targeted both clump structural attributes and broader environmental characteristics to evaluate how management intensity influences açaí production and forest structure. The study utilized data from forest inventory conducted in December 2024 and clump and raceme traits sampled in July 2025 during the açaí harvesting season.
The experimental design was structured to compare two management intensities (high and low) in agroforestry conditions, using two replicate for each intensity. Within every site, 20 productive açaí clumps (total n = 80) were selected with the assistance of an experienced local harvester (peconheiro), selecting only the clumps with mature fruits and easy access to reflect the traditional harvesting method. For each selected clump, measurements included diameter at breast height (DBH), stem height, number of stems, and number of leaves per stem. Harvested racemes were evaluated for total length, total weight, and fruit weight after threshing.
To characterize forest conditions, a forest inventory was conducted. Five circular plots of 18 m radius (~1,000 m²) were established in each site, including all individuals with DBH measured at 1.3 m height ≥ 5 cm. Species composition, tree community structure, and açaí clump density were recorded.
Canopy openness and incident irradiation were quantified using hemispherical photographs (196° lens) with the camera leveled over ground height, from which the 15 best exposed images per site were analyzed using Gap Light Analyzer 2.0 [25]. Leaf area estimates were obtained by photographing fifteen leaves per site on a white tarp with a 10 cm scale and analyzing the images in Image [26], with the support of the WEKA plugin [27] for supervised segmentation, classifying pixels into leaf or background for leaf area, length and width measurement.
**Statistical Analyses and Data Visualization**
All statistical analyses and data visualization were performed in R 4.3. Descriptive statistics and exploratory data screening followed standard procedures for ecological datasets [28]. Mean values of diameter at breast height (DBH), stem height, and number of stipes per clump were derived directly from the forest inventory, providing representative structural metrics for each sampled clump within the plots. Production variables, fresh weight of fruit bunches and total fruit yield, were calculated as the mean values obtained from productive clumps selected by each area (n=20).
Multivariate structure of vegetation plots and floristic composition were evaluated using the Principal Component Analysis (PCA), implemented following established approaches for dimensionality reduction in ecological analysis [29] with environmental and structural variables standardized prior to PCA. Canopy spatial patterns were characterized using Kernel Density Estimation (KDE) [30] which provides a continuous surface representation of canopy concentration and highlights potential hotspots of structural variation.
Fruit production was calculated per raceme, with the fruit ratio (Fr) expressed as the raceme weight (Rw) relative to the fruit weight (F). Fruit density in the rachis was calculated as the total fruit yield per raceme (Ry) divided by rachis length (RI) and standardized by the number of productive stems (N). Clump density (ha$^{-1}$) was obtained from plot counts of açaí clumps and extrapolated to one hectare using the mean density across plots to avoid inflating the estimates.
$$\text{Fr} = F/Rw \quad (1)$$
$$E = Ry/Rl^*N \quad (2)$$
Species richness was computed as the total number of tree species recorded per area in the forest inventory, while Shannon diversity ($H'$) was calculated using the standard formula (1), where ($pi$) represents the proportional abundance of each species. The dominant species was identified as the one with the highest relative abundance in each sampling area. A post hoc Hutcheson t-test (3) was applied to compare diversity as pairwise. Where, ($H1$ and ($H2$) are the Shannon indices of the two communities, $var(H1)$ and $var(H2)$ their associated variances calculated through (2), (S) the number of species, ($N$) the total individuals, and ($t$) the statistic used to assess whether the diversity values differ significantly [31].
$$H^2 = -p_i \ln \sum(p_i) \quad (1)$$
$$\text{var}(H) = \left( \sum_{i=1}^{s} p_i \ln(p_i) \right)^2 - \left( \sum_{i=1}^{s} p_i \ln(p_i) \right)^2 \Bigg/ N \quad (2)$$
$$t = \frac{\left( H_1 - H_2 \right)}{\sqrt{\left( \text{Var}(H_1) + \text{Var}(H_2) \right)}} \quad (3)$$
Spatial variation in clump density across sites was estimated using Kernel Density Estimation (KDE), a widely applied non-parametric approach for analyzing spatial point patterns in plant populations [30].
KDE surfaces were produced using Gaussian kernels and bandwidths selected via cross validation.
Multivariate ecological responses were interpreted using Non-metric Multidimensional Scaling (NMDS), an ordination approach widely applied for community level inference and for exploring structure function relationships in ecological datasets [32].
**Production Models**
The relationship between the number of leaves per stem and fruit mass, as well as the association between diameter at breast height (DBH) and production, was examined using LOESS (locally estimated scatterplot smoothing) curves, allowing flexible visualization of nonlinear patterns without imposing a strict functional form [33]. Confidence intervals were omitted because the subsequent statistical models presented in this study explicitly account for these sources of variability, and the LOESS curves are used solely to illustrate the general structure of the relationships.
To examine differences in forest structure and clump attributes between management regimes, we used linear mixed-effects models (LMEM) this models distinguish fixed effects from random effects, correctly accounting for dependence among observations and preventing inflated degrees of freedom, while also accommodating unbalanced designs and variance heterogeneity typical of field based ecological data [34]. Model fitting and inference were conducted with the lme4 package [35].
The first model (1) predicts individual fruit production (F) from structural traits of each stem, accounting for diameter at breast height (DBH), stem height (Sh), leaf area index (LAI), and rachis length (Rl). The second model (2) explains total clump production (Ft) using stem number (Sn), mean stem height (Sh), mean rachis length (Rl), mean DBH, and management intensity (M). The third and most parsimonious model (3) relates total clump fruit production (Ft) solely to rachis length (Rl) and management intensity (M). All models include an intercept (β₀) and an error term (ε), and Models 1–2 additionally account for area variability through a random effect (u).
$$ F = \beta 0 + \beta 1 (D B H) + \beta 2 (S h) + \beta 3 (L A I) + \beta 4 (R 1) + u + \varepsilon \tag {1} $$ $$ \begin{array}{l} F t = \beta 0 + \beta 1 (S n) + \beta 2 (S h) + \beta 3 \left(\operatorname {m e a n} (R 1)\right) + \beta 4 \left(\operatorname {m e a n} (D B H)\right) + \beta 5 (M) + u + \varepsilon (2) \\ F t = \beta 0 + \beta 1 (R I) + \beta 2 (M i) + \varepsilon (3) \\ \end{array} $$ All mixed-effects models incorporated key morphological predictors: stem DBH, stem height, raceme length, and number of leaves (or their clump means), where the (β) coefficients represent fixed effects, including an intercept (β₀), and (ε) denotes the residual error term. In both models, a random intercept for area (u) accounted for unobserved spatial heterogeneity among sampling locations.
Results
A total of 80 clumps were sampled across the four study areas (20/area), including two high intensity management sites (A1 and A2) and two low intensity management sites (B1 and B2). Comparative analyses revealed pronounced structural and ecological variation among areas that corresponded with marked contrasts in fruit production at both the clump and stand scales.
Vegetation and Clump Structure
Vegetation structure and the architecture of açaí clumps are fundamental determinants of both ecological function and resource production in floodplain systems [36]. Variations in canopy openness, site density and clump morphology mediate solar irradiance, microclimate and competitive dynamics which in turn shape vegetative growth and reproductive output [28]. Therefore, a description and comparison of these structural attributes across areas under contrasting management intensity (Table 1) provides essential context for interpreting any observed production differences and for assessing potential ecological costs of intensification in management.
| Area | Canopy Openness (%) | Density of Clumps (ha-1) | Mean DBH (cm) | Raceme per Fruit Ratio | Açaí Fruit (Kg) | Fruit Density (g/cm-1) | Raceme Length (cm) | Species Richness | Shannon Index | Dominant Species |
|---|---|---|---|---|---|---|---|---|---|---|
| A1 | 23.65 | 318 | 13.3 | 0.767 | 4.2 | 43.7 | 96 | 19 | 1.55 | Euterpe oleracea Virola surinamensis Calicophyllum spruceanum |
| A2 | 24.62 | 298 | 13.5 | 0.765 | 3.9 | 39.8 | 99.2 | 14 | 1.45 | Euterpe oleracea Virola surinamensis Licania heteromorpha |
| B1 | 11.83 | 128 | 13.3 | 0.750 | 3.1 | 31.5 | 98.3 | 26 | 2.35 | Virola surinamensis Mauritia flexuosa Euterpe oleracea |
| B2 | 13.7 | 294 | 13.7 | 0.719 | 3.2 | 34.7 | 94.8 | 32 | 2.4 | Euterpe oleracea Virola surinamensis Spondias mombin |
Table 1: Structural and compositional metrics across the four agroforestry studied areas. Key ecological and production attribute
Table 1: Structural and compositional metrics across the four agroforestry studied areas. Key ecological and production attributes for each sampled area, including canopy openness, clump density, mean stem diameter (DBH), ratio calculated by raceme weight per fruit weight, raceme fruit yield, fruit density, raceme length and indicators of species diversity (species richness, Shannon index, and dominant species). Where areas A1 and A2 is under high intensity management, and areas B1 and B2 are under low intensity management.
In our study, the areas identified as A1 and A2 (high management intensity) showed considerably higher mean canopy openness than the area B1 and B2 (low intensity management). Floristic indicators provide complementary evidence. Low intensity areas showed higher species richness and diversity despite having a high number of clumps per hectare, as seen in B2. Post hoc Hutcheson t tests showed that diversity in high intensity management areas (H ≈ 1.5) was significantly lower than in low intensity areas (H ≈ 2.35). No differences were found within management levels (A1 vs A2 and B1 vs B2). The dominant species also varied among areas, where Euterpe oleracea (açaí) ranked third in B1, while Virola surinamensis was present in all sampled areas.
The mean DBH and fruit ratio were almost the same for all areas, whereas clump density differs most in B1. Nevertheless, production means vary among the four sites. Patterns of fruit yield per clump were similar inside each management intensity with A1 and A2 showed the highest means for fruit weight, whereas B1 and B2 presented the lower values. Fruit density per centimeter of rachis showed a similar pattern, with the highest value in A1 (43.7 g·cm⁻¹), intermediate values in A2 and B2, and the lowest density in B1 (31.5 g·cm⁻¹). Rachis length was higher and very similar for A2 and B1.
The NMDS ordination based on Bray–Curtis dissimilarity produced a stress value of 0.16, which is generally considered acceptable for describing the underlying multivariate structure of the floristic dataset (Figure 2). The ordination configuration revealed a clear separation according to management regimes, where plots from the low intensity areas clustered relatively tightly, indicating high similarity, while plots from high intensity areas exhibited a more dispersed arrangement. Notably, plots from one high intensity site displayed partial overlap with a cluster of the other management type (A1 plot 2 trending toward the B1 cluster), suggesting areas of transitional composition between managed sites. Area A2, on the other hand, grouped more tightly, although it remained positioned on the negative side of NMDS1, marking a species composition that differed from the other areas.
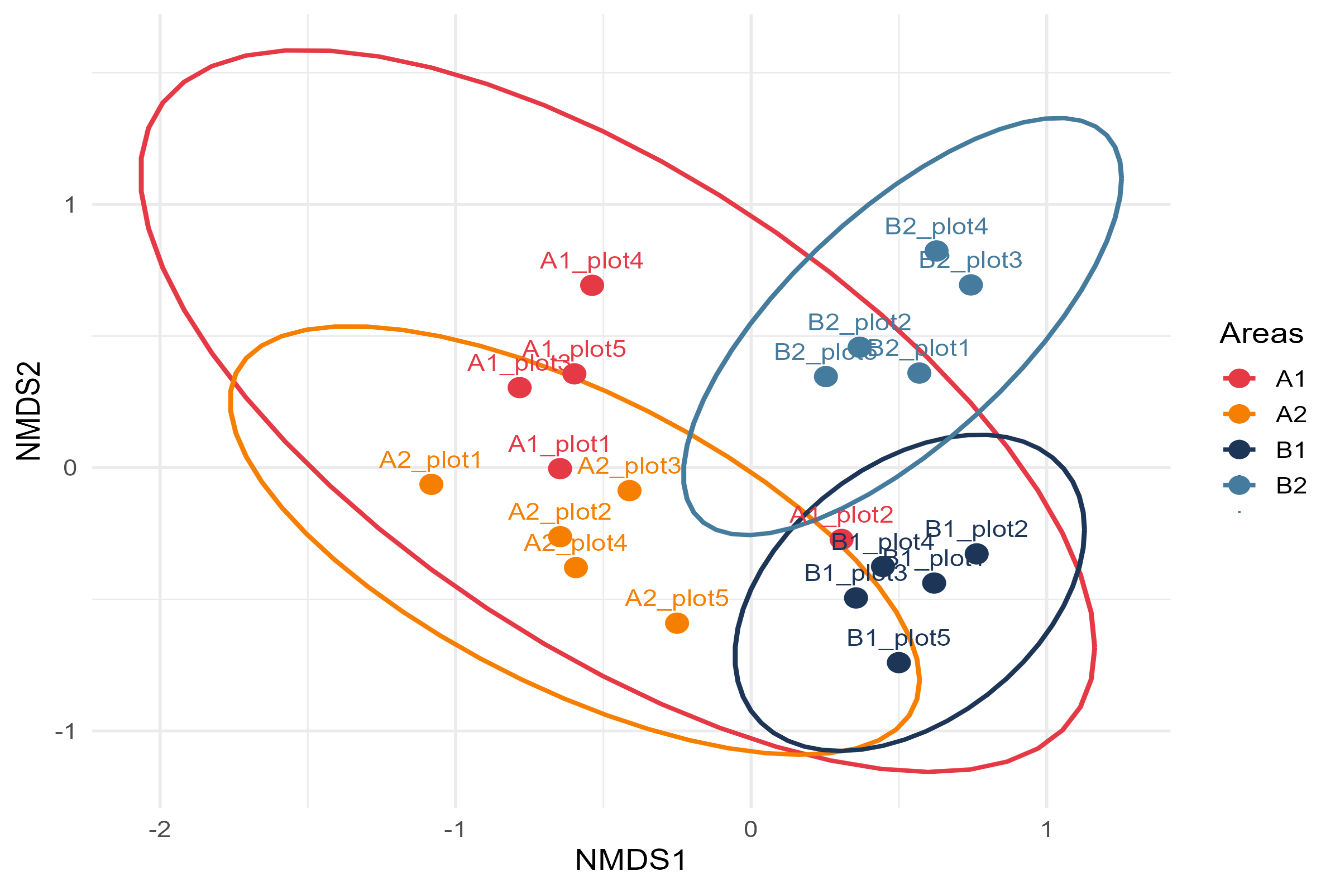
Figure 2: Floristic composition segregation by management intensity (NMDS ordination). Non-metric Multidimensional Scaling (NMDS) ordination of understory floristic composition across forest inventory plots (n=20, 5 per area), based on a Bray–Curtis dissimilarity matrix of species abundance data. Each point represents one plot, colored by its management intensity class. The stress value (k=2) is 0.1599. The clear spatial separation between groups, reinforced by the 95% confidence ellipses, indicates a significant separation among managements intensities.
Clump level measurements from the forest inventory showed clear structural differences linked to management, although the patterns were not entirely uniform across areas (Figure 3). In the high intensity sites, clumps tended to share a more similar architecture, most stem Diameter at Breast Height (DBH) values clustered around 10–12 cm, and clump heights were moderate (about 6–8 m). In A2, clumps were generally larger than A1, averaging about four stems per plot. The low intensity areas, in contrast, displayed much broader internal variation. Site B1 contained the tallest clumps (reaching roughly 10 m) and the plots with the highest stem numbers, in some cases up to six stems. Site B2 had mean clump heights similar to B1, but the clumps were usually smaller and less branched, with only two or three stems per plot. Both these patterns show that intensified management leads to more uniform stand structure and modest reductions in clump diversification noted by the similar size and aggregation of the dots.
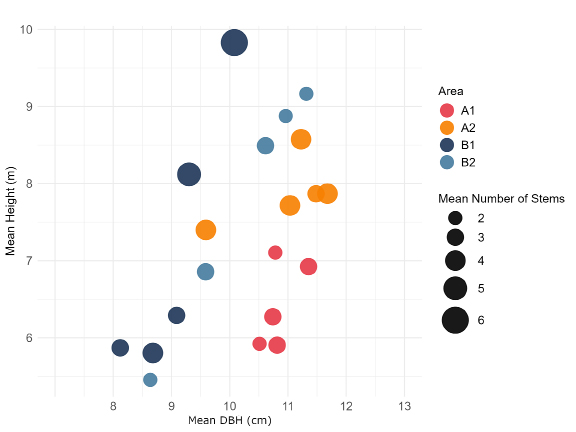
Figure 3: Average açaí clump morphology across management intensity areas. Mean values of key morphological traits for açaí clumps, aggregated by forest inventory plot (n=5 plots per management). Each point represents one plot’s average for number of stems per clump (circle size), mean stem height and mean stem diameter at breast height (DBH). The panel arrangement allows for comparison of structural variation in clump architecture across the sampled areas.
Canopy Structure and Solar Irradiation
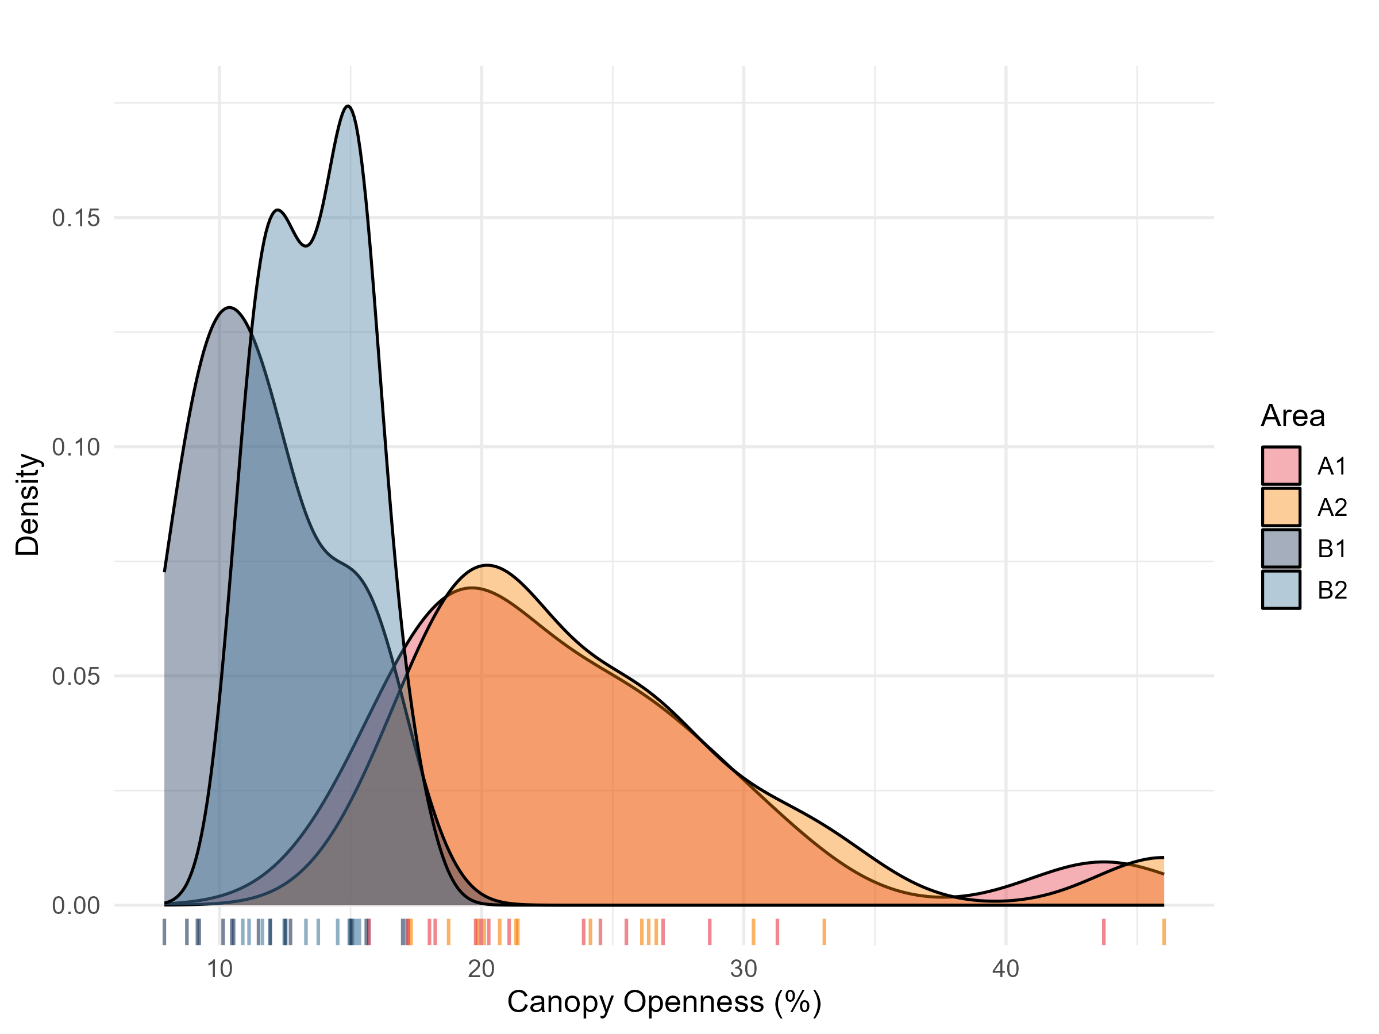
Canopy openness varied significantly across the four management areas (ANOVA: F₃,₅₆ = 22.07, p = 1.46 × 10⁻⁹). The kernel density curves (Figure 4) make this contrast evident. The high intensity sites (A1 and A2) displayed much broader distributions of openness values than the low intensity sites (B1 and B2).
Pairwise comparisons using Tukey tests indicated no significant differences between A1 and A2, whereas both were significantly more open than B1 and B2 (p < 0.001). At the same time, B1 and B2 were statistically indistinguishable. These results align with the raw measurements, with A1 and A2 forming the group with the highest and most overlapping openness values and B1 and B2 clustering at lower levels. The density and rug plots thus underscore a marked dichotomy between high and low intensity management areas, notwithstanding within group variability.
The PCA combining canopy openness and solar radiation availability related variables (Figure 5) showed a strong arrangement along the first principal component, which accounted for 94.4% of the total variance. Canopy openness and direct, diffuse, and total transmittance exhibited very strong positive loadings on Dim1 (0.96–0.99), whereas both leaf area index measures loaded negatively (≈ −0.96), reflecting the anticipated inverse relationship between canopy closure and understory irradiance.
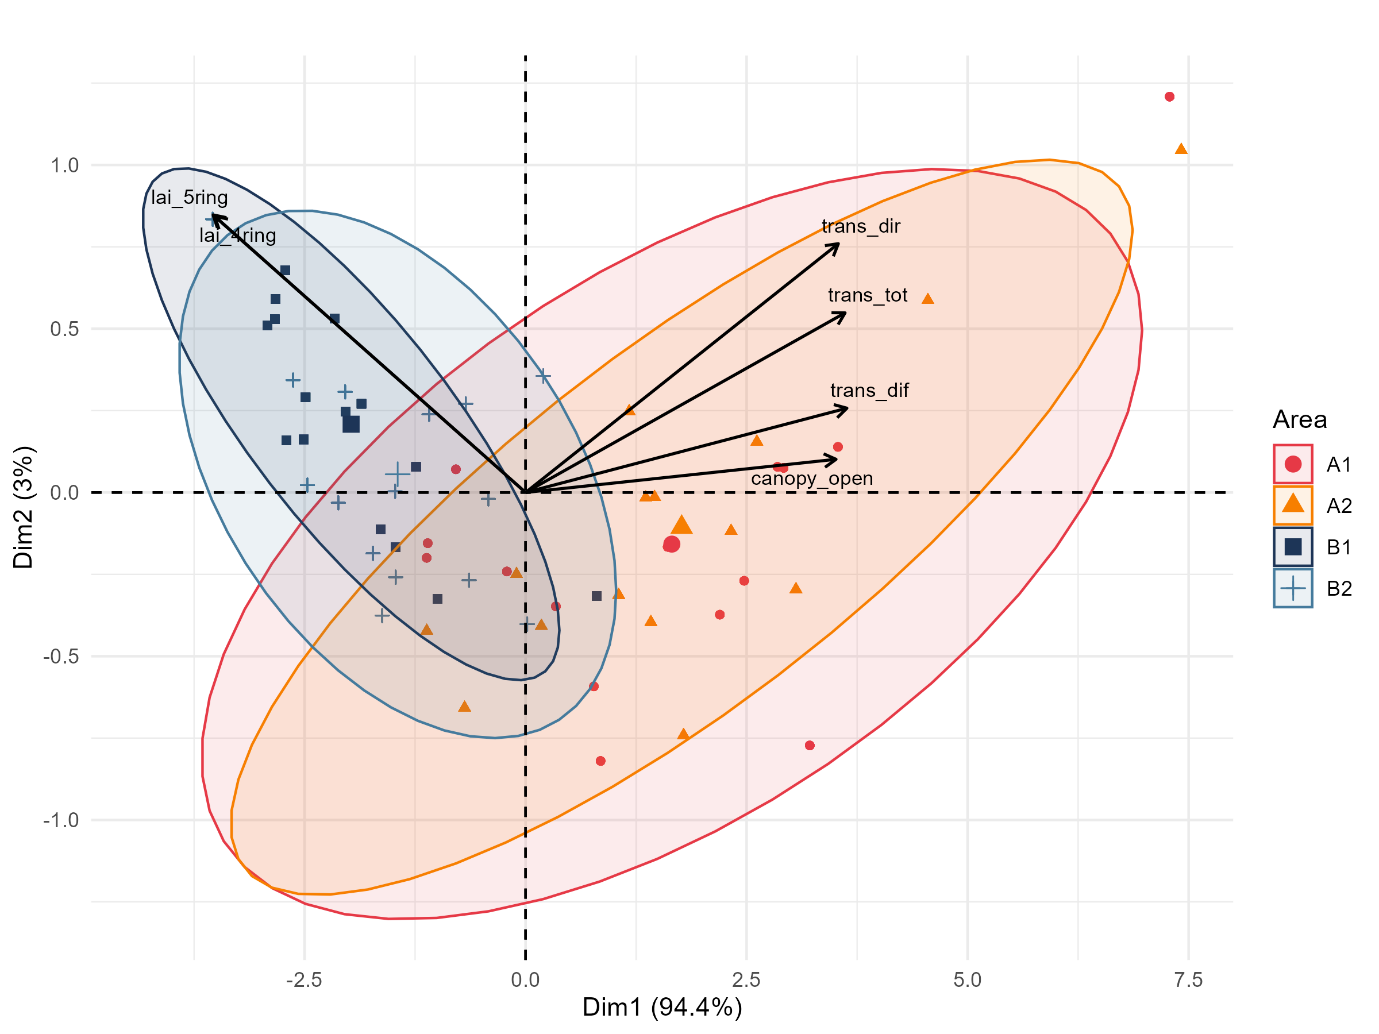
Figure 5: PCA of forest understored solar radiation environment across management intensities. Principal Component Analysis (PCA) biplot of canopy openness and related solar radiation variables. Data points represent individual sampling replicates, grouped by management intensity with 95% confidence ellipses. The plot displays the dispersion and separation between the two management systems in multivariate solar irradiance availability space. Canopy openness and solar radiance transmittance (total, direct, and diffuse) load toward the right side of the figure, whereas leaf area index loads in the opposite direction.
The ordination also distinguished plots by management intensity regarding the ellipses overlaps, where B1 and B2 show more similar irradiance environment than A1 and A2, both high management areas included one point each that extended beyond the upper edge of its ellipses, indicating unusually high solar radiation availability.
These indicate that management intensity produces a clear separation in canopy and solar irradiance environments, while intensified sites converge toward more open structural conditions that permit increased understory irradiance, the lower intensified sites retain shaded, closed canopy conditions.
Fruit Production
The Locally Estimated Scatterplot Smoothing (LOESS) curves revealed consistent positive associations between morphological attributes and fruit yield (Figure 6). A similar curve shape was observed for both management intensities, with fruit production increasing as leaf area index (LAI) rose (Figure 6a). High intensity areas displayed smoother curves that reached a production peak at approximately 21 m² of LAI. Low intensity areas exhibited a steeper increase toward this peak, suggesting a stronger marginal gain in fruit weight per unit of leaf area. Following the pattern, both management regimes showed a dip in production, although low intensity areas displayed a minor tendency to increase again around ~23 m², whereas high intensity stands appeared to resume a more gradual upward trend.
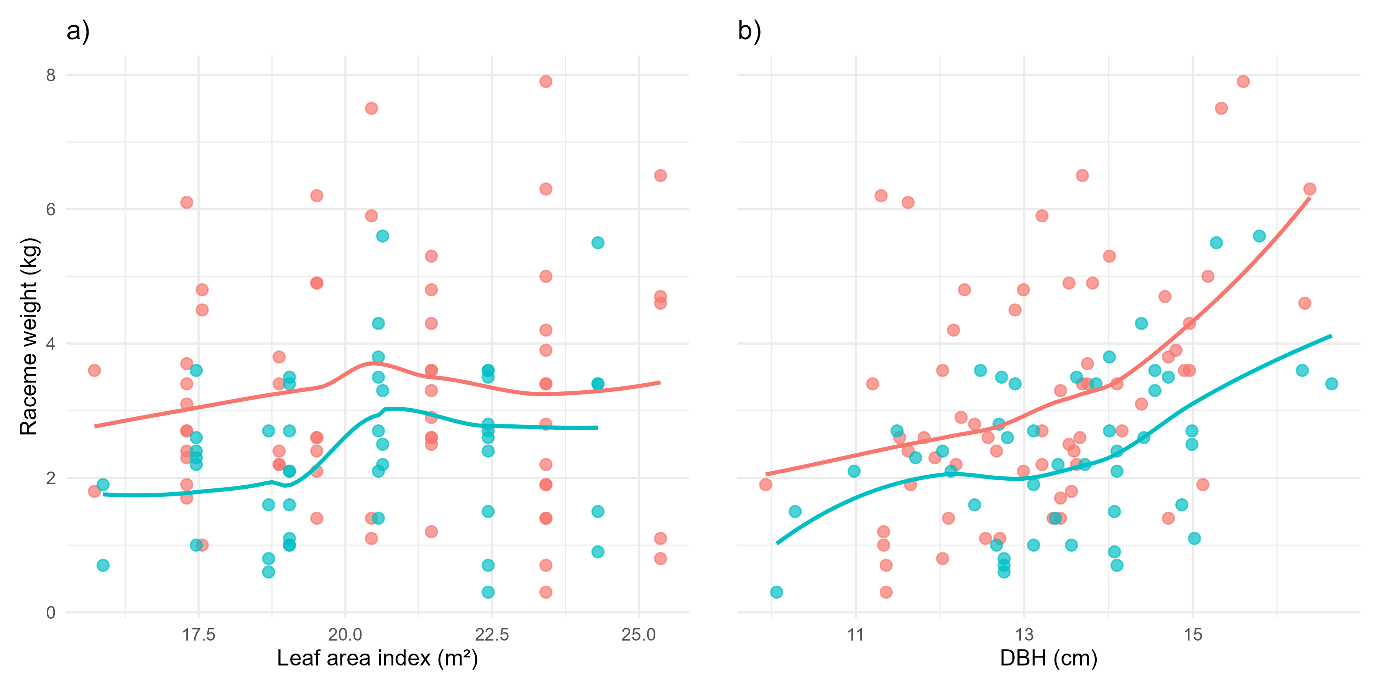
Figure 6: Locally Estimated Scatterplot Smoothing (LOESS) for the relationships between morphological attributes and fruit yield under different management intensities. The panels show non-parametric LOESS curves depicting the relationship between (a) leaf area index (LAI) and fruit weight and (b) stem diameter at breast height (DBH) and fruit weight. Curves were fitted separately for high and low intensity management regimes and the points represent individual racemes.
Both management regimes exhibited increasing fruit production as stem diameter increased (Figure 6b). High intensity areas consistently displayed higher raceme weight, particularly for stems with DBH > 15 cm, where the divergence between management classes became more evident. Both curves showed a shallow depression around 13–14 cm DBH, though the dip was more pronounced under low intensity management. Despite this local trough, the trend remained strongly positive, indicating that larger stem diameters are generally associated with increased fruit production.
Production varied considerably across the different management intensities (Figure 7). This is observed in the linear mixed-effects models, which showed that structural traits, rather than management intensity itself, were the main variables explaining fruit production.
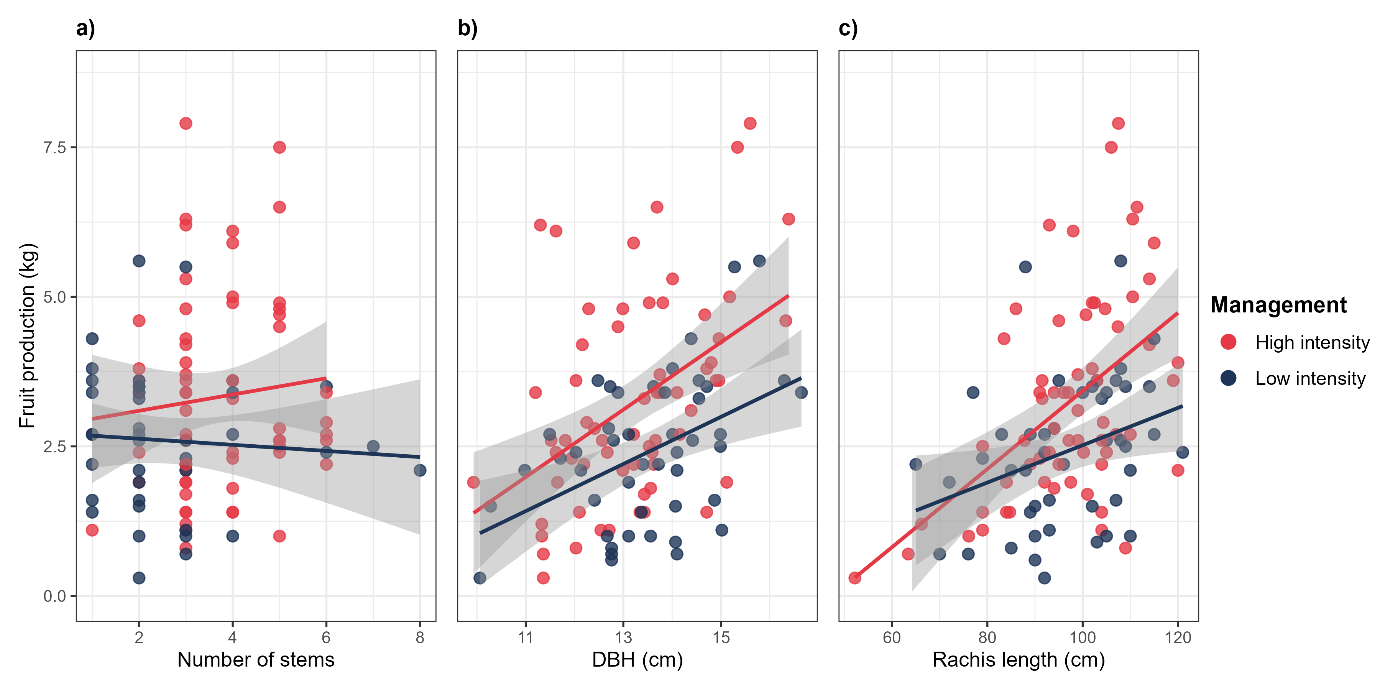
Figure 7: Drivers of açaí fruit yield: modelling key structural predictors. Relationships between fruit production and structural traits of açaí clumps across four management areas (n = 80 clumps, 20 per area). Panels show predictions from three separate linear mixed-effects models (with 95% confidence bands), each evaluating a single fixed effect while controlling for random variation among areas: (a) stem number, (b) mean DBH, and (c) mean rachis length. All responses are plotted on a common yield axis (fruit production in kilograms) to allow direct comparison of effect sizes.
At the stem level (model 1) two morphological variables exhibited consistent positive relationships with fruit production, DBH and rachis length. Both had significant positive effects, with rachis length showing the strongest association (β = 0.055 ± 0.011, p < 0.001), followed by DBH (β = 0.25 ± 0.09, p = 0.005).
Whereas leaf area did not show any meaningful relationship with production (p = 0.52). Partial predictions mirrored the observed data, with açaí production rising steadily as these traits increased.
At the clump scale (model 2), fruit production was driven largely by variation in clump architecture. The number of stems per clump was the only significant predictor (β = 0.45 ± 0.14, p = 0.002), clumps with more stems produced greater yields. The rachis length (model 3) again showed a significant positive effect (β = 0.0495 ± 0.0102, p < 0.001), with longer rachises associated with greater fruit weight per clump. DBH also contributed positively (β = 0.223 ± 0.085, p = 0.010). Variation among areas was minimal, suggesting that site conditions had far less influence than stem morphology.
Once structural covariates were introduced into the models, the percentage of canopy openness itself ceased to be a significant predictor, indicating that differences in clump architecture and stem development mediate the influence of management on production.
Discussion
The increasing commercial demand for açaí, driven by its expansion beyond estuarine zones and the consolidation of rural urban market networks [11], has often sustained the assumption that more intensive management should naturally lead to higher yields. Yet our results reveal a more nuanced picture. Fruit production per clump varied substantially among areas: A1 and A2 averaged over 3 kg while B1 and B2 stayed under 2.5 kg, indicating that differences in production exist between management intensities. What stands out, however, is that clump structural traits, particularly stem traits and clump morphology, were the primary drivers of yield by enabling the presence of infructescence [37], rather than management intensity through canopy openness per se.
The areas exhibited substantial structural contrasts, particularly between A1 and B1, with the largest discrepancy observed in clump density which reflects a greater capacity for production (A1 = 318 and B1 = 128). This pattern is consistent with the dominance rankings of species, in B1, açaí appears only as the third most dominant species, suggesting the absence of practices such as enrichment planting. This structural heterogeneity across sites, when grouped into only two management intensities based on canopy openness, improves the generalization of the models and indicates that production is influenced by additional parameters beyond those used for the initial classification.
Across models, the inference is consistent and suggests that fruit production in açaí agroforestry systems is principally governed by structural traits, with stem level yields increase with greater DBH and longer rachises. When examining the average clump structure (Figure 3), A1 and A2 display tightly clustered diameter and number of stems distributions, dominated by larger sampled stems. In contrast, B1 and B2 exhibit a much broader range of stem quantities and diameters. As indicated by the LOESS curve (Figure 6), stems with greater DBH produce heavier racemes. The higher proportion of small diameter stems in the low management areas likely constrains overall fruit production, a pattern consistent with the model outputs, and further supported by the distribution of observed raceme weights.
These structural contrasts observed between management intensities align with the intensification pathway described by Barbosa EdS, et al. [20], marked by the removal of non-target vegetation and the predominance of frequently thinned clumps. However, clump densities under high intensity management remained comparable to those reported for enriched upland agroforests [19]. This suggests that similar densities can be sustained in floodplain agroforestry systems without triggering a shift toward monocropping, thereby maintaining higher overall system diversity and avoiding açaízação. These patterns of desired density in the upland reinforce the evidence that fruit yield in açaí is strongly driven by clump density, which enhances raceme production, rather than by broader canopy modifications [37].
The functional resilience of native açaí stands to the flood pulse, supported by high moisture availability and strong regenerative capacity [4, 38], likely contributes to this production stability where the clumps are well managed. Similar dynamics have been noted in irrigated systems, where water availability becomes a decisive factor in reproductive performance [39]. In floodplain systems, however, water availability is generally not a limiting factor, shifting the role of production control toward light conditions and clump structure. In this study, kernel density estimates (Figure 4) indicate that low management areas exhibit a more homogeneous irradiance environment. This structural uniformity is reflected in the prediction models by a narrower confidence interval around the fitted relationship (Figure 7), indicating lower uncertainty in fruit production responses. In contrast, high management intensity areas show greater variability in irradiance conditions, resulting in more dispersed production patterns.
These results further indicate that management intensification alters the surrounding forest matrix more strongly than the physiological performance of açaí clumps. Although clear differences in fruit density were observed among areas (Table 1), the similar intervals within each area between management intensities suggest that factors beyond canopy manipulation may be influencing fruit production. Flood pulses maintain consistently high soil moisture and nutrient availability [40], conditions under which E. oleracea can sustain carbon assimilation even under relatively closed canopies. Shade tolerant palms have been shown to maintain stable photosynthetic rates across moderate irradiance gradients, suggesting that the species solar irradiance response curve could saturates at relatively low irradiance [41].
In floodplain forests, reductions in understory diversity can compromise ecological functions such as pollination networks, soil bioturbation, and microclimate buffering [42]. While these processes may not immediately constrain fruit production within a single harvest, they could influence long term site resilience, particularly on river islands where forest structure is more sensitive to hydrology and sedimentation [43]. The presence of multiple reproductive stems and continuous recruitment observed at some of the sampled areas in Ilha das Cinzas further supports stable yields, aligning with floodplain dynamics reported by previous studies [44]. Although high intensity plots showed floristic simplification similar to what has been observed in intensely managed estuarine islands [45], this did not translate into significant gains in clump production. At the level of individual stems, fruit production correlated most strongly with DBH and rachis length, while leaf area and stem height played only minor roles.
The heterogeneity in clump structure and density among areas, despite similar canopy openness within each management intensity, highlights a key strength of this study and suggests that morphological attributes exert a stronger influence on production than irradiance alone. Conversely, under more homogeneous clump morphology and density, light availability might impose a more direct constraint on fruit production; further research is thus needed to elucidate the influence of light under more controlled conditions.
Management models borrowed from upland agroforestry often fail to translate effectively to floodplain environments. While upland açaí may respond positively to increased irradiance [46], floodplain forests operate under a hydrological regime that naturally enhances fertility for endemic species and minimizes water limitation [41]. Thus, intensification centered on vegetation removal may impose ecological costs, loss of associated flora [15], reduced habitat heterogeneity [14], increased erosion risk [16], without the compensatory production gains reported in upland landscapes [37]. Policies should prioritize mixed age structures, natural regeneration, and understory heterogeneity, reflecting traditional agroextractive knowledge [18].
In sum, our study shows that under Amazonian floodplain conditions, intensification strategies based solely on tree removal for increasing the irradiance availability is not the main lead to significant gains in production and may impose ecological costs. Moderate management that preserves age structure, favors stem recruitment, and avoids excessive clearing aligns better with ecological resilience and long-term sustainability [11, 13, 20]. Since fruit production is primarily shaped by intrinsic reproductive traits rather than canopy structure, management and policy should remain grounded in the ecological realities of floodplain systems rather than upland intensification models that lead to açaização.
Conclusions
Our results indicate that açaí fruit production in floodplain agroforestry systems is governed primarily by clump architecture and stem morphological traits rather than by canopy openness. Although high intensity management areas exhibited significantly greater canopy openness and higher mean fruit yields, these gains occurred alongside reduced floristic diversity compared to low intensity areas, highlighting a trade-off between production and ecosystem complexity. Notably, canopy openness was relatively homogeneous among low intensity management areas, and despite differences in clump structure, fruit production remained highly similar between these sites, aligning with the narrower confidence intervals observed in the model predictions.
At the stem and clump scales, fruit production responded consistently to morphological attributes. DBH and rachis length presented a strong and positive relationship to fruit production, while the number of productive stems per clump emerged as the dominant structural predictor at the clump scale indicating the possibility to have more productive steams on each clump – saturation point to be determined. In contrast, leaf area and canopy openness lost explanatory power once structural covariates were incorporated, indicating that management effects on fruit production are mediated through changes in clump architecture rather than direct irradiance enhancement.
Long-term and more detailed monitoring of açaí fruit production is essential to accurately assess yields at the area scale. The results suggest that Euterpe oleracea can tolerate shading without declines in fruit production, if stems have similar DBH, highlighting the species’ resilience under varying canopy conditions. Therefore, there is a great opportunity to increase the income of riverside communities through the incorporation of trees into a better-designed system. That capacity to stand shaded environment without proportional reduction could be assessed with more detailed investigation. By showing the central role of clump structure, this study supports management strategies that enhance production while preserving structural diversity and ecological resilience in floodplain açaí agroforestry systems. Although it is suggested that moderate management approaches could foster resilient, diversified extractive systems, there is a lack of empirical data proving their capacity to buffer seasonal variability and sustain multiple non-timber forest products. Further studies are needed to validate this hypothesis and determine whether such systems can, in fact, support the long-term socioeconomic stability of the riverine communities that depend on these forests.
Author Contributions
Conceptualization, VG and CAR; methodology, VG and CAR; software, VG.; validation, VG., CAR., DM, and GAT, MCG and CRP; formal analysis, VG, CAR and JLFB; funding resources, CAR, MCG and CRP; data curation, VG and JLFB; writing - original draft preparation, VG; writing - review and editing, VG., CAR, DM, GAT, CRP, JLFB and MCG; visualization, VG; supervision, CAR; project administration, CAR, MCG and CRP; funding acquisition, CAR. All authors have read and agreed to the published version of the manuscript.
Funding
This research was funded by FAPESP (grant no. 2022/10456-0).
Data Availability Statement
Is provided with the manuscript submission.
Acknowledgments
All authors are grateful to FAPESP for all the resources and financial support (grant no. 2022/10456-0). V.G. is deeply grateful for the scholarship from CAPES (grant no. 88882.180106/2007-01). Special thanks are extended to all those who assisted in field data collection, particularly Antonio Barbosa (Tôni), Francisco Malheiros from ATAIC (Association of Agroextractivists Workers of Ilha das Cinzas) and all his family for the kind support and delicious food during our stay in the field. Additional thanks to Caio Henrique Ferreira Lima and Ediglei da Silva Santos from Embrapa (Brazilian Agricultural Research Corporation) for the unconditional help on Macapá supply chanel and tireless and decisive help in establishing field plots.
Conflicts of Interest
The authors declare no conflict of interest.
References
-
Silva-Souza KJP, Souza AF (2020) Woody plant subregions of the Amazon forest. Journal of Ecology 108(6): 2321- 2335.
-
Montagnini F, Muñiz-Miret N (1999) Vegetation and soils of tidal floodplains of the Amazon estuary: a comparison of várzea and terra firme forests in Pará, Brazil. Journal of Tropical Forest Science 11(2): 420-457.
-
Wittman F, Junk WJ, Piedade MTF (2004) The várzea forests in Amazonia: flooding and the highly dynamic geomorphology interact with natural forest succession. Forest Ecology and Management 196(2-3): 199-212.
-
Almeira S, Amaral DD, Silva ASL (2004) Floristic analysis and floodplain structure in the Amazon estuary. Acta Amaz 34: 4.
-
Lucas CM, Shongart J, Sheik P, Wittman F, Piedade MTF, et al. (2014) Effects of land-use and hydroperiod on aboveground biomass and productivity of secondary Amazonian floodplain forests. Forest Ecology and Management 319: 116-127.
-
Fernandes F, Fernandes GW, Fearnside PM (2023) Viewpoint: Sovereignty and reversing Brazil’s history of Amazon destruction. Land Use Policy 133: 106868.
-
Silva RDJ, Garavello MEPE, Nardoto GB, Mazzi EA, Martinelli LA (2016) Factors influencing the food transition in riverine communities in the Brazilian Amazon. Environment, Development and Sustainability 19: 1087-1102.
-
Muniz-Miret N, Ramos V, Hiraoka M, Mantagnini F, Mendelsohn RO (1996) The economic value of managing the açaí palm (Euterp oleraceaI Mart.) in the floodplains of the amazon estuary, Pará, Brazil. Forest Ecology and Management 87(1-3): 163-173.
-
Oliveira MdSPd, Schwartz G (2018) Açaí – Euterpe oleracea. Exotic Fruits pp: 1-5.
-
Silva WRdS, Vieira TA, Oliveira-Junior JMBd, Magalhães KRdS, Lisboa LSS, et al. (2025) Traditional açaí extractivism and technological innovation in Murumuru quilombo, Brazilian Amazon. World 6(3): 117.
-
Brondízio E, Safar CAM, Siqueira AD (2002) The urban market of açaí fruit (Euterpe oleracea Mart.) and rural land use change: Ethnographic insights into the role of price and land tenure constraining agricultural choices in the Amazon estuary. Urban Ecossystems 6: 67-97.
-
Homma AKO, Nogueira OL, Menezes JEA, Carvalho JD, Nicoli CML, et al. (2006) Açaí: Novos desafios e tendências. Ciência & Desenvolvimento 1: 7-23.
-
Araújo ECG, Silva TC, Neto EmdC, Favarin JAS, Gomes JKdS, et al. (2024) Bioeconomy in the Amazon: Lessons and gaps from thirty years of non-timber forests products research. Journal of Environmental Management 370: 122420.
-
Freitas MAB, Vieira ICG, Albernaz ALKM, Magalhães JLL, Lees, AC (2015) Floristic impoverishment of Amazonian floodplain forests managed for açaí fruit production. Forest Ecology and Management 351: 20-27.
-
Mehta D, Righi CA, Guedes MC, Gonçalves V, Batista JLF (2026) Ecosystem functioning across natural and managed Floodplain Forests of the Amazon Estuary: Implications for sustainable management. Forest Ecology and Management 602: 123382.
-
Zumak A, Fassoni-Andrade AC, Pereira HC, Papa F, Silva PdS, et al. (2025) Riverine communities in the Central Amazon are largely subject to erosion and sedimentation risk. Communications Earth & Environment 6: 92.
-
Almeida HP, Homma AKO, Menezes AJEAd, Filgueiras GC, Neto JTdF (2021) Produção e autoconsumo de açaí pelos ribeirinhos do Município de Igarapé-Miri, Para. Research, Society and Development 10: 9.
-
Carvalho RdC, Alves LdFN, Carneiro RdV (2021) Forest restoration in the floodplains of Amazon estuary subjected to intensive açaí management. Revista Ambiente e Sociedade 24: 1-22.
-
Azevedo JR, Kato OR (2007) Sistemas de manejo de açaizais nativos praticado por ribeirinhos das Ilhas de Paquetá e Ilha Grande. Embrapa-Belém Pará, Brazil.
-
Barbosa EdS, Lima HVd, Elias LMSdL, Araújo JCO, Santos AVFd (2022) Management of açaí areas in the Sustainability-oriented supply chain in the municipality of Abaetuba-Pará. Journal of Agricultural Sciences 14: 3.
-
Brazil R (1982) Ministério das Minas e Energia, Departamento Nacional de Produção Mineral (DNPM). Projeto Radambrasil: 28.
-
Instituto Nacional de Metereologia (INMET) Meteorological data from the station [Macapá-AP 82098], Brazil.
-
Brazil (2018) Brazilian soil classification system. Brasilia-DF: EMBRAPA.
-
Brazil (2006) Instituto Nacional de Colonização e Reforma Argrária (INCRA). Acordo de cooperação técnica N.1552, INCRA, Gurupá.
-
Frazer GW, Trofymow JA, Lertzman KP (1997) A method for estimating canopy openness, effective leaf area index, and photosynthetically active photon flux density using hemispherical photography and computerized image analysis techniques. Pacific Forestry Centre, Canadian Forest Service 1: 73.
-
Scheneider CA, Rasband WS, Eliceiri KW (2012) Image to Image J: 25 years of image analysis. Nature Methods 9: 671.
-
Hall M, Frank E, Holmes G, Pfahringer B, Reutemann, P, et al. (2009) The WEKA data mining software: an update. ACM SIGKDD explorations newsletter 11: 10.
-
Montgomery RA, Chazdon RL (2001) Forest structure, canopy architecture, and light transmittance in tropical wet forests. Ecology 82: 2707.
-
Broa R, Smildeab AK (2014) Principal component analysis. Analytical Methods 6: 2812.
-
Silverman BW (1978) Density Estimations for Statistics and Data Analisys. The annals of Statistics 6: 177.
-
Hutcheson K (1970) A test for comparing diversities based on Shannon formula. Journal of Theoretical Biology 29: 151.
-
Anderson MJ, Ellingsen KE, McArdle BH (2006) Multivarieted dispersion as a measure of beta diversity. Ecology Letters 9: 683.
-
Cleveland WS, Devlin SJ (1988 ) Locally weighted regression: an approach to regression analysis by local fitting. Journal of American Statistical Association 83: 596.
-
Harrison XA, Donaldson L, Correa-Cano ME, Evans J, Fisher DN, et al. (2018) A brief introduction to mixed effects modelling and multi model inference in ecology. PeerJ 6: e4794.
-
Douglas B (2015) Fitting linear mixed‐effects models using lme4. Journal of Statatistical Software 67: 1-48.
-
Wittmann F, Householder JE, Piedade MTF, Schöngart J, Demarchi LO, et al. (2022) A review of the ecological and biogeographic differences of Amazonian floodplain forests. Water 14: 3360.
-
Neto JTdF, Yokomizo GKI, Resende MDVd (2020) Productive capacity and genetic variation behavior in progenies from irrigated açai according to plant age. Agr@ambiente On-line 14.
-
Gama JRV, Souza Ald, Martins SV, Souza DR (2005) Comparison between floodplain and upland forests of the State of Pará. Rev Árvore 29: 607.
-
Viana LF, Homma AKO, Menezes AJEAd, Santos JCd, Neto JTF (2020) Viabilidade economica do cultivo de açaizeiro (Euterpe oleracea Mart.) irrigado no nordeste paraense. International Journal of Development Research 10: 39177.
-
Junk W, Piedade M, Schöngart J, Cohn-Haft M, Adeney J, et al. (2011) A classification of major naturally-occurring Amazonian lowland wetlands. Wetlands 31: 623.
-
Ma R, Zhang J, Cavaleri M, Sterck F, Strijk J, et al. (2015) Convergent evolution towards high net carbon gain efficiency contributes to the shade tolerance of palms (Arecaceae). PloS one 10: e0140384.
-
Lenk A, Richter R, Kretz L, Wirth C (2024) Effects of canopy gaps on microclimate, soil biological activity and their relationship in a European mixed floodplain forest. Science of The Total Environment 941: 173572.
-
Hawes J, Peres C (2017) Forest structure, fruit production and frugivore communities in terra firme and várzea forests of the Médio Juruá. Forest structure, function and dynamics in Western Amazonia pp: 85.
-
Santos J, Dantas A, Guedes M (2025) Effect of hydroclimatic seasonality on the phenological behavior of Euterpe oleracea in the Amazon estuary. lant Species Biology 40: 217.
-
Freitas MA, Magalhães JL, Carmona CP, Arroyo-Rodríguez V, Vieira IC, et al. (2021) Intensification of açaí palm management largely impoverishes tree assemblages in the Amazon estuarine forest. Biological Conservation 261: 109251.
-
Dapont E, Silva J, Alves C (2016) Initial development of açaí plants under shade gradation. Revista Brasileira de Fruticultura 38: e-022.
- Enhancement of Vegetative Growth and Fruit Yield in Cucumber (Cucumis sativus L.) via Spiritual Blessing (Biofield) Energy Intervention
- Coffee and the Production Region: What is the Secret to the Expression "Quality"?
- Experiential Agripreneurship Training in Sub-Saharan Africa: Integrating a Business Incubator into Postgraduate Livestock Education at the University of Buea
- Advances in Agricultural High-Quality Development
- Linking Compost Residue to ABAGE in Plants - a Short Note
- Building Living Structures – The Use of Space and Time for their Development