Seasonal Variation in Vitamin D levels in Saudi Patients with Type 2 Diabetes Mellitus in Western Saudi Arabia
Introduction: The impact of seasonal changes over serum vitamin D has been addressed in several previous studies. We conducted a cross sectional study to investigate the status of vitamin D seasonal variation in an ambulatory adult population of Jeddah, one of the western most regions of the Saudi Arabia. Method: A cross-sectional single centre study was conducted in 4053 patients with type 2 diabetes mellitus (T2DM). Patients with T2DM attended the Diabetes Centre at King Fahad Armed Forces Hospital, Jeddah, Saudi Arabia between January 2018 and December 2018 were recruited. Results: A total of 9504 subjects with T2DM 27.5% females and 72.5% males) with mean age of 53.9 ±16.5 years entered into the study. The mean serum 25(OH)D levels varied across the various months from the lowest level at 46.1±26.6 nmol/l in August to the highest level at 64.9±30.3 nmol/l in January. The mean serum 25(OH)D levels varied significantly across the various seasons from the lowest level at 52.0±28.6 nmol/l in the summer to the highest level at 62.2±30.6 nmol/l in the winter (p<0.0001). Females had significantly higher serum 25-OHD concentrations than the males (59.9±31.8 and 53.1±27.4 years respectively, p<0.0001). Serum 25(OH)D levels varied significantly higher in females across the different seasons except for fall season. The subjects aged higher than 70 years had the highest serum 25(OH)D levels whereas, the subjects aged less than 30 years had the lowest values and the differences between the age groups of 70 years and below was significant. There were statistically significant wide variations in serum 25(OH)D across the various seasons in all decades of age . Conclusions: This study indicates that seasonal changes lead to significant serum vitamin D variations with the lowest values in the summer and in the fall and the highest values the winter and in the spring.
Introduction
Vitamin D is an important factor for regulation of bone metabolism. Several studies have shown a link between vitamin D deficiency and the development of many clinical conditions such as diabetes [1, 2]. The primary source of vitamin D is exposure to solar UV-B radiation [3, 4, 5]. Several factors including the season, strength of the UV rays, age, place of residence, duration of UV exposure, intake of vitamin, physical activity and the amount of pigment in the skin contribute to the production of vitamin D3 in the skin [5, 6, 7, 8, 9, 10, 11]. These observations provide a rational for predicting the status of serum vitamin D in high risk individual [1, 2]. The impact of seasonal changes over serum vitamin D has been addressed in several previous studies [12, 13]. Lower serum vitamin D in winter months compared with summer has been shown [12, 13, 14, 15, 16, 17].
Current studies confirm that the prevalence of vitamin D deficiency in the general world population is actually as high as 50-80%, even occurring in countries located in geographical areas which receive sunshine year-round [18]. The Middle East and the North African region in general including Saudi Arabia have very high prevalence of vitamin D deficiency even in the normal asymptomatic population [19, 20, 21]. The prevalence of type 2 diabetes mellitus (T2DM) in Saudi Arabia is one of the highest reported in the world, reaching up to 30% in a recent study. 22 It has been demonstrated that vitamin D deficiency is associated with T2DM [23, 24, 25, 26].
Despite the potentially enormous influence of vitamin D on health, there is a paucity of population-based data on the seasonality of serum vitamin D levels in patients with T2DM [25]. However, the detailed empirics of when serum 25(OH)D levels peak and trough during the year has not heretofore been well characterized with large sample size studies in Saudi Arabia. Our goal was to establish the prevalence of vitamin D seasonal variation in an ambulatory adult population of Jeddah, one of the western most regions of the Saudi Arabia.
Methods
A cross-sectional single centre study was conducted in 4059 patients with T2DM attending the Diabetes Centre at King Fahad Armed Forces Hospital, Jeddah, Saudi Arabia between January 2018 and December 2018 were recruited. Eligible patients were 20 years or older. Exclusion criteria were known hepatic or renal disease, metabolic bone disease, malabsorption, hypercortisolism, malignancy, immobility for more than one-week, pregnancy, lactation, and medications influencing bone metabolism. The serum concentration of 25(OH)D was measured by competitive protein binding assay using kits (Immunodiagnostic, Bensheim, Germany). Glycosylated hemoglobin (HbA1c) was measured by the high performance liquid chromatography method (Bio-Rad Laboratories, Waters, MA, USA). The total number of cohort were separated on basis of age values into six groups: 20-29 years, 30-40 years, 40-49 years, 50-59 years, 60-75 years and ≥75 years. The study was approved by the ethical committee board of King Fahad Armed Forces Hospital.
Statistical Analysis
Data are presented as means ± standard deviation (SD) or numbers (%). Quantitative variables were compared between two groups by using the Student’s test. Differences in categorical variables were analyzed using the chi-square test. The data were analyzed by one-way analysis of variance (ANOVA), to estimate the significance of different between groups. The relationship between continuous variables was assessed using coefficients of correlation. P value <0.05 indicates significance. The statistical analysis was conducted with SPSS version 23.0 for Windows.
Results
A total of 9504 subjects with T2DM (4499 (27.5%) females and 1110 (72.5%) males) with mean age of 53.9 ±16.5 years entered into the study (Table 1). The mean age of females and males were non-statically significant different (54.1±16.5 and 53.8±16.5 years respectively, p=0.6). The mean and median 25-OHD concentrations were 58.0 ±30.8 and 04.5 respectively.
| Variable | Values | |||||
|---|---|---|---|---|---|---|
| Total | 4059 | |||||
| Age (years) | 53.9 ±16.5 | |||||
| Gender | Male | 1115 ( 27.5 ) | ||||
| Female | 2944 ( 72.5 ) | |||||
| HbA1c (%) | 7.7 ±1.9 | |||||
| 25-hydroxyvitamin D ( nmol/L ) | 58.0 ±30.8 |
Table 1: Patient characteristics [mean±standard deviation or number (%)].
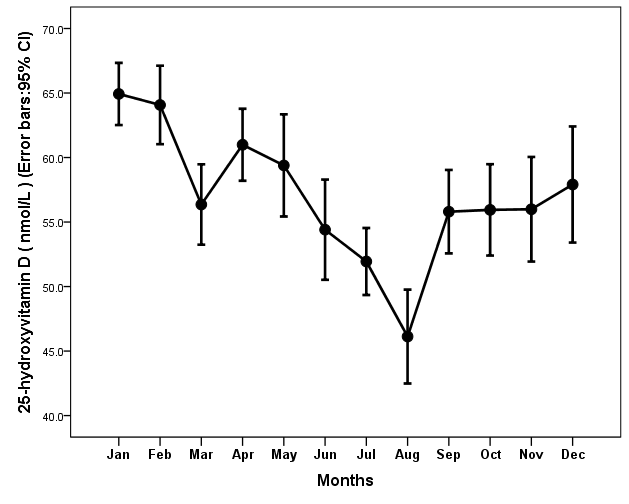
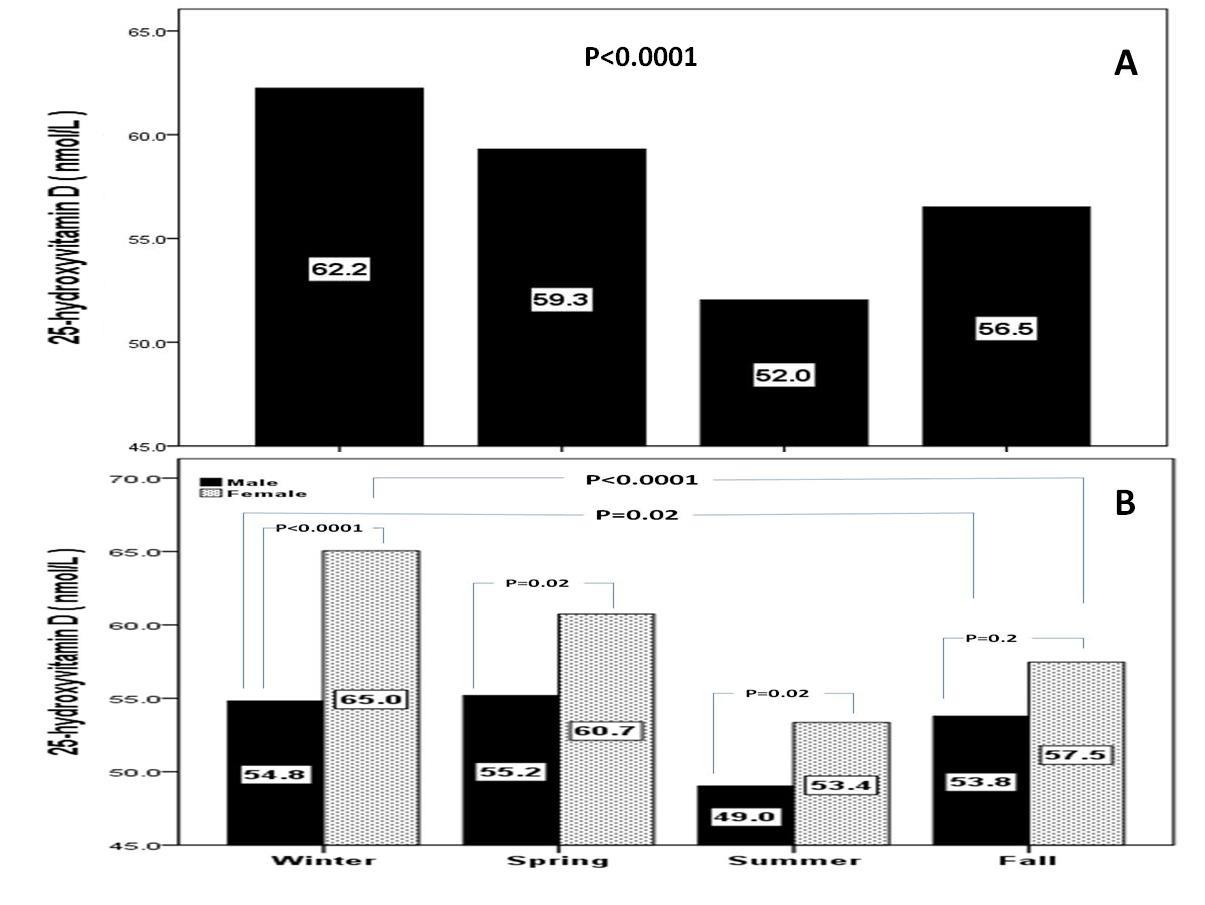
The mean serum 25(OH)D levels varied across the various months from the lowest level at 46.1±26.6 nmol/l in August to the highest level at 64.9±30.3 nmol/l in January (Figure 1). The mean serum 25(OH)D levels varied significantly across the various seasons from the lowest level at 52.0±28.6 nmol/l in the summer to the highest level at 62.2±30.6 nmol/l in the winter (p<0.0001). Serum 25(OH)D levels in each season varied across sexes. Females had significantly higher serum 25- OHD concentrations than the males (59.9±31.8 and 53.1±27.4 years respectively, p<0.0001). Serum 25(OH)D levels varied significantly higher in females across the different seasons except for fall season (Figures 2 A and 2B).
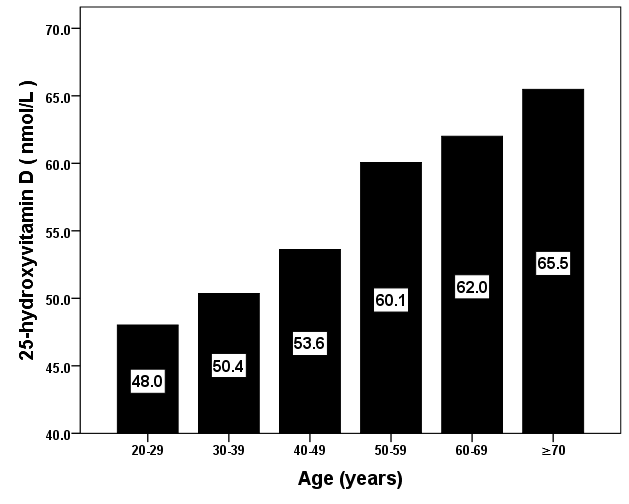
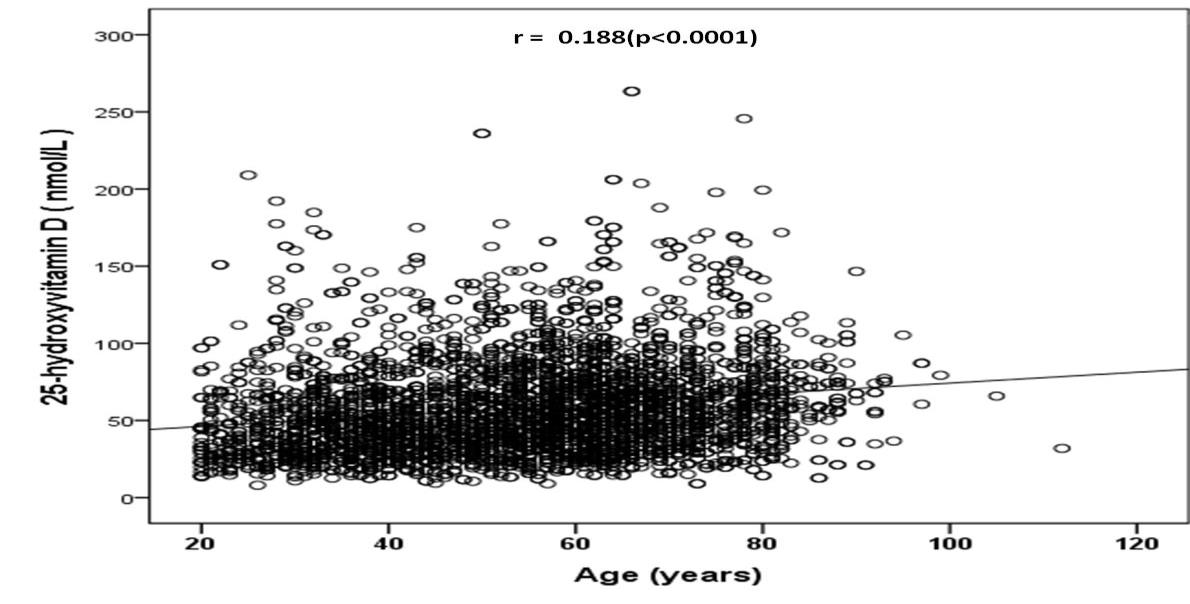
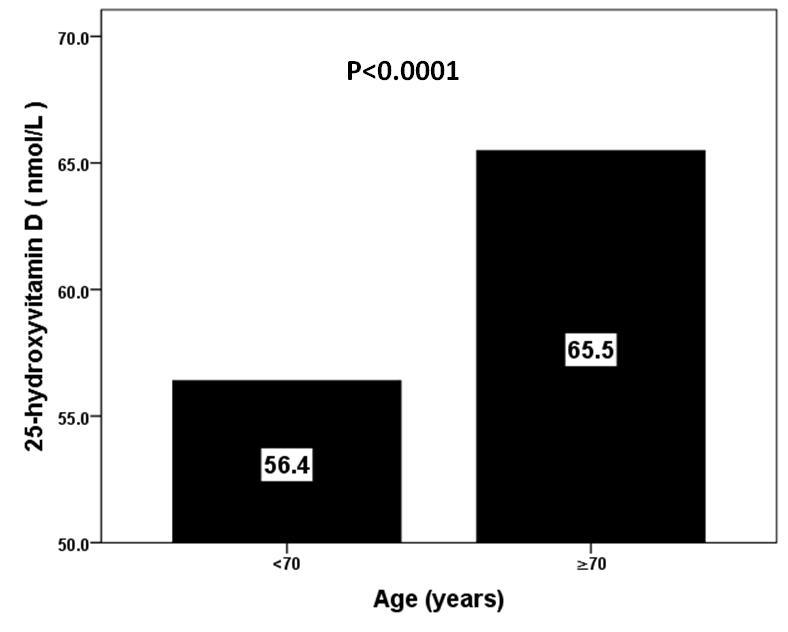
Serum 25(OH)D levels were positively increased with age (Figure 3 and 4). The subjects aged higher than 70 years had the highest serum 25(OH)D levels whereas, the subjects aged less than 30 years had the lowest values and the differences between the age groups of 70 years and below was significant (Figure 5). There were statistically significant wide variations in serum 25(OH)D across the various seasons in all decades of age (Table 2).
| Parameters | 20-29 | 30-39 | 40-49 | 50-59 | 60-69 | 75≤ |
|---|---|---|---|---|---|---|
| Numbers | 323 (8.0) | 622 (15.3) | 618 (15.2) | 874 (21.5) | 884 (21.8) | 738 (18.2) |
| Winter | 40.0 ±28.5 | 53.5 ±29.3 | 56.6 ±26.7 | 61.6 ±30.1 | 70.1 ±27.7 | 74.1 ±33.4 |
| Spring | 48.5 ±31.9 | 52.4 ±29.1 | 55.0 ±25.3 | 65.2 ±31.8 | 59.1 ±33.7 | 66.6 ±35.6 |
| Summer | 48.9 ±34.0 | 45.7 ±20.5 | 52.1 ±33.3 | 50.5 ±26.0 | 57.2 ±30.6 | 54.7 ±27.3 |
| Fall | 41.5 ±28.2 | 47.2 ±26.9 | 48.0 ±25.9 | 62.3 ±29.1 | 58.7 ±33.9 | 64.6 ±30.5 |
| Total | 48.0 ±30.7 | 50.4 ±27.1 | 53.6 ±28.3 | 60.1 ±29.9 | 62.0 ±31.7 | 65.5 ±32.7 |
| P value | 0.6 | 0.02 | 0.06 | <0.0001 | <0.0001 | <0.0001 |
Table 2: Variations in serum 25-hydroxyvitamin D by mean±SD in different decades of age across various seasons [mean±standard dev
The findings of this study indicated variations in mean serum 25(OH)D levels across the various seasons and in relation to age and sex. The serum 25(OH)D level in the summer months particularly in young was at the lowest level versus other seasons. The results of this study are in disagreement with several published studies that addressed the relation between the seasonal changes and the status of vitamin D where the lowest 25(OH)D levels were in winter [12, 13, 17, 27]. These observations indicate that seasonal changes should not consider the exclusive cause of vitamin D variations but many other factors are also contributed to the changes in serum vitamin D over the different seasons [28, 29, 30]. Variation between countries regarding dietary vitamin D intake, food fortification regimen and supplement use may also contribute to the differences. Also, differences in laboratory methods for measuring 25(OH)D can contribute to variations between the studies. In addition, In this study, lower age was related to low serum vitamin D in winter months and so should be considered as a risk factor of vitamin D deficiency in the winter. Despite the low ability of skin in synthesis of vitamin D in elderly population, serum 24-OHD in older group of this study was close to normal indicating low synthesis of 1, 24 dihydroxycholecalceferol by ageing and resultant higher 25-OHD levels [6, 34, 35]. We found that females had significantly higher serum 25-OHD concentrations than the males. In Canada, gender differences were significant, with deficiency prevalence being 30% for males and 24% for females [36]. In this regard, a large meta-analysis across the world also showed that 25(OH)D levels were higher in females than in males [37]. On the contrary, in Iranian subjects, females had slightly lower levels of 25(OH)D than males (20.6 versus 23.2 ng/mL) [38]. Another explanation of the discrepancy could be a greater awareness of osteoporosis and the need for calcium and vitamin D intake among postmenopausal women.
We had several limitations. study was done at only one centre and was done at one point of time. The study sample confined to patients with T2DM but without comparable groups. A larger sample size would have improved precision in some subgroups and a less homogenous population regarding skin type and life-style habits with a broader range of exposure might have provided different estimates. In addition, we have lack of information regarding the dietary intake of vitamin D of the participants. Interpreting and taking action on serum 25(OH)D values analyzed during different seasons of the year may pose a problem to the clinician. In conclusion, this study indicates that seasonal changes lead to significant serum vitamin D variations with the lowest values in the summer and in the fall and the highest values the winter and in the spring. Although, seasonal change in itself cause significant reduction of serum vitamin D in geographic region of this study, and may lead to serum vitamin D reduction in subjects who are at risk of vitamin D deficiency.
Acknowledgments
There is no any financial support or relationships that may pose conflict of interest.
References
-
El Baba K, Zantout MS, Akel R, Azar ST (2011) Seasonal variation of vitamin D and HbA 1c levels in patients with type 1 diabetes mellitus in the Middle East. Int J gen med 4: 635-638.
-
Jarvandi S, Joseph L, Gougeon R, Dasgupta K (2012) Vitamin supplementation and blood pressure in Type 2 diabetes. Diabet Med 29(10): 1253-1259.
-
Holick MF (2007) Vitamin D deficiency. N Eng J Med 357: 266-281.
-
Holick MF (2006) High prevalence of vitamin D inadequacy and implications for health. Mayo Clin Proc 81(3): 353-373.
-
Costanzo PR, Elias NO, Kleiman Rubinsztein J, Garcia Basavilbaso NX, Piacentini R, et al. (2011) Ultraviolet radiation impact on seasonal variations of serum 25- hydroxy-vitamin D in healthy young adults in Buenos Aires. Medicina (B Aires) 71(4): 336-342.
-
Bikle DD (2012) Vitamin D and the skin: Physiology and pathophysiology. Rev Endocr Metab Disord 13(1): 3-19.
-
Burgaz A, Akesson A, MichaelssonK, Wolk A (2009) 25-hydroxyvitamin D accumulation during summer in elderly women at latitude 60 degrees N. J Intern Med 266(5): 476-483.
-
Macdonald HM, Mavroeidi A, Barr RJ, Black AJ, Fraser WD, et al. (2008) Vitamin D status in postmenopausal women living at higher latitudes in the UK in relation to bone health, overweight, sunlight exposure and dietary vitamin D. Bone 42(5): 996-1003.
-
Melin A, Wilske J, Ringertz H, Saaf M (2001) Seasonal variations in serum levels of 25-hydroxyvitamin D and parathyroid hormone but no detectable change in femoral neck bone density in an older population with regular outdoor exposure. J Am Geriatr Soc 49(9): 1190-1196.
-
Dong Y, Pollock N, Stallmann-Jorgensen IS, Gutin B, Lan L, et al. (2010) Low 25-hydroxyvitamin D levels in adolescents: race, season, adiposity, physical activity, and fitness. Pediatrics 125(6): 1104-1111.
-
Willis CM, Laing EM, Hall DB, Hausman DB, Lewis RD (2007) A prospective analysis of plasma 25- hydroxyvitamin D concentrations in white and black prepubertal females in the southeastern United States. Am J Clin Nutr 85(1): 124-130.
-
Rockell JE, Skeaff CM, Venn BJ, Williams SM, Green TJ (2008) Vitamin D insufficiency in New Zealanders during the winter is associated with higher parathyroid hormone concentrations: implications for bone health? N Z Med J 121(1286): 75-84.
-
Kashi Z, Saeedian F, Akha O, Gorgi Ma, Emadi Sf, et al. (2011) Vitamin D deficiency prevalence in summer compared to winter in a city with high humidity and a sultry climate. Endokrynol Pol 62(3): 249-251.
-
Rajakumar K, Holick MF, Jeong K, Moore CG, Chen TC, et al. (2011) Impact of season and diet on vitamin D status of African American and Caucasian children. Clin Pediatr (Phila) 50(6): 493-502.
-
Gonzalez-Parra E, Avila PJ, Mahillo-Fernandez I, Lentisco C, Gracia C, et al. (2012) High prevalence of winter 25-hydroxyvitamin D deficiency despite supplementation according to guidelines for hemodialysis patients. Clin Exp Nephrol 16(6): 945- 951.
-
Moreiras O, Carbajal A, Perea I, Varela-Moreiras V (1992) The influence of dietary intake and sunlight exposure on the vitamin D status in an elderly Spanish group. Int J Vitam Nutr Res 62(4): 303-307.
-
Ono Y, Suzuki A, Kotake M, Zhang X, Nishiwaki Yasuda K, et al. (2005) Seasonal changes of serum 25 hydroxyvitamin D and intact parathyroid hormone levels in a normal Japanese population. J Bone Miner Metab 23(2): 147-151.
-
Gind AA, Liu MC, Camargo CA (2009) Demographic differences and trends of vitamin D insufficiency in the US population, 1988-2004. Arch Intern Med 169(6): 626-632.
-
Maalouf G, Gannage-Yared MH, Ezzedine J, Larijani B, Badawi S, et. al. (2007) Middle East and North Africa consensus on osteoporosis. J Muskuloskelet Neuronal Interact 7(2): 131- 143.
-
Sedrani SH, Elidrissy AW, El Arabi KM (1983) Sunlight and vitamin D status in normal Saudi subjects. Am J Clin Nutr 38(1): 129-132.
-
Al-Turki HA, Sadat-Ali M, Al-Elq AH, Al-Mulhim FA, Al- Ali AK (2008) 25-Hydroxyvitamin D levels among healthy Saudi Arabian women. Saudi Med J 29(12): 1765-1768.
-
Alqurashi KA, Aljabri KS, Bokhari SA (2011) Prevalence of diabetes mellitus in a Saudi community. Ann Saudi Med 31(1): 19-23.
-
Matilla C, Knekt P, Mannisto S, Rissanen H, Laaksonen MA, et al. (2007) Serum 25-hydroxyvitamin D concentration and subsequent risk of type 2 diabetes. Diabetes Care 30(10): 2569-2570.
-
Pittas AG, Dawson-Hughes B, Li T, Van Dam RM, Willett WC, et al. (2006) Vitamin D and calcium intake in relation to type 2 diabetes in women. Diabetes Care 29(3): 650-656.
-
Thorand B, Zierer A, Huth C, Linseisen J, Meisinger C, et al. (2011) Effect of serum 25-hydroxyvitamin D on risk for type 2 diabetes may be partially mediated by subclinical inflammation: results from the MONICA/KORA Augsburg study. Diabetes Care 34(10): 2320-2322.
-
Shaman J, Jeon CY, Giovannucci E, Lipsitch M (2011) Shortcomings of vitamin D-based model simulations of seasonal influenza. PLoS One 6: e20743.
-
Shoben AB, Kestenbaum B, Levin G, Hoofnagle AN, Psaty BM, et al. (2011) Seasonal variation in 25- hydroxyvitamin D concentrations in the cardiovascular health study. Am J Epidemiol 174(12): 1363-1372.
-
Farrar MD, Kift R, Felton SJ, Berry JL, Durkin MT, et al. (2011) Recommended summer sunlight exposure amounts fail to produce sufficient vitamin D status in UK adults of South Asian origin. Am J Clin Nutr 94(5): 1219-1224.
-
Carnevale V, Modoni S, Pileri M, Di Giorgio A, Chiodini I, et al. (2001) Longitudinal evaluation of vitamin D status in healthy subjects from southern Italy: seasonal and gender differences. Osteoporos Int 12(12): 1026-1030.
-
Shea MK, Houston DK, Tooze JA, Davis CC, Johnson MA, et al. (2011) Correlates and prevalence of insufficient 25-hydroxyvitamin D status in black and white older adults: the health, aging and body composition study. J Am Geriatr Soc 59(7): 1165- 1174.
-
Klenk J, Rapp K, Denkinger MD, Nagel G, Nikolaus T, et al. (2013) Seasonality of vitamin D status in older people in Southern Germany: implications for assessment. Age Ageing 42(3): 404-408.
-
Papadakis, G , Keramidas I, Kakava k, Pappa T, Villiotou V (2015) Seasonal Variation of Serum Vitamin D Among Greek Female Patients with Osteoporosis. In Vivo May-June 29(3): 409-413.
-
Romero-Ortuno R, Cogan L, Browne J, Healy M, Casey MC, et al. (2011) Seasonal variation of serum vitamin D and the effect of vitamin D supplementation in Irish community-dwelling older people. Age Ageing 40(2): 168-174.
-
Heidari B, Shirvani JS, Firouzjahi A, Heidari P, Hajian– Tilaki KO (2010) Association between nonspecific skeletal pain and vitamin D deficiency. Int J Rheum Dis 13(4): 340-346.
-
Perez-Lopez FR, Chedraui P, Fernandez-Alonso AM (2011) Vitamin D and aging: beyond calcium and bone metabolism. Maturitas 69(1): 27-36.
-
Naugler C, Zhang J, Henne D, Woods P, Hemmelgarn BR (2013) Association of vitamin D status with sociodemographic factors in Calgary, Alberta: an ecological study using Census Canada data. BMC Public Health 13: 316.
-
Hagenau T, Vest R, Gissel TN, Poulsen CS, Erlandsen M, et al. (2009) Global vitamin D levels in relation to age, gender, skin pigmentation and latitude: an ecologic meta-regression analysis. Osteoporos Int 20(1): 133-140.
-
Heidari B, Haji Mirghassemi MB (2012) Seasonal variations in serum vitamin D according to age and sex. Caspian Journal of Internal Medicine 3(4): 535- 540.
- Shaping Healthy Futures: Pediatric Endocrine Breakthroughs of 2025
- Precision Medicine in Obesity: Customizing Treatment for 2025
- The Thyroid Revolution: How 2025 is Redefining Hormone Health
- Editorial- Targeting Immunometabolism for Generating Innovative Therapies for Cancer
- Current Knowledge of Chickenpox
- Correlation of Preinjection Values of Gonadotropins and Estradiol Level with Clinical and Radiologic Evidence of Sufficient Pubertal Suppression in Girls with Central Precocious Puberty