Eggshell Waste Generation and Management Practices in Kaduna Metropolis, Nigeria
This study investigates eggshell waste generation and management practices in Kaduna Metropolis, Nigeria. Data were collected from various wards to determine the eggshell generation rate and examine waste management practices. Results show a high eggshell waste generation rate, particularly in urban wards with dense food vendor populations. The annual eggshell waste generation rate in Kaduna Metropolis was found to be 32,667.08 kg. Majority of eggshell waste generated end up in open dumpsite (85.4%) which reflects a poor eggshell waste management practice, the waste management practice in Kaduna metropolis is generally not satisfactory due to lack of consistency and poor awareness of its negative impact, as well inadequate waste collection and transportation. Most waste is disposed of in open dumpsites, indicating poor waste management practices. Lack of awareness and poor literacy levels contribute to ineffective waste management. Increased awareness and exploitation of the energy potentials of eggshell waste is needed to encourage better eggshell waste management.
Abbreviations
FAO: The Food and Agriculture Organization; MSW: Municipal Solid Waste; LAWMA: Lagos Waste Management Authority; GPS: Global Position System.
Introduction
Eggs are a staple food source globally, leading to a significant amount of eggshell waste generation. This waste stream poses environmental challenges if not managed effectively. Eggshell waste poses a significant environmental challenge in urban areas due to its high generation rate and inadequate management practices. A key concern of international scale is management and utilization of wastes chief of which is Municipal Solid Waste (MSW), for which agriculture generates significant portions in different types. Reducing environmental problems caused by such waste relies on the sufficient utilization of such waste leveraging improved technology. In the global scale, the management of agricultural wastes is essential and a crucial strategy as it becomes a critical factor for humans, animals and vegetation [1]. As the population increases, waste management and provision of sustainable energy for economic development become challenging. Waste generation in Nigeria is estimated at 0.65 – 0.95kg/capita/day which gives an average of 42 million tonnes of the total 62 million tonnes of wastes generated in sub-Saharan Africa annually and the issue of where and how to channel these wastes become a huge problem for the country [2]. The agricultural waste could be categorized in biological, solid, hazardous and used oil, and then regulated according to how it can be disposed of. The solid waste includes any kind of garbage made by agricultural establishment, sludge from water treatment plants and any waste materials created during agricultural activity. Eggshells are one of the widely generated by-products from food processing in industries and homes that has resulted to adverse environmental impacts in our surroundings [3]. As global population is surging up, similarly the production of eggshell wastes is estimated to increase that will demand high disposing costs for the large quantities of wastes released from food processing businesses and industries [4]. Most agricultural waste researches basically concentrate on its energy potential or as a renewable raw material due to its abundance, cheapness and renewability [5, 6]. Understanding waste generation rates and management practices is crucial for developing effective strategies to mitigate environmental impact. This study investigates eggshell waste generation and management practices in Kaduna Metropolis, Nigeria.
Literature Review
Previous studies have highlighted the environmental impact of eggshell waste and the potential for its valorisation in biodiesel production. A number of research highlight that management of solid waste is typically one of the local government authority’s responsibilities to its residents [7]. However, management is always associated with the largest budget from the city’s annual finance, and this is most particular in developing countries. Improper collection and uncontrolled disposal are usually the leading contributor to local flooding and water pollution, particularly in developing countries [8]. In general, open burning and dumping of MSW are contributing to environmental pollution and human health problems and it is of great concern locally and globally [9, 7, 10]. MSW is a complex issue that has manifested in difficulty to manage in many regions of the world and the rapid rate of uncontrolled and unplanned urbanization in the developing nations of Africa makes MSW harder and more complex to manage in developing countries [11]. The available data from the previous studies have managed to estimate the solid waste generation per capita per day in Nigeria as between 0.58kg – 0.91kg [10, 12] and estimated annual solid waste generated in Nigeria to be more than 32 million tons [13]. Whilst Ike CC, et al. [2] in their study to examine the problems and prospects of solid waste management in Nigerian cities using the mixed method of data collection estimated MSW generation in Nigerian cities at the rate of 0.65-0.95 kg/capita/day and at an average of 42 million tonnes annually. Previous research highlights that organic waste represents 52 - 60% of the total MSW that is generated across the country every year, which indicate similarity with the estimate of organic waste in sub- Saharan Africa [2, 14, 15, 16, 17]. Nwosu AO, et al. [18], review of secondary data on waste management across various parts of Nigeria found that organic waste constitutes up to 50 per cent of the overall MSW in Nigerian cities. In their study they underlined the dysfunctional nature of MSW practices in Nigerian cities as the manifestation of a huge number of organic resources ends up being burnt or dumped as a way of disposing of it, thereby leading to various environmental problems. The Food and Agriculture Organization (FAO) estimates global egg production at over 80 million tonnes annually [19]. Assuming an average eggshell weight of 10% of total egg weight, this translates to a staggering 8 million tonnes of eggshell waste generated each year. Eggshell waste originates from households, restaurants, bakeries, and food processing industries. Studies by Wei Z, et al. [20] and Obi F, et al. [1] have demonstrated the significant volume of eggshell waste generated in various contexts, including households, restaurants, and food processing facilities. The seasonal variations in egg consumption and production cycles also influence eggshell waste generation rates, with implications for waste management planning. Socio-demographic factors such as gender, age, education, and income levels play a critical role in shaping waste management practices. Research by Longe EO, et al. [21] and Giwa AH, et al. [22] has highlighted the influence of these factors on waste segregation, disposal behaviours, and awareness of sustainable waste management practices.
Challenges in eggshell waste management include inadequate waste collection infrastructure, lack of awareness about waste valorisation opportunities, and limited market demand for recycled eggshell products. These challenges hinder efforts to minimize waste generation and promote circular economy principles (Author et al., Year). Despite challenges, researchers have explored innovative strategies for eggshell waste valorisation, including conversion into value-added products such as calcium carbonate, biochar, and adsorbent materials. Studies by Ajala EO, et al. [23] and Erchamo YS, et al. [24] have demonstrated the feasibility of using eggshell waste as a catalyst for biodiesel production, highlighting its potential for sustainable energy development. Policy interventions aimed at promoting waste segregation, recycling, and valorisation are essential for enhancing eggshell waste management practices. Public awareness campaigns, incentives for waste reduction, and investment in waste infrastructure are recommended to address the challenges associated with eggshell waste management [25]. However, limited research exists on eggshell waste generation rates and management practices in urban areas, particularly in Kaduna Metropolis.. Understanding socio-demographic characteristics and waste generation patterns is essential for effective waste management strategies.
Study Area and Methodology
Kaduna State is in the North West of Nigeria. It shares boundaries with Federal Capital Territory, Abuja and Nasarawa State to the South, Bauchi and Plateau States to the East, Niger State to the West and Zamfara, Katsina and Kano States to the North. Specifically, Kaduna metropolis is located between latitude 10°23‟ N and 10°43‟ N and columbite. 7°17‟ and 7°37‟E [26]. The area consists of four Local Government Areas, namely: Kaduna North and Kaduna South, and parts of Igabi and Chikun Local Governments with an area of about 12,347 km2 (Figure 1).
Kaduna metropolis forms part of the country’s traditional melting pot. There are literally people from all walks of life as the metropolis is cosmopolitan which is gradually attaining a megacity status. According to the 2006 census provisional figures put the population of the state at 6,113,503 [27]; but Kaduna State has a projected population of 9,224,053 as at 2022 [28]; for which Kaduna metropolis comprising of Chikun, Igabi, Kaduna North and Kaduna South Local Government is home to about 2,320,000 which equals 25% of the total population [29].
Kaduna metropolis experiences a typical continental climate with two distinct seasons, the dry and rainy seasons. These seasons reflect the influences of tropical continental and equatorial maritime air masses, which sweep over the entire country. However, the seasonality is pronounced with the cool to hot dry season being longer than the rainy season. The wet / rainy season is usually from May to October and varies as one moves northwards. On average, the metropolis enjoys a rainy season of about six months [26]. This climatic condition of Kaduna metropolis encourages poultry farming of especially chicken birds all year round, leading to higher production and resultant consumption of chicken eggs with increasing generation of eggshell. The populace of Kaduna metropolis engages in various trading, industrial and clerical activities especially with the springing up of food processing industries, manufacturing plants, large markets, shopping malls, neighborhood centres among others. The large presence of the now moribund textile companies had attributed to the high production of cotton in the area but other cash crops being cultivated include ginger and groundnut [30].
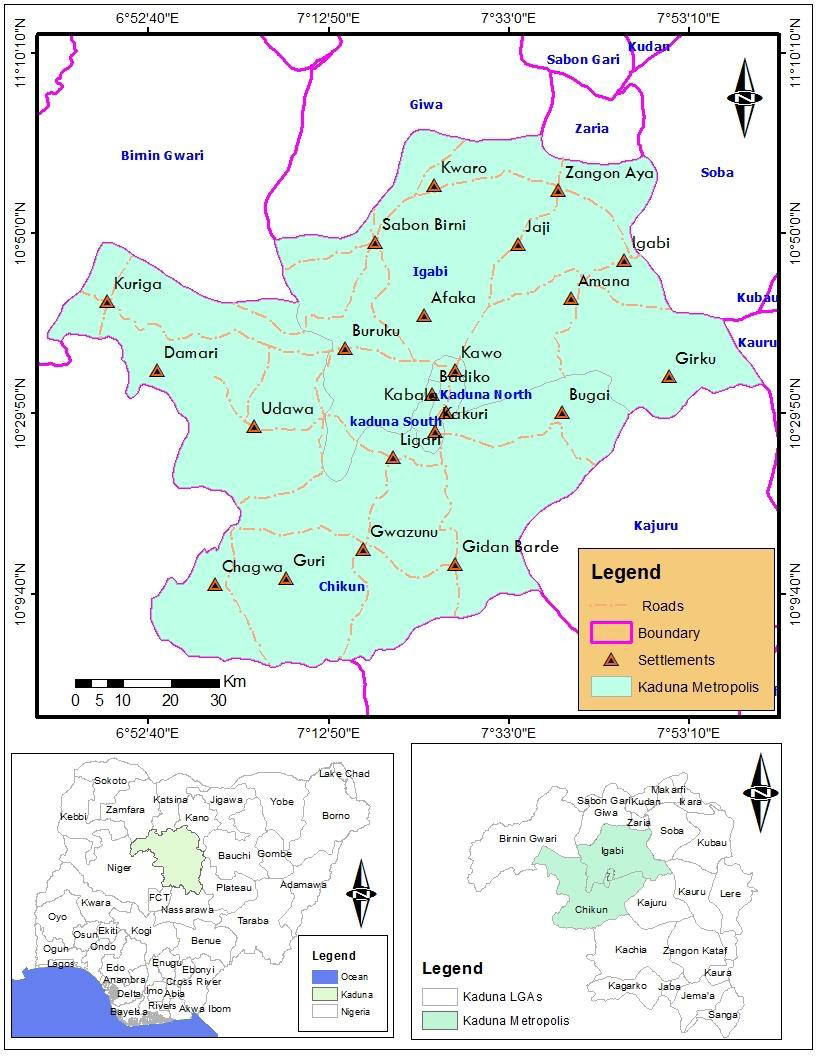
Source: GIS Lab Department of Geography ABU Zaria, Using ArcGIS 10.3 Software. Figure 1: Location of the Study Area, Kaduna Metropolis.
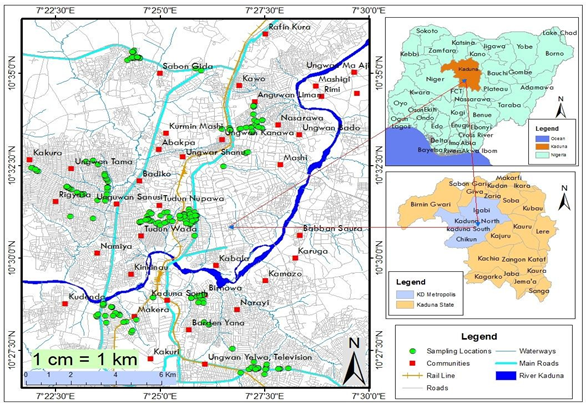
This study employed a survey-based approach to collect data on eggshell waste generation rate, waste management practice, and awareness levels among residents of Kaduna Metropolis. Socio-demographic characteristics of respondents were also analysed to understand their perceptions and practices regarding waste management. The data collection was carried out in stages: Stage 1: Purposive sampling technique was used to selected four Local Government Areas that make up Kaduna Metropolis based on spatial spread namely: Kaduna North and Kaduna South, and parts of Igabi and Chikun Local Governments. Stage 2: Purposive sampling was used to select wards under Igabi and Chikun Local Government Areas that fall within Kaduna metropolis. Then simple random sampling technique was used to select two political wards through balloting on each of the four Local Governments given rise to a total of eight (8) wards. Stage 3: Simple random sampling was used to select one locality each from the selected political wards through balloting. Stage 4: Based on sampling frame of food vendors within the egg consumption value chain (Tea Cafés, Restaurants, Snack Shops and Food Bukkas), they were selected through systematic sampling were each food vendor within the selected locality was numbered and each odd number food vendor was selected until 217 food vendors were obtained. Stage 5: Questionnaires were issued out to each of the 217 selected food vendors from which eggshell generation rate across all the twelve (12) months of 2022 was ascertained alongside cost of segregating eggshell waste. But as a way of supporting the information provided by the vendors through the questionnaire administered, a sample collection exercised was carried on all the selected food vendors. This was achieved by first locating the waste collection bin/spot into which their solid waste was deposited; it was emptied by the researcher and his field assistants twice a day (morning and evening), then the eggshell waste was segregated, weighed, and recorded accordingly; this was done for a week period while at the same time acquiring the coordinates of the locations using a global position system (GPS). The data generated helped to authenticate the data provided by the vendors through the questionnaires administered in terms of eggshell generation rate and management practices of eggshell waste. The questionnaire administered helped to generate data on eggshell waste management practice among the food vendors.
Results and Discussion
Socio-Demographic Characteristics of Respondents
Gender and Age Distribution: Table 1 shows the gender distribution of the survey population. The gender distribution obtained shows that 69.6% of the respondents were male while 30.4% were female, which aligns with currently business involvement realities, where males are higher in businesses than females; this agrees with the findings of Giwa AH, et al. [22] that women entrepreneurship in Nigeria, women in Nigeria still own and manage fewer number of businesses than men.
Age plays a vital role in the research of social as well as environmental issues as maturity might affect the level of awareness on waste management and environmental health [21]. The results in Table 2 indicate that a majority (39.6%) of the respondents were adults, between 24 to 35 years of age, who are expected to possess a considerable level of reasoning and understanding of the concept of eggshell waste generation and management, and who were able to provide answers to the survey questions to a high degree of certainty.
| Gender | Frequency | Percentage |
|---|---|---|
| Male | 151 | 69.60% |
| Female | 66 | 30.40% |
| Total | 217 | 100.00% |
Table 1: Gender Distribution of the Respondents.
| Age Range (years) | Frequency | Percentage |
|---|---|---|
| 0-17 | 2 | 0.90% |
| 18-24 | 32 | 14.70% |
| 25-34 | 86 | 39.60% |
| 35-44 | 48 | 22.10% |
| 45-54 | 38 | 17.50% |
| 55 and above | 11 | 5.10% |
| Total | 217 | 100.00% |
Table 2: Age Distribution of the Respondents.
Educational Level of Respondents: Level of Education is included to help determine how much exposure and knowledge the respondents have acquired on the subject of eggshell waste generation and management. The influence of this variable can also be a vital factor which could affect the perception of the public on solid waste management [21].
The results as presented in Table 3, show that the majority of the respondents (37.8%) have at least attended secondary school, however a significant number of them have no formal education (35.9%) followed by those having primary education (17.5%); while only 8.8% have attended tertiary institutions. The high number of respondents that admitted to not having attained any educational qualification could still negatively influence their perception on eggshell waste management in general. It is unfortunate, however, that even amongst those claiming to have attained secondary or tertiary education, some still possess lackadaisical attitudes, as seen by the indiscriminate manner in which they dispose of their solid wastes.
| Educational Level | Frequency | Percentage |
|---|---|---|
| No formal Education | 78 | 35.90% |
| Primary | 38 | 17.50% |
| Secondary | 82 | 37.80% |
| Tertiary | 19 | 8.80% |
| Total | 217 | 100.00% |
Table 3: Educational Level of the Respondents.
Eggshell Waste Generation Rate According to Wards
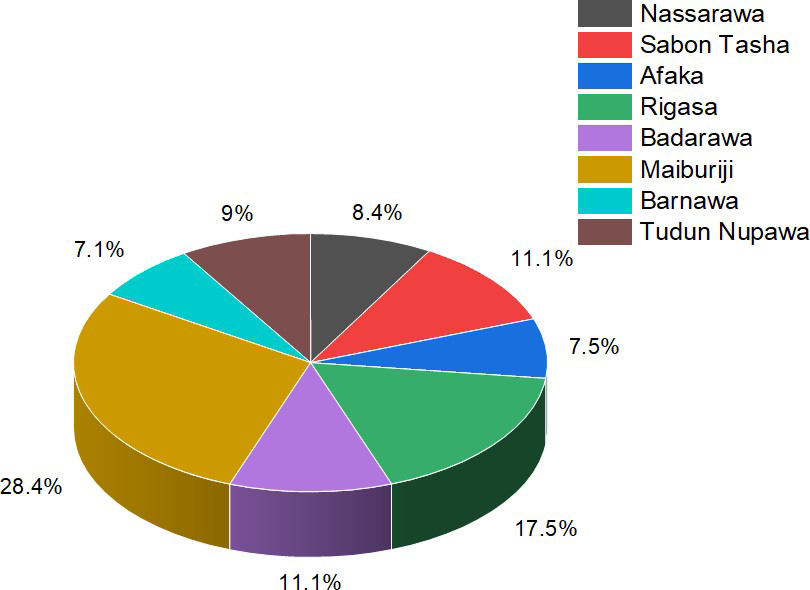
The distribution of eggshell waste generation rate across the wards in the study area (Figure 2) is presented in Tables 4-6, the results indicate that Maiburuji ward had the highest number of food vendors in the eggshell value chain at 19% and Barrnawa had the lowest at 8% (Tables 4,5). Within the egg-consumption value chain, in terms of the type of food vendors, Tea Cafés are the highest with a total ratio of 10:4:3:1 for Tea Cafés, Snack shops, Food joint (bukka) and restaurants respectively (Table 5). In terms of eggshell waste generation rate, Maiburuji ward accounted for 34.9 kg, 251.6 kg and 941.0 kg of eggshell waste generated daily, weekly and monthly respectively which is the highest, while Barnawa ward recorded the lowest eggshell generation rate in the study area with 6.93 kg, 48.02 kg, and 192.06 kg daily, weekly and monthly respectively as shown in Figure 3.
| Local Govt. | Ward | Sampling Location | No. of Food Vendors | Percentage Distribution (%) | No. of Selected Vendors |
|---|---|---|---|---|---|
| Chikun | Nassarawa | Nassarawa | 60 | 13 | 28 |
| Sabon Tasha | Sabo Market | 49 | 10 | 22 | |
| Igabi | Afaka | Mando | 43 | 9 | 20 |
| Rigasa | Rigasa | 70 | 15 | 33 | |
| Kaduna North | Badarawa | Badarawa | 65 | 14 | 30 |
| Maiburiji | Central Market | 90 | 19 | 41 | |
| Barnawa | Barnawa | 40 | 8 | 17 | |
| Kaduna South | Tudun | Tudun | 55 | 12 | 26 |
| Nupawa | Nupawa | ||||
| Total | 472 | 100 | 217 |
Table 4: Food Vendors in the Eggshell Waste Value Chain According to Wards.
| Ward | Tea Café | Restaurant | Snack Shop | Food Joint (Bukka) | Total |
|---|---|---|---|---|---|
| Nassarawa | 14 | 3 | 9 | 2 | 28 |
| Sabon Tasha | 12 | 2 | 5 | 3 | 22 |
| Afaka | 11 | 4 | 1 | 4 | 20 |
| Rigasa | 26 | 0 | 6 | 1 | 33 |
| Badarawa | 12 | 1 | 12 | 5 | 30 |
| Maiburiji | 14 | 1 | 10 | 16 | 41 |
| Barnawa | 15 | 0 | 2 | 0 | 17 |
| Tudun Nupawa | 18 | 1 | 2 | 5 | 26 |
| Frequency | 122 | 12 | 47 | 36 | 217 |
| Percentage (%) | 56.22 | 5.53 | 21.66 | 16.59 | 100 |
| Eggshell Generation Rate (Kg) | |||||
| Ward | Daily | Weekly | Monthly | Yearly | Percentage (%) |
| Nassarawa | 9.49 | 57.5 | 226.88 | 2,733.39 | 8.4 |
| Sabon Tasha | 9.58 | 65.75 | 265.16 | 3,635.94 | 11.1 |
| Afaka | 8.26 | 49.83 | 202.95 | 2,433.92 | 7.5 |
| Rigasa | 19.22 | 227.29 | 814.61 | 5,719.28 | 17.5 |
| Badarawa | 11.06 | 111.46 | 431.97 | 3,615.15 | 11.1 |
| Maiburiji | 34.89 | 251.63 | 941 | 9,263.76 | 28.4 |
| Barnawa | 6.93 | 48.02 | 192.06 | 2,334.75 | 7.1 |
| Tudun Nupawa | 7.22 | 185.3 | 200.31 | 2,930.90 | 9 |
| Total | 106.63 | 996.77 | 3,274.92 | 32,667.08 | 100 |
Table 5: Distribution of Food Vendors in the Eggshell Waste Value Chain According to Wards.
The high eggshell waste generation rate in Maiburiji ward can be attributed to the high concentration of food vendors being that by spatial positioning it is the city center in which the largest market – Kaduna Central Market is located for which most of the people opt for egg as a source of protein. Also, the large population of people that the market records drive the establishment of businesses within the egg-consumption value-chain leading to large generation of eggshell waste. This agrees with the position, that population growth and urbanization play a role in increase food consumption as reported by Popkin, et al. In agreement too is the findings of Omololu FO, et al. [31] that population significantly influences waste generation and management in Lagos metropolis. More specifically, the findings of Owuamanam S, et al. [4] that surging population leads to increase in production of eggshell waste is in line with the findings of this work. Furthermore, being that Maiburiji ward is more urban than the other wards, higher per capital income among the populace is perhaps the reason for higher egg consumption leading to higher eggshell waste generation rate which is in line with the findings of that overall food supply increases with greater range of food choices as a direct result of urbanization which feature higher per capital income for which most developing countries particularly in sub-Saharan Africa have an urbanization rate of greater than 4% [32]. The least eggshell waste generation rate in Barnawa ward in comparison to other wards under study can be attributed to the lesser number of food vendors within the egg-consumption value chain (Tables 1 & 2).
Eggshell Waste Management Practice in Kaduna Metropolis
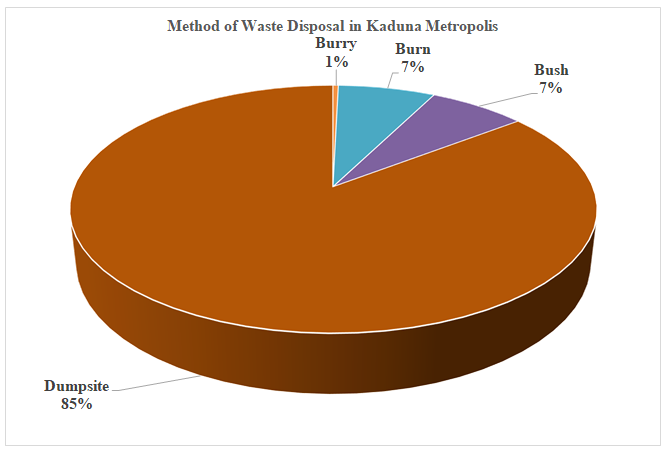
Method of Eggshell Waste Management: The results show that majority (85.4%) of the respondents dispose of their solid wastes at open dumpsite (Figure 4). This condition is because numerous regions within the study areas lack proper functioning waste collection services, and as such, the respondents’ resort to alternative practices that are often unsafe and unsanitary. Whereas majority of the respondents admitted the presence of waste collection agencies running in their communities, but 20.7% stated that such agencies come around just once in a month. Although a majority (59.0%) said such agencies come once a week, 16.1% do not come at all (Tables 7 & 8). This finding agrees in part with the findings of Olukanni, Pius-Imue and Joseph FB, et al. [33] in the sense that both findings reflects that majority of solid waste are dispose of in open dumpsite, but different percentage that constitute majority put at 85.4% and 36.6% for the former and later findings respectively. The finding of Adedigba AA, et al. [34] also reflects that waste in Lagos metropolis never gets collected by Lagos Waste Management Authority (LAWMA) weekly, it is usually fortnightly and at times it can remain uncollected for four weeks. The higher open dumping practice of respondents in this research is not unconnected with their lower literacy level with 35.9% having no form of formal education as compared to only 9% in the research of Pius- Imue FB, et al. [33]. Agencies that focus on environmental initiatives aimed at improving the environment could serve as a vital factor to positively change people’s perception of effective waste management [35, 36, 37].
| Method of Waste Disposal | |||||
|---|---|---|---|---|---|
| Ward | Burry | Burn | Bush | Dumpsite | Total |
| Nassarawa | 0 | 9 | 6 | 26 | 41 |
| Sabon Tasha | 0 | 1 | 0 | 22 | 23 |
| Afaka | 0 | 0 | 0 | 19 | 19 |
| Rigasa | 0 | 0 | 0 | 33 | 33 |
| Badarawa | 0 | 4 | 1 | 25 | 30 |
| Maiburiji | 0 | 2 | 2 | 40 | 44 |
| Barnawa | 0 | 0 | 0 | 17 | 17 |
| Tudun Nupawa | 1 | 1 | 8 | 22 | 32 |
| Total | 1 | 17 | 17 | 204 | 239 |
| Percentage | 0.40% | 7.10% | 7.10% | 85.40% | 100.00% |
Table 6: Method of Waste Disposal According to Wards in Kaduna Metropolis.
| Visit of Waste Collection Agency | |||||
|---|---|---|---|---|---|
| Ward | Once a week | Once a month | Once in six months | Never | Total |
| Nassarawa | 7 | 17 | 1 | 4 | 29 |
| Sabon Tasha | 22 | 0 | 0 | 0 | 22 |
| Afaka | 8 | 0 | 5 | 6 | 19 |
| Rigasa | 30 | 0 | 0 | 3 | 33 |
| Badarawa | 22 | 5 | 0 | 3 | 30 |
| Maiburiji | 24 | 1 | 0 | 15 | 40 |
| Barnawa | 8 | 9 | 0 | 0 | 17 |
| Tudun Nupawa | 7 | 13 | 3 | 4 | 27 |
| Total | 128 | 45 | 9 | 35 | 217 |
| Percentage | 59.00% | 20.70% | 4.10% | 16.10% | 100.00% |
Table 7: Visit of Waste Collection Agency According to Wards in Kaduna Metropolis.
| Offensive Odour Control Measures | |||||
|---|---|---|---|---|---|
| Ward | Provide Disposable Bags | Recycling | Biological Treatment | Total | |
| Nassarawa | 28 | 0 | 0 | 0 | 28 |
| Sabon Tasha | 22 | 0 | 0 | 0 | 22 |
| Afaka | 19 | 0 | 0 | 0 | 19 |
| Rigasa | 33 | 0 | 0 | 0 | 33 |
| Badarawa | 16 | 4 | 9 | 0 | 29 |
| Maiburiji | 41 | 0 | 0 | 0 | 41 |
| Barnawa | 17 | 2 | 0 | 0 | 19 |
| Tudun Nupawa | 13 | 6 | 7 | 0 | 26 |
| Total | 189 | 12 | 16 | 0 | 217 |
| Percentage | 87.10% | 5.50% | 7.40% | 0.00% | 100.00% |
Table 8: Efforts to Control Offensive Odour from Dumpsite in Kaduna Metropolis.
| Designated Waste Collection Containers | ||||||
|---|---|---|---|---|---|---|
| Ward | 1 to 2 | 3 to 4 | 5 to 6 | Above 6 | Total | |
| Nassarawa | 29 | 0 | 0 | 0 | 0 | 29 |
| Sabon Tasha | 20 | 2 | 0 | 0 | 0 | 22 |
| Afaka | 0 | 15 | 4 | 0 | 0 | 19 |
| Rigasa | 0 | 32 | 1 | 0 | 0 | 33 |
| Badarawa | 3 | 3 | 1 | 0 | 23 | 30 |
| Maiburiji | 12 | 26 | 3 | 0 | 0 | 41 |
| Barnawa | 17 | 0 | 0 | 0 | 0 | 17 |
| Tudun Nupawa | 9 | 9 | 7 | 1 | 0 | 26 |
| Total | 90 | 87 | 16 | 1 | 23 | 217 |
| Percentage | 41.50% | 40.10% | 7.40% | 0.50% | 10.60% | 100.00% |
Table 9: Designated Waste Collection Containers in Kaduna Metropolis.
| Frequency of Environmental Sanitation | |||||
|---|---|---|---|---|---|
| Ward | Never | Once a Week | Once in 2 Week | Once in 3 Week | Total |
| Nassarawa | 27 | 1 | 0 | 0 | 28 |
| Sabon Tasha | 19 | 1 | 1 | 1 | 22 |
| Afaka | 9 | 4 | 1 | 5 | 19 |
| Rigasa | 27 | 4 | 0 | 2 | 33 |
| Badarawa | 7 | 21 | 1 | 1 | 30 |
| Maiburiji | 20 | 17 | 0 | 4 | 41 |
| Barnawa | 16 | 1 | 0 | 0 | 17 |
| Tudun Nupawa | 10 | 1 | 5 | 11 | 27 |
| Total | 135 | 50 | 8 | 24 | 217 |
| Percentage | 62.20% | 23.00% | 3.70% | 11.10% | 100.00% |
Table 10: Frequency of Environmental Sanitation in Kaduna Metropolis.
Eggshell waste alongside other municipal solid waste in the study area majorly (87.1%) are not handled in a way to counter air pollution through the offensive odour such waste generates; majority of respondents (41.5%) do not have designated waste collection containers in their localities with only 40.1% of the respondents having between 1 to 2 of such waste collection containers; there leading to indiscriminate disposal of waste (Tables 9 & 10). From the result obtained (Table 11), majority (62.2%) do not practice sanitation at all while only 23% of the respondents conduct sanitation once a week. This gives a poor waste management culture of the respondents across the localities which is evident in liters clogging water run ways and high rate of open dumping.
Hitherto, most respondents (93.1%) do not use eggshell waste for any value-add product or as a source of economic gain, the 4.6% of respondents who admit to raising revenue from eggshell waste only do so by occasionally collecting stipends from women who collect them in large quantity and process it for washing back of pot. As almost all of eggshell waste generated are simply disposed of without any knowledge or attempt to valorise it (Table 12). According to Table 13, whereas, a substantial percentage of respondents (57.1%) perceive that eggshell waste do not portend any effect; 26.7%, 12.9% and 3.2% respondents believe that eggshell leads to air pollution, flood and disease respectively. This low awareness level among the respondents is largely responsible for the indiscriminate disposal of eggshell waste. Studies of researchers such as Pius-Imue FB, et al. [33] and McAllister J, et al. [36] have established a strong link between indiscriminate dumping of municipal solid wastes and incidences of flood due to clogging of water ways; diseases as a result of contamination ground water by the waste and air pollution as a result of offensive odour and release of particulate matter into the atmosphere.
| Valorisation Use of Eggshell | |||||
|---|---|---|---|---|---|
| Ward | Revenue Generation | Composting | Biogas | Total | |
| Nassarawa | 28 | 0 | 0 | 0 | 28 |
| Sabon Tasha | 22 | 0 | 0 | 0 | 22 |
| Afaka | 18 | 1 | 0 | 0 | 19 |
| Rigasa | 33 | 0 | 0 | 0 | 33 |
| Badarawa | 27 | 2 | 1 | 0 | 30 |
| Maiburiji | 35 | 5 | 1 | 0 | 41 |
| Barnawa | 17 | 0 | 1 | 0 | 17 |
| Tudun Nupawa | 22 | 2 | 1 | 1 | 27 |
| Total | 202 | 10 | 4 | 1 | 217 |
| Percentage | 93.10% | 4.60% | 1.80% | 0.50% | 100.00% |
Table 11: Valorisation Use of Eggshell in Kaduna Metropolis.
| Perceived Effects of Eggshell Waste | |||||
|---|---|---|---|---|---|
| Ward | Air Pollution | Disease | Flood | Total | |
| Nassarawa | 11 | 15 | 2 | 0 | 28 |
| Sabon Tasha | 1 | 20 | 1 | 0 | 22 |
| Afaka | 19 | 0 | 0 | 0 | 19 |
| Rigasa | 7 | 0 | 1 | 25 | 33 |
| Badarawa | 25 | 1 | 2 | 2 | 30 |
| Maiburiji | 30 | 11 | 0 | 0 | 41 |
| Barnawa | 6 | 11 | 0 | 0 | 17 |
| Tudun Nupawa | 25 | 0 | 1 | 1 | 27 |
| Total | 124 | 58 | 7 | 28 | 217 |
| Percentage | 57.10% | 26.70% | 3.20% | 12.90% | 100.00% |
Table 12: Perceived Effects of Eggshell Waste in Kaduna Metropolis.
Conclusion and Recommendations
Effective waste management strategies are essential to mitigate the environmental impact of eggshell waste in Kaduna Metropolis. This research found out that majority of eggshell waste generated in Kaduna metropolis end up in open dumpsite which reflects a poor eggshell waste management practice; hence waste management practice in Kaduna metropolis is generally not satisfactory which is attributed to lack of consistency and poor awareness of its negative impact, inadequate waste collection and transportation. Increased awareness and exploitation of the energy potentials of eggshell waste is needed to encourage better eggshell waste management.
References
-
Obi FO, Ugwuishiwu BO, Nwakaire JN (2016) Agricultural waste concept, generation, utilization and management. Nigerian Journal of Technology 35(4): 958-964.
-
Ike CC, Ezeibe CC, Anijiofor SC, Daud NN (2018) Solid waste management in Nigeria: problems, prospects, and policies. The Journal of Solid Waste Technology and Management 44(2): 163-172.
-
Choudhary R, Koppala S, Swamiappan S (2015) Bioactivity studies of calcium magnesium silicate prepared from eggshell waste by sol-gel combustion synthesis. Journal of Asian Ceramic Societies 3(2): 173- 177.
-
Owuamanam S, Cree D (2020) Progress of bio-calcium carbonate waste eggshell and seashell fillers in polymer composites: a review. Journal of Composites Science 4(2): 70.
-
Faridi H, Arabhosseini A (2018) Application of eggshell wastes as valuable and utilizable products: A review. Research in Agricultural engineering 64(2): 104-114.
-
Waheed M, Yousaf M, Shehzad A, Inam-Ur-Raheem M, Iqbal khan M, et al. (2020) Channeling eggshell waste to valuable and utilizable products: a comprehensive review. Trends in Food Science and Technology 106: 78- 90.
-
Hoornweg D, Tata P (2012) What a waste: a global review of solid waste management.
-
Orhorhoro EK, Oghoghorie O (2019) Review on solid waste generation and management in sub-Saharan Africa: A case study of Nigeria. Journal of Applied Sciences and Environmental Management 23(9): 1729- 1737.
-
Haggar SM (2007) Chapter 5-Sustainability of Municipal Solid Waste Management. Sustainable Industrial Design and Waste Management, pp: 149-196.
-
Babayemi JO, Dauda KT (2009) Evaluation of solid waste generation, categories and disposal options in developing countries: a case study of Nigeria. Journal of Applied Sciences and Environmental Management 13(3).
-
Onibokun AG (1999) Managing the monster: urban waste and governance in Africa. Idrc.
-
Aliu IR, Adeyemi OE, Adebayo A (2014) Municipal household solid waste collection strategies in an African megacity: Analysis of public private partnership performance in Lagos. Waste Management and Research 32(9): 67-78.
-
Bioenergy Consult (2016) Solid waste management in Nigeria.
-
Ogwueleka T (2009) Municipal solid waste characteristics and management in Nigeria. Journal of Environmental Health Science and Engineering, 6(3): 173-180.
-
Abila N (2014) Managing municipal wastes for energy generation in Nigeria. Renewable and Sustainable Energy Reviews 37: 182-190.
-
Wilson DC, Rodic L, Scheinberg A, Velis CA, Alabaster G, et al. (2012) Comparative analysis of solid waste management in 20 cities. Waste management and research 30(3): 237-254.
-
Godfrey L, Ahmed MT, Gebremedhin KG, Katima JH, Oelofse S, et al. (2019) Solid waste management in Africa: Governance failure or development opportunity. Regional development in Africa, Africa, pp: 235.
-
Nwosu AO, Chukwueloka HE (2020) A review of solid waste management strategies in Nigeria. Journal of Environment and Earth science 10(6): 132-143.
-
Food and Agriculture Organization of the United Nations (FAO) (2023) FAOSTAT: Production - Livestock Primary.
-
Wei Z, Xu C, Li B (2009) Application of waste eggshell as low-cost solid catalyst for biodiesel production. Bioresoiurces Technology 100: 2883-2885.
-
Longe EO, Longe OO, Ukpebor EF (2009) People’s perception on household solid waste management in Ojo Local Government Area in Nigeria. Iran J Environ Health Sci Eng 3(6): 201-208.
-
Giwa AH, Babakatun AM (2019) Effect of socio-cultural factors on women entrepreneurship development in Kaduna State. Journal of Human Resource Management 7(3): 57-65.
-
Ajala EO, Ajala MA, Odetoye TE, Aderibigbe FA, Osanyinpeju HO, et al. (2020) Thermal Modification of Chicken eggshell as heterogenous catalyst for palm kernel biodiesel production in an optimization process. Biomass Conversion and Biorefinery (11): 2599-2615.
-
Erchamo YS, Mamo TT, Workneh GA, Mekonnen YS (2021) Improved biodiesel production from waste cooking oil with mixed methanol-ethanol using enhanced eggshell- derived CaO nano catalyst. Scientific Reports 11: 6708.
-
Kohli K, Prajapati R, Shah R, Das M, Sharma BK (2024) Food waste: environmental impact and possible solutions. Sustainable Food Technology 2(1): 70-80.
-
Yusuf S (2015) Kaduna: Physical and Human Environment. Department of Geography Kaduna State University, Kaduna. Shanono printers and Publishers. India.
-
National Population Commission (2006) Nigerian 2006 Census Provisional Results.
-
Kaduna State Government (2022) About Kaduna State.
-
Brinkhoff T (2022) Kaduana State in Nigeria.
-
Usman MB, Sanusi YA, Musa D (2017) Physical and commuting characteristics of selected peri-urban settlements in Kaduna, Kaduna State, Nigeria. Journal of Geography and Regional Planning 10(11): 317-329.
-
Omololu FO, Lawal AS (2013) Population growth and waste management in metropolitan Lagos. The Nigerian Journal of Sociology and Anthropology 11: 83-100.
-
Kearney J (2010) Review. Food consumption trends and drivers. Phil Trans R Soc B 365: 2793-2807.
-
Olukanni DO, Pius-Imue FB, Joseph SO (2020) Public perception of solid waste management practices in Nigeria: Ogun State experience. Recycling 5(2): 8.
-
Adedigba AA (2022) Towards: Integrated Sustainable Solid Waste Management in Nigerian Cities. University of Northumbria at Newcastle, UK.
-
Nabegu AB (2010) An analysis of municipal solid waste in Kano metropolis, Nigeria. Journal of Human Ecology 31(2): 111-119.
-
McAllister J (2015) Factors influencing solid-waste management in the developing world.
-
Onwualu PZ (2011) Enhancing competiveness of the Nigerian Livestock Sub-sector through value addition on the industry. Anyigba, Kogi State, Nigeria, pp: 1.
- Electronic Waste Management in the Top Ten Economies in the World: A Critical Review on Waste Generation, Regulations, Collection, Recycling and Environmental Challenges
- Some Challenging Transdisciplinary Aspects of the Sustainable Waste Management in the Permacrisis Context
- Use of Mobile Autonomous Systems for Pollution Control of Inland Water Bodies
- Environmental Impact Perspective Sustainable Online Textile Retailing: Harnessing Augmented Reality-Based Digital Twins in Bangladesh
- Composite Treatment Module for Removing Acidity and Metal (Loid)S from Acid Rock Drainage
- Household E-Waste Management Systems [E-Wms] in Malaysia