Experimental Study on the Process of eMSAGP
While SAGD (Steam Assisted Gravity Drainage) has been successfully deployed in recovering heavy oil/oil sand reservoirs, it suffered from low OSR (Oil-Steam-Rate) and chamber growth rate in producing super heavy oil. The SAGP technology is to inject Non-Condensable Gas (NCG) into the reservoir with steam in the SAGD process. By partial pressure effect of NCG, SAGP reduces the heat loss to overburden, thus greatly increasing OSR and reducing the demand for steam. However, it still faces the challenge of uneconomic oil rate. Introducing infill well and operating it in flooding manner, enhanced Modified Steam Assisted Gas Push (eMSAGP) can significantly speed up the growth of steam chamber and improve oil production. This work presented the physical simulation results of eMSAGP and evaluated the feasibility of its application in super heavy oil reservoir
Introduction
According to the International Energy Agency (IEA), world oil demand [1] may peak in the late 2020s. In 2017, China’s crude oil, refined oil and liquefied petroleum gas import dependence was as high as 72.3% [2]. Increased exploration costs had raised interest in a large number of heavy oil deposits. High oil viscosity in such reservoirs lead to poor performance [3]. Many EOR (enhance oil recovery) methods had been applied in heavy oil recovery. According to the statistics [4], about 3% of global production currently came from EOR.
The most widely used EOR methods was steam assisted gravity drainage (SAGD). The basic idea [5] was to form a steam chamber inside the reservoir. Then heated bitumen drained along the edge of the steam chamber by gravity. However, severe heat loss [6], low oil to steam ratio (OSR), and poor economic benefit were the main concerns. In conventional SAGD, a large amount of steam was required to heat the reservoir around the steam chamber and the overburden. High-quality, thick reservoirs had steam-oil- rate of about 2.5 to 3 [7], but steam-oil-rate was higher and processes were less economical in thinner reservoirs with lower oil saturation. High temperature in the upper part of the chamber resulted in heat loss [7]. Increasing the thermal efficiency of the SAGD process was a major pursuit of many researchers. Among these efforts, co- injecting NCG (Non- Condensable Gas) was proposed and its name was SAGP (Steam and Gas Push) or NCG SAGD. This process involved the addition of small amounts of NCG such as methane, CO2 and flue gas to the steam. The density of NCG was lower than steam, which could accumulate in the upper part of the steam chamber to lower the temperature [8]. At the same time, the heat loss to overburden was reduced. Thus, the demand for steam was greatly reduced [7, 9, 10, 11] and higher OSR could be achieved. Even if the steam chamber temperature was below the saturated steam temperature, the rising gas fingers [12, 13, 14] would push the oil to move. In addition, N2 dissolved in crude oil could reduce the viscosity of the crude oil and improved the flow ability of the crude oil [15, 16]. To sum up, SAGP had met the challenge of high energy consumption in traditional SAGD development. This method had wide applications today. In the second stage of the UTF (Underground Test Facility, in Fort McMurray, northern Alberta, Canada), SAGP test was performed. In 1999, methane gas was added to the three steam injection wells in the pilot test. When the OSR was greatly improved, the steam was stopped in 2001 and used flue gas (the composition was about 82% N2 and 16% CO2) instead. These wells had been produced for nearly two years after the injection of pure flue gas. They were still in production and the cumulative recovery factor had exceeded 70% [17]. SAGP tests were also carried out in both Bohai Oilfield [18] and Liaohe Oilfield [19]. The results showed that the addition of NCG to the steam was a viable method to maintain the expansion of the mature SAGD steam chamber. A better oil production rate and OSR were obtained, which saved large amount of steam. However, SAGP still faced the challenge of uneconomic oil rate in recovering super heavy oil reservoir [20]. What’s more, Qiao Liang, et al. found high residual oil saturation between the oil wells by numerical simulation [21]. Infill well was then proposed to enhance oil recovery. Ching H Wu studied two sets of West Texas carbonate reservoirs and water flooding data to assess the impact of infill well on water flood recovery [22]. By reducing the well spacing, infill wells helped producing oil from those untouched area by convential well pattern [21, 23]. By optimizing the infill well, the recoverable reserves had increased by 3682.73×104t [24] in Karamay Oilfield. The infill well technology had a positive effect on the Chang 8 oil layer in the G271 area of Jiyu Oilfield too. After well pattern optimization, the oil recovery rate and recovery factor were effectively improved [21]. Recently, a new concept, integrating the merits of SAGD, NCG and infill well, was developed, which gave birth to a new thermal technology eMSAGP (enhanced modified steam assisted gas push). On one hand, injecting NCG to the top of the steam chamber could reduce heat loss, increase OSR and the thermal efficiency and maintain the pressure of the steam chamber. On the other hand, introducing infill well could reduce residual oil saturation, extend sweeping area. eMSAGP had been deployed at MEG’s commercial projects. MEG claimed increased production was achieved without increasing steam generation capacity. They reported current OSR of 0.76.
The performance of SAGD trial in a typical super heavy oil reservoir in Xinjiang oilfield was under the expectation. Uneconomic oil rate and extremely low OSR was observed. Considering the challenge connected with the super viscous oil, eMSAGP would be the key to unlock tremendous reservoir of this kind worldwide. This paper presented the results of eMSAGP experiment. The physical model was designed according to the target formation in Xinjiang oilfield. It start with a dual well pairs SAGD operation, followed by NCG SAGD (N2 co-injected with steam, or SAGP), eMSAGP (infill well involved). The performance was analyzed to evaluate the feasibility of its application in super heavy oil reservoir.
Methodology
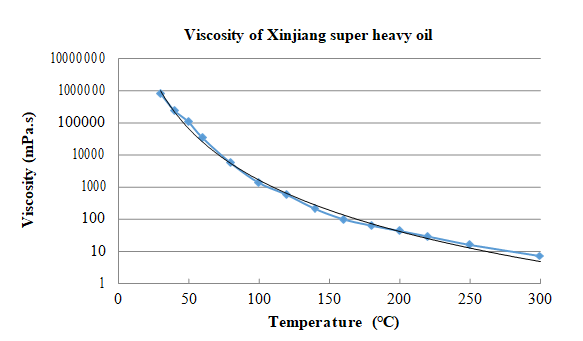
This study concerned a typical type 3 formation in Xinjiang, which was a super heavy oil reservoir. The oil relation between viscosity and temperature was showed in Figure 1. By investigating oilfield data and experimental methods, a 2D physical simulation was proposed. In order to represent the physical process happening in the oilfield reasonably, the geometry of the 2D model and experimental scheme was designed carefully according to scaling theory of steam injection process.
Scaling Consideration
The target formation was a shallow oil reservoir. As was shown in Table 1, shift distance of well pairs was 100 m and reservoir thickness was 25.4 m. The scaling parameters and their value for model and field were listed in Table 1.
| Model | Field | Ratio(model/field) | |
|---|---|---|---|
| Thickness (m) | 0.254 | 25.4 | 100 |
| Horizontal well length (m) | 0.04 | 4 | 100 |
| Well pairs shift distance (m) | 1 | 100 | 100 |
| Permeability (D) | 200 | 2 | 0.01 |
| Porosity (%) | 34 | 33 | 1 |
| Initial oil saturation (%) | 98 | 88 | ≈1 |
| Oil viscosity (mPa·s, 50℃) | 106600 | 106600 | 1 |
| Oil density (kg/m3, 50℃) | 970 | 970 | 1 |
| Operating temperature (℃) | 250 | 250 | 1 |
| Operating pressure (MPa) | 4 | 4 | 1 |
| Steam rate (ml/min) | 10 | 1000 | 100 |
Table 1: scaling parameters and their value for model and field.
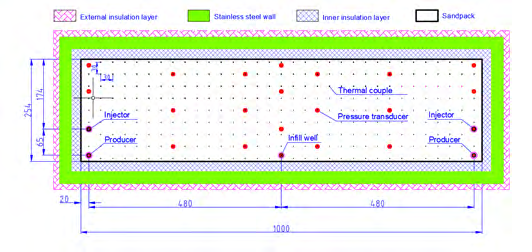
The physical model was manufactured to better duplicate the relationship between gravity and flow resistance as shown in Figure 2. The ratio of thickness to well pair shift distance in reservoir and model was strictly the same. In order to make the experimental results more reliable, the porosity of the sand pack should be as close as possible to the reservoir conditions while permeability was scaled up according to the scaling ratio.
2D Model design
Obtaining accurate temperature and pressure had a crucial influence on the experimental results. Hence, it was important to ensure the insulation and sealing of the model. Totally 297 thermal couples were distributed evenly inside the model to measure temperature at scattered points. Pressure transducers were installed to measure pressure of 24 positions in the model as shown in Figure 2. Two SAGD well pairs were placed at each side of the model. One infill well was put in the middle of two SAGD well pairs. To enhance the heat insulation effect of the model, the insulation materials and its thickness outside the model were specially designed. The outer side of the sandpack was the inner insulation layer, the outer side of inner insulation layer was the stainless- steel wall, and the outer side of the stainless-steel wall was the external insulation layer. In addition, N2 was injected into the high pressure vessel, which host the model and provide the confining pressure. All these efforts were made to ensure better insulation.
Physical Simulation System
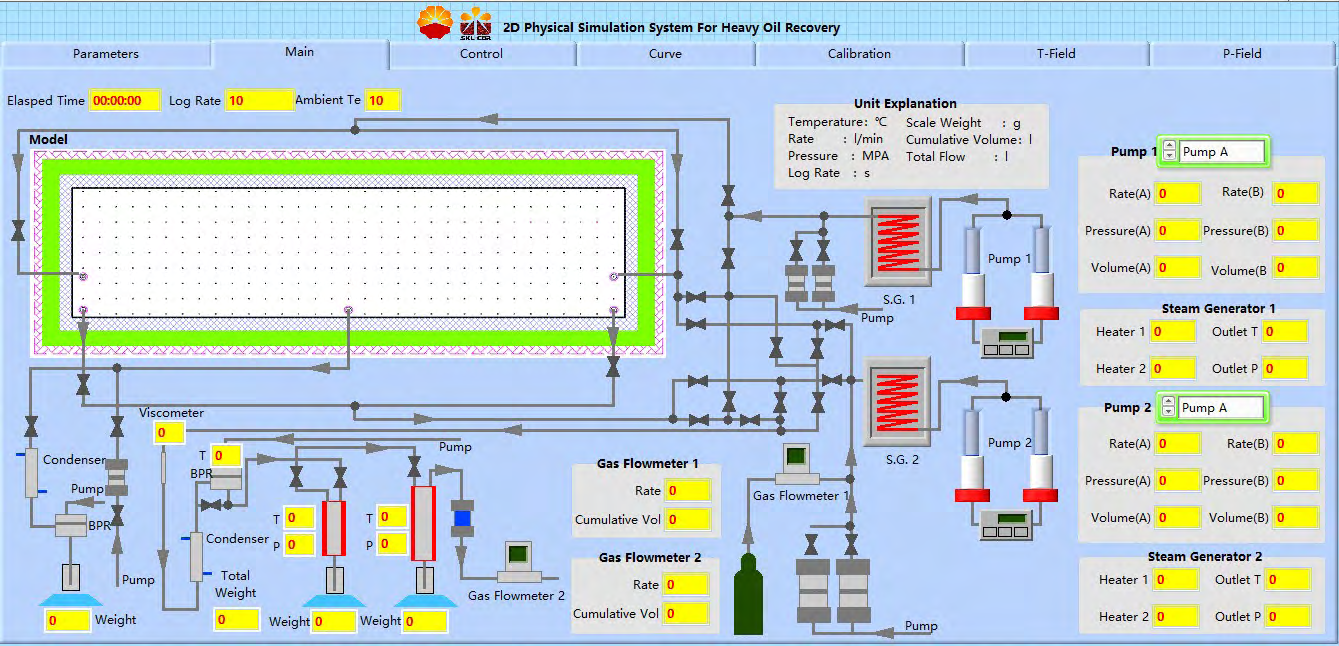
Flow chart of eMSAGP experiment was shown in Figure 3. This physical simulation system consisted of model, injection system, production station and data acquisition system. The injection system consisted of two steam generators, two ISCO pumps, gas injection station, solvent injection station. The pump injected distilled water into the steam generator, which generated superheated steam at 250℃ and then injected into the model. The gas injection station included a gas cylinder, a gas flow meter, and the solvent injection station includes a pump and a piston container. The production station included a condenser, a back pressure regulator, a buffer tank, beakers, scales, a dryer and a gas flow meter. Produced fluid from SAGD production well was allowed to go through the back pressure regulator after being cooled by the condenser which would reduce the temperature of the produced fluid to below
100 degrees. Then it entered the buffer tank for secondary cooling. Finally, the produced fluid was separated into liquid and gas and metered independently. Data acquisition system was developed by Lab view software to control and collect data from devices like ISCO pumps, scales, flow meters, thermal couples, pressure transducers, viscometers.
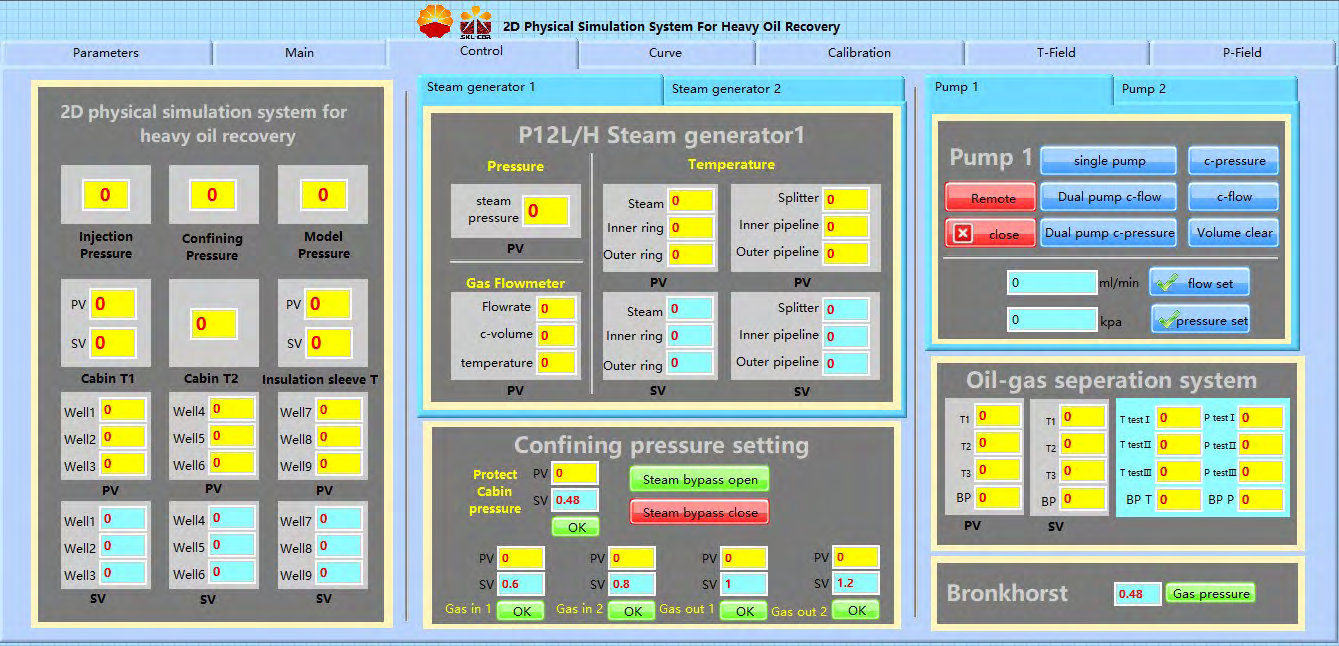
To fulfill the study purpose, the model confining pressure, insulation sleeve, steam generator, pump, and gas flow controller could be operated by software during the experiment. The control interface to set values for these devices was shown in Figure 4. It consisted of control cabinet panel, steam generator control panel, visual model confining pressure setting panel, pump control panel, oil and gas separation system, gas pressure setting and gas flow control panel. The control cabinet part had two functions. On the one hand, it collected the model injection pressure, confining pressure and insulation sleeve pressure. On the other hand, it controlled the temperature of 9 well groups and the temperature of the heating jacket. The steam generator section had two functions too. For one thing, the steam status was monitored by three pressure transducers and one thermal couple located at the outlet of steam generator. For the other thing, the temperature of the internal coil of steam generator was controlled so that the steam generator could generate the superheated steam required for the experiment. Since the experiment was carried out under high temperature and high pressure conditions, the visual model confining pressure was set. The model confining pressure was controlled by controlling the amount of N2 in and out. The pressure of this model experiment was about 4 MPa, thus the model confining pressure was controlled around 5MPa. Through the control interface, the single pump and dual pump mode of the pump could be selected. In addition, the constant pressure or constant flow rate mode could be chosen. The oil-water separation system had two functions. It controlled the pressure of the three buffer tanks and the pressure of the back pressure regulator. Besides, it record the temperature of the three buffer tanks. The gas flow controller was used to control the gas rate.
Operating Procedure
The Steps for a whole experiment was shown in Figure 5, which including the experimental preparation process, the experimental operation process, and after experiment work. Sand particle size was determined according to permeability given by the scaling theory as showed in Table 1. After packing sand and sealing the model, porosity and permeability were calculated. Oil saturation and aging were then carried out to represent the initial reservoir condition. After the experiment was completed, the produced fluid was separated and data collected was analyzed.
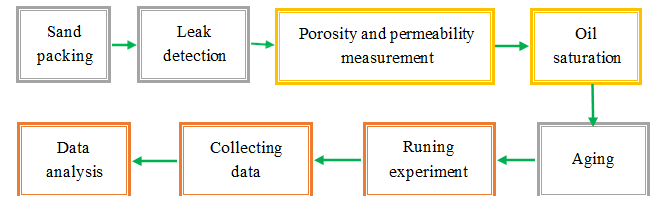
Sand packing was the first step of the whole experiment. It was done under drained condition to pack sand tightly. Following that was leak detection. Water was injected into the model to make the internal pressure of the model reach 1 MPa. Then closed the inlet and outlet valves. After a period of time, observed the internal pressure change of the model. If the pressure difference was within the allowable range, the model could be in compliance with the requirements. By analogy, from 1 MPa to 4 MPa, the internal pressure of the model was gradually increased, and the confining pressure was always maintained within a range of 1 MPa higher than the internal pressure. If all pressure changes were minor, there was no leak issue. Porosity and permeability could be determined by sand packing. Porosity could be computed after three steps. First, record the size of the model and the number of meshes of the sand. Second, measure the mass of quartz sand, the total volume of sand pack and the density of quartz sand after sand packing. Third, the model porosity was finally obtained according to the volumetric formula. In order to get a more accurate permeability, the water permeability test was done. The water was continuously injected into one the model, and the pressure changes inside the model at the same height were recorded. After the pressure was stabilized, the pressure difference was obtained, and the permeability was computed by the Darcy’s law. The oil saturation was carried out at temperature of 90℃ and atmospheric pressure.
The Operating procedures of running eMSAGP experiment were shown in Figure 6. In the early stage, steam was injected in the same way as SAGD. As steam chamber became mature, N2 was co-injected to fulfill NCG SAGD process. The co-injection of N2 and steam into the oil layer simultaneously in a certain ratio had the advantage that the pressure fluctuation range was small, and the oil well productivity characteristics were relatively stable [20]. Later, an effort was made to establish the communication between infill well and two steam chambers. Once it was done, the infill was put into production and the process of eMSAGP was initiated. During wind down phase, steaming was ceased and N2 injection was continued until negligible oil production was observed. At the end of the experiment, fluid sampling and experimental data analysis were implemented.
One more thing need to mention was that, T-separator with same distance from steam generator to two well pairs and from two well pairs to production station was desired to simulate the field condition.
![Figure 6: In the early stage, steam was injected in the same way as SAGD. As steam chamber became mature, N2 was co-injected to fulfill NCG SAGD process. The co-injection of N2 and steam into the oil layer simultaneously in a certain ratio had the advantage that the pressure fluctuation range was small, and the oil well productivity characteristics were relatively stable [20]. Later, an effort was made to establish the communication between infill well and two steam chambers. Once it was done, the infill was put into production and the process of eMSAGP was initiated. During wind down phase, steaming was ceased and N2 injection was continued until negligible oil production was observed. At the end of the experiment, fluid sampling and experimental data analysis were implemented.](/fulltextimages/6806/fig_6.png)
Results and Analysis
The performance of eMSAGP process, in terms of steam chamber development, oil production rate, cumulative oil- steam ratio (cOSR), oil recovery and residual oil distribution, was investigated in this section.
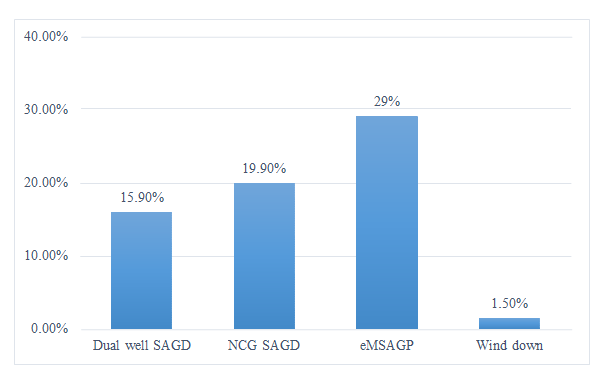
As mentioned in last section, the experiment was conducted sequentially. It started with dual well pair SAGD for 442 minutes, then NCG SAGD for 456 minutes, followed by eMSAGP for 636 minutes and Wind-down for 30 minutes. The whole experiment lasted for about 26 hours. The recovery factor at each stage was 15.9 OOIP%, 19.9 OOIP%, 29.1 OOIP% and 1.5 OOIP% as shown in Figure 7.
Analysis of Steam Chamber Development
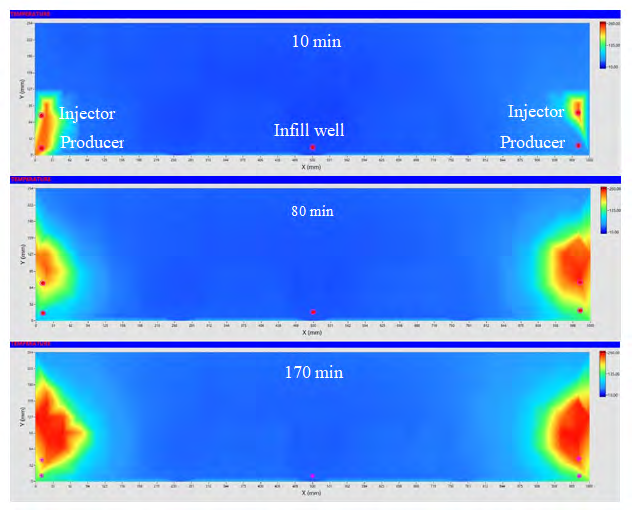
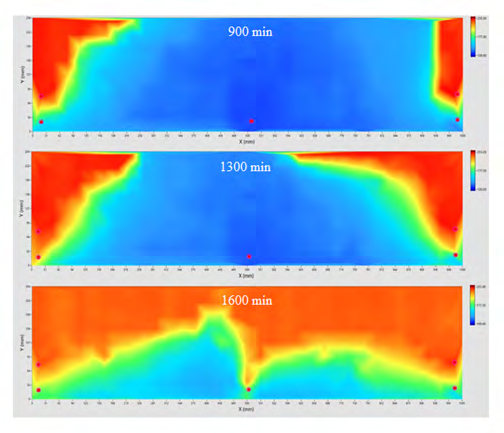
Temperature field, showing the development of the steam chamber, was produced by interpolation of readings from scattered thermal couples. Initially, the experiment was run in dual well pairs SAGD pattern (Figure 8). The steam chamber pressure was controlled by adjusting injecting and producing valve of each well pair. Many efforts were made to obtain close growth rate of steam chamber for both well pairs in this experiment. However, we found the chamber with lower operating pressure tended to intake more high- quality steam and spread faster than the other one. The steam chambers developed quite slowly since the experiment was run for about 170 minutes. Any attempt to increase steam rate would result in steam coning. Obviously, the small volume of the steam chambers and unstable back pressure should be responsible for this slow development. At 442 minute, N2 was co-injected with steam and the experiment came to NCG SAGD phase. As the concentration of N2 was very low, the saturation temperature of steam was reduced by about 1 ℃. Similar temperature field evolution as in the previous phase was observed in the next 450 minutes. Steam rate as well as N2 rate had to be carefully controlled during this phase to avoid producing live steam and gas. When both steam chamber had been confirmed to spread sufficiently in horizontal direction, hexane was injected to the infill well for about 3 minutes to establish the communication between infill well and two mature steam chamber. After the communication between chamber and infill well was established, the infill well was put into production. The experiment came to eMSAGP phase (Figure 9), in which N2 and steam were co-injected into injection well while infill well and SAGD production wells were used to produce oil. Two producers were all operated under constant pressure. The area near the wellbore was kept seriously in subcooled condition. Due to the additional production from infill well, live steam was barely seen in these two producers even with significantly increased steam rate. Besides, the complexity for operating the producing valves became quite low in this phase. The steam chamber at right hand side used to tend to shrink after steam coning. The growth rate of this chamber was quite smaller compared to its composite chamber as the temperature field obtained at 900 minutes showed in Figure 9. As times went by, the volume of this chamber ever grew larger compared to the one at the left hand side as the temperature field obtained at 1300 minutes showed in Figure 9. In contrast, Infill well was operated with high flexibility.
Once steam in steam chamber was found to approach any producer, the infill well would be turned on to produce more fluid in short time, which in turn would lower down the chamber pressure and prevent steam coning. In this effort, the steam chamber growth was found to speed up significantly. However, the infill well would not be online all the time as there was no reliable measure to provide back pressure control. In addition, there was a concern that steam coning would happen under high production rate which would harm the performance largely.
Due to the feature of overriding of steam, steam chamber prefer to grow upward and latterly spread when it touched the caprock. However, Operating the SAGD producers and the infill well simultaneously reconstructed the production characteristics as well as the chamber development mode. Gravity drainage and pressure difference induced flooding functioned together very well. To some degree, the latter played the major role in producing oil. As the infill well located at the bottom of the model, the steam chamber was able to decline and largely improved the volume of swept zone. This behavior made eMSAGP possible to recover the hot oil remained between well pairs, where traditionally left behind by classical SAGD operation. When the experiment run to about 1600 min, the steam chamber had already descend to the infill well. The temperature of the path between the steam chamber and the infill well quickly rise due to the trend of steam coning. Severe flashing occurred in produced fluid from infill well made the condensing system overloaded. A little fraction of water failed to be collected in this short period. In addition, oil production from infill well was observed to be low as most produced fluid was water and steam. Therefore, we decided to cease eMSAGP operation by then. After that, the experiment came to the wind down phase. Steaming was ceased while N2 injection was continued to produce more oil. In the meantime, the infill well was shut down and two SAGD producers were operated in pressure decay mode. Both NCG flooding and hot water flash in place contributed to the oil production in this phase. At 1560 minute, we put the end to the experiment due to uneconomic oil rate.
Analysis of Production Performance
Recovery efficiency of this process was determined by analyzing oil rate, cOSR and recovery factor in different stage. The rate and volume of steam and N2 injection would be obtained by readings of ISCO pumps and gas flow controller.
After the experiment was completed, the produced emulsion in dozens of beakers were send to do Dean-Stark analysis. Weight of oil and water in each beaker was calculated then. From these post experimental analysis, the oil rate, water cut, instant OSR and cumulative OSR, recovery factor would be derived.
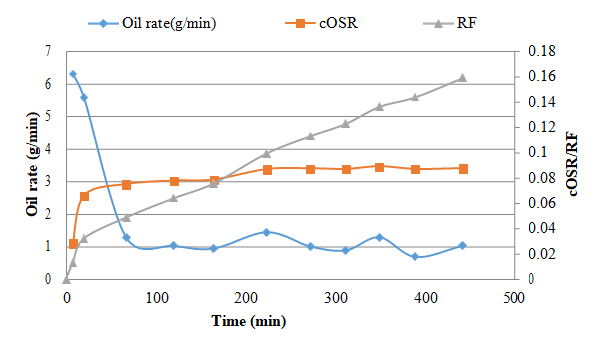
Figure 10 showed the performances of dual well pairs SAGD in this experiment. It could be seen from the figure that the dual well pairs SAGD phase lasted for 442 minutes. The startup of SAGD was done by solvent injection and soaking. This involved hexane injection to each well to establish the communication between SAGD injector and producer at both sides. Once the pressure response of one well to the other in the same well pair was determined to be strong enough, steaming would start and the well pair came to the normal SAGD operation. As we could see, the initial oil rate reached peak of 6.3 g/min. This mainly due to the viscosity reduction of hexane injection. Lots of cold but dilated oil around well pair was pushed towards the producer by injected steam in a short period. However, it could not maintain for a while and oil rate dropped rapidly. The average oil rate was 1.29 g/ min only in this phase. Low oil rate followed startup could be explained by the development of the steam chamber during this phase. The struggle of steam chamber growth would be seen clearly in Figure 1. There were two reasons behind. As the chamber was in its infancy, any fluctuation of back pressure caused significant influence on the oil production process and steam chamber growth. Due to the feature of super heavy oil, the regular back pressure regulator would not work well. Once viscous produced fluid plugged the outlet, the back pressure would build up. After a while, the pressure was so high that it pushed the accumulated fluid through the outlet all in a once which led to pressure relief all of a sudden. We gave up the regular back pressure regulator and used a high temperature needle valve instead to control the production manually. This effort improved the stability of back pressure a lot but could not eliminate the pressure fluctuation throughly. Besides, there was a huge challenge in operating two SAGD well pair to grow two independent chamber with comparable size, which was the objective of this experiment. Actually, any pressure difference between these two steam chambers led to more steam intake to the lower pressure chamber. We have to adjust the pressure of these well pairs from time to time. This made it hard to produce more oil. The poor performance of dual well SAGD operation could be illustrated by the cumulative OSR too. cOSR in this phase was found to be less than 0.1. Extremely high viscosity of this oil should be the main reason. The pilot test in the field also found the similar low cOSR. Another factor would be the high operating temperature, which made the steam carried less latent heat. Therefore, more steam was required to heat certain volume of super heavy oil. In addition, the live steam production would be part of the reason. As we struggled to develop two steam chambers simultaneously, the subcool for certain steam chamber was out of control occasionally. One more ingredient for low cOSR could be the heat loss to the boundary of the model. As two well pairs located at the side of the model, the contact area of steam chamber to the model surface was increasing with time, so the heat loss in this configuration was non-ignorable. When the growth rate of steam chambers and the oil rate was uneconomic, the calculated recovery factor for this phase was 15.9% and dual well pairs SAGD experiment came to the end.
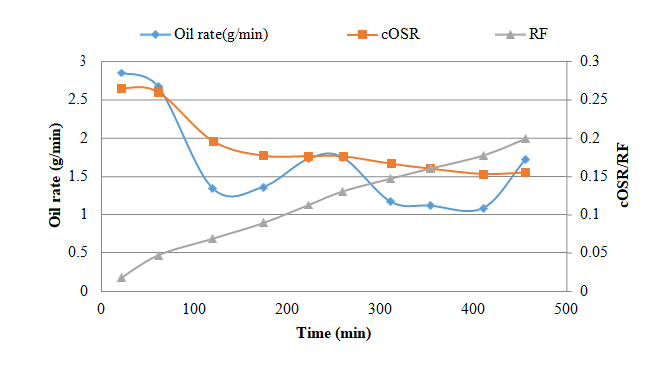
When N2 was co-injected with steam, the experiment translated to NCG SAGD pattern. Figure 11 showed the performances of NCG SAGD in this experiment. The NCG SAGD phase lasted for 456 minutes with a yield of 19.9%. Overall, the performance was better than that in SAGD phase in terms of oil rate and cOSR. The oil rate peaked after the N2 co-injection and reached 2.84 g/min. Initially, the injection of N2 help stimulate oil production from upper part of the model and led to the peak oil rate in this phase. It then decreased as we expected. Theoretically, N2 was not a good agent for helping oil production because it was not effective heat carrier nor diluent. The average oil rate in this phase was 1.67 g/min, which was higher compared to that in SAGD phase. This was due to the laterally spreading of the steam chamber. N2 might had played an important role in speeding up the growth of steam chamber. In addition, the overall OSR was higher than the dual well SAGD process too. As we could see, with the co-injection of NCG, the OSR rose first and declined after that. Main reason behind should be attributed to non-condensable feature of N2. As steam condensed at the upper and side boundary of the model, N2 concentrated near these areas where suffered from severe heat loss. The tendency of N2 gathering reduced the temperature and the heat loss to the model surface.
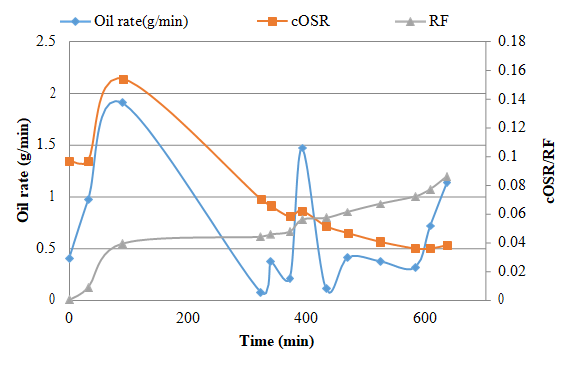
The eMSAGP phase lasted for 636 minutes. Figure 12 & Figure 13 showed the performances of SAGD well pairs and infill well in eMSAGP phase correspondingly. It could be seen from Figure 12 that the yield from SAGD well pairs was 8.6% and the average oil rate was 0.67g/min. It also showed that cOSR rose first and then fell, and the overall trend was downward. It need to mention that, the cOSR in this phase was calculated by the ratio of cumulative oil production from two SAGD producers to cumulative steam injection to two SAGD injectors. The reason for the decrease in cOSR was mainly because most oil was preferred to be produced by infill well, which located at the bottom and operated under flooding mode. Another reason may related to increased heat loss resulting from fast expanding steam chamber in this phase. Oil rate data followed the similar tendency. The oil rate increased suddenly in the mid of this phase. This was due to the shutdown of the infill well for a short period. After turn on the infill well, the oil rate from both SAGD producers fell back soon. The overall rate was low compared to that in SAGD and NCG SAGD phase.
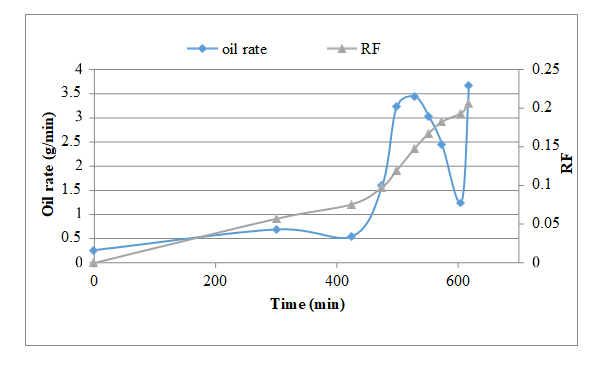
When the infill well was turned on to participate in the experiment, the oil production rate from this well alone was up to 3.5 ml/min with an average of 2.2 ml/min in the whole eMSAGP phase (Figure 13). Recovery from infill well was 20.5% in this process. The infill well performance data showed that the oil rate declined slightly in the early period. This could be the result as diluted heavy oil was gradually produced. It then increased rapidly as warm emulsion flowed into the infill well under high pressure difference. With more hot fluid being produced, the temperature of the flow path between the steam chamber and the infill well went up gradually. When running for about 500 minutes, there was evidence of steam coning. Water cut was found to increase sharply and the temperature around the infill well climbed to close to saturation temperature. So the production of infill well was carefully controlled to avoid producing live steam. Therefore, Oil rate dropped rapidly at this point. It rose again as we increase the production from the infill well.
Analysis of Residual Oil Distribution
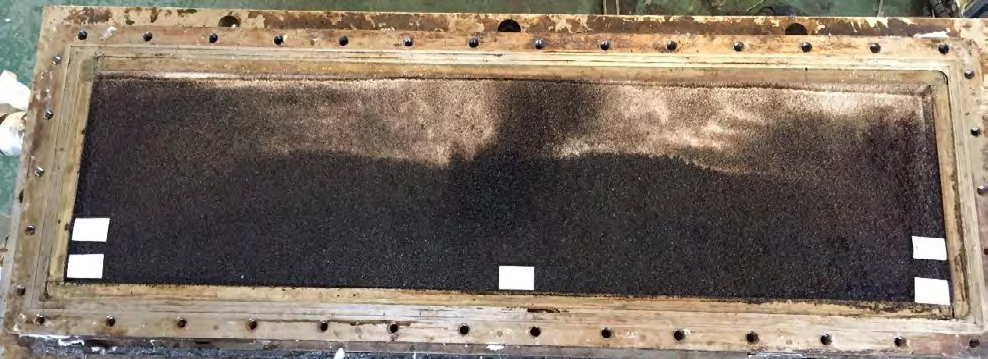
$$ \mathrm {S} _ {\mathrm {o r}} = 0. 4 3 \left(\frac {\mathrm {V} _ {\mathrm {s}} \mathrm {f h}}{\mathrm {k g t}}\right) ^ {0. 4} $$ (1) After wind down operation, the model was turned from vertical into horizontal position to prevent fluid flow under gravity. Then the high pressure vessel was disassembled to take model out. After cooling the model in the atmosphere for 1 hour, the cover plate was removed to investigate the residual oil distribution. Figure 14 was the picture displaying the surface of the sandpack right after the experiment. The residual oil distribution inside the steam chambers on both sides was similar, indicating eMSAGP overcame the uneven development of adjacent steam chambers, which was common in field operation. Besides, no flow channels were identified near the infill well. The surface oil saturation represented by the color of the sandpack was generally in accordance with the temperature field. Obviously, the residual oil saturation decreased with height as the gravity drainage theory predicted. We still noticed several important difference there. First, the sandpack at the side of the model had high oil saturation. According to equation 1, the residual oil saturation should be the function of steaming time, height, porosity, permeability, oil saturation and gravity. In this situation, it could be mainly attributed to the boundary effect. Another difference existed between the steam chamber and the infill well. The temperature field demonstrated that the junction of the two steam chambers sank significantly. The temperature of this area was close to the saturated steam temperature. While the color indicated this area was with high residual oil saturation. This could be explained by the short steaming time in this area as the steam appeared in this area for only a short time. In most of the experimental time, the temperature of fluid in this area was much below the saturated steam temperature due to the subcool control strategy of infill well operation. The part near the bottom of the model was in the initial oil saturation condition. It was in deep dark and would be used as benchmark. Considering how viscous this heavy oil is, it was surprise to see the color of the sand in the zone occupied by steam chamber was almost white. It was quite clear that the residual oil saturation in this well drained area was extremely low. The color of the lower part of the model is grey to dark, which meant the residual oil saturation in this area was relatively high.
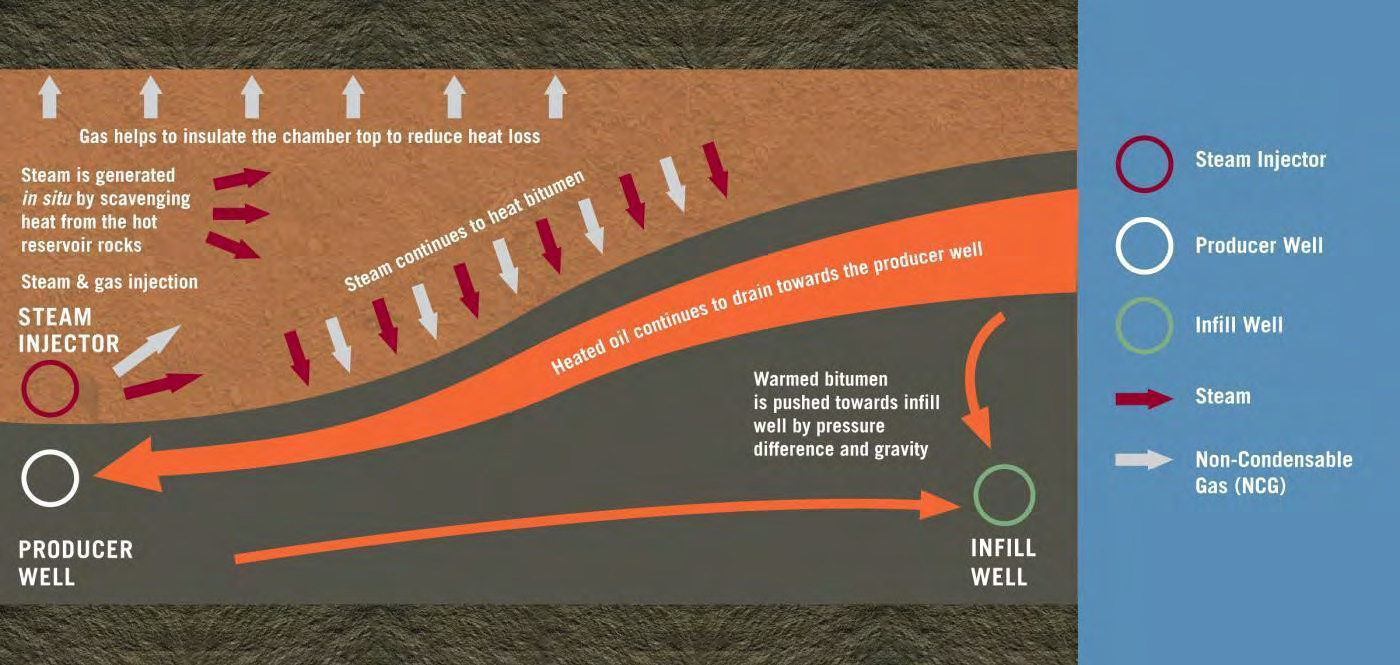
Figure 15 showed the mechanism of eMSAGP process. One element played an important role in this process was co- injected N2, which was non-condensable and tend to gather around the top of the steam chamber. The concentration of N2 built up as it approach to the bottom of the caprock. This lower the saturation temperature of steam by partial pressure effect. The behavior of non-condensable gas largely reduced the temperature near the caprock and hence decreased heat loss to overburden. The presence of NCG in the core of the steam chamber would cause temperature drop for the same reason. This resulted in hot water in the core of the steam chamber to flash. Steam then carried energy from the core to the front of the steam chamber. Due to the energy recovery effect of NCG, the energy efficiency was improved further. In addition, non-condensable gas had high capacity of fingering which might break the stability of oil-water interface in place and stimulate the emulsion production and advance of steam front. It helped the steam chamber to spread latterly too [19, 25]. The second element need to mention is the infill well, which reshaped the gravity drainage dominated process. Coordinating SAGD producers and infill well actually made eMSAGP a drainage-flooding nexus process. Gravity drainage promised high recovery factor but left a wedge-shaped zone untouched. Introducing infill well and operating it at lower pressure led to high pressure difference. This flooding force was capable of recovering untouched oil in wedge- shaped zone. Infill well operation could be independent on SAGD well pairs, which provided great operating flexibility for the oil operators. They did not have to worry the live steam production as they tried aggressive steaming strategy because the infill well would help produce more fluid from the chamber and maintain the balance of injection and production in short period. High steam rate and steam chamber growth rate would be expected with the assistance of infill well. What’s more, producing from the infill well caused downward flooding. It compromised the drawback of overriding trend of steam and speed up descending of steam chamber, which in turn increased the volume of the steam chamber. As steam chamber move towards the infill well, the temperature near the wedge-shaped area of the oil formation would be effectively improved. Meanwhile, the infill well largely shortened the flow path of heavy oil from the wedge shaped area to the producer. Therefore, high swept efficiency would be achieved.
Conclusion
- Introducing infill well and operating it in flooding manner, eMSAGP overcame the uneven development of adjacent steam chambers, which was commonly faced in field operation. Infill well production in eMSAGP shortened the distance from warm bitumen front to producer, expanded the swept volume and reduced residual oil saturation.
- N2 co-injection in eMSAGP helped reduce heat loss, oil viscosity, maintain steam chamber pressure, improve flow ratio, increase cumulative OSR, save steam, and promote energy recovery from the core of steam chamber. The fingering of the N2 helped advance the steam front.
- eMSAGP largely improved the potential of uplifting steam rate without steam coning. eMSAGP was superior to SAGD in terms of improving oil rate, saving steam consumption, expanding swept volume as well as increasing recovery. Most importantly, eMSAGP make it possible to recover super heavy oil.
- eMSAGP technology was one promising solution to unlock tremendous super heavy oil reserve.
The issues with applying eMSAGP technology included reasonable well pattern density, N2 injection time, N2 injection volume, and ratio of N2 to steam.
References
-
Donnelly J (2017) Comments: Peak Demand or Too Much Oil? Journal of Petroleum Engineers 69(5): 12.
-
Chunrong T (2018) Analysis of China’s oil import and export status in 2017. International oil economy 26(3): 10.
-
Szasz SE, Thomas GW (1965) Principles of Heavy Oil Recovery. J Can Pet Technol 4(4): 188-195.
-
Taber JJ, Martin FD, Seright RS (1997) EOR Screening Criteria Revisited-Part 1: Introduction to Screening Criteria and Enhanced Recovery Field Projects. SPE Res Eng 12(3): 189-198.
-
Dongqi J, Sheng Y, Zhong H, Mingzhe D, Zhangxin C, et al. (2016) Re-Examination of Fingering in SAGD and ES-SAGD. SPE Canada Heavy Oil Technical Conference, Calgary, Alberta, Canada.
-
Ezeuko CC, Wang J, Gates ID (2012) Investigation of Emulsion Flow in SAGD and ES-SAGD. The SPE Heavy Oil Conference Canada, Calgary, Alberta, Canada.
-
Butler RM (1997) Steam and Gas Push (SAGP). Annual Technical Meeting, Calgary, Alberta.
-
Jian L (2016) Ultra-rich oil sandstone oil SAGD parametric optimization and SAGP design. Southwest Petroleum University, China.
-
Chung S, Kang JM, Park C (2013) Sensitivity Analysis on Steam and Gas Push to Reduce Heat Loss in to the Top Water-Bearing Area Overlaying Oil Sands. The Twenty- third International Offshore and Polar Engineering Conference, Anchorage, Alaska.
-
Jing Y, Wang J, Ezeuko CC, Gates ID (2012) Energy (Heat) Distribution and Transformation in the SAGP Process, SPE Heavy Oil Conference Canada, Calgary, Alberta, Canada.
-
Luan Y, Liu B, Hao P, Zhan K, Liu J (2020) Oil displacement by supercritical CO2 in a water cut dead-end pore: Molecular dynamics simulation. Journal of Petroleum Science and Engineering 188: 106899.
-
Butler RM, Jiang Q, Yee CT (1999) Steam And Gas Push (SAGP)-3; Recent Theoretical Developments and Laboratory Results. Annual Technical Meeting, Calgary, Alberta.
-
Butler RM, Jiang Q, Yee CT (2001) Steam and Gas Push (SAGP)-4; Recent Theoretical Developments and Laboratory Results Using Layered Models. J Can Pet Technol 40(1): 8.
-
Jiang Q, Butler RM, Yee CT (1998) The Steam And Gas Push (SAGP)-2: Mechanism Analysis and Physical Model Testing. J Can Pet Technol 39(4): 10.
-
Yongrong G, Shangqi L, Dehuang S, Erpeng G (2009) Optimization of nitrogen assisted SAGD mining technology. Acta Petrolei Sinica 30(5): 717-721.
-
Mingbo Z (2014) Research on SAGP Technology Development for Super Heavy Oil in Guantao Reservoir of Block Du84. Northeast Petroleum University, China.
-
Xiaobo Z, Xuenan Z, Dejun T, Minghui M (2010) Research on SAGD adding non-condensate gas technology. Journal of Southwest Petroleum University 32(2): 113-117.
-
Yubao S, Liguo Z, Jirui H, Yongtao S, Haitao L, et al. (2013) Case Study: Thermal Enhance Bohai Offshore Heavy Oil Recovery by Co-stimulation of Steam and Gases. The SPE Heavy Oil Conference-Canada, Calgary, Alberta, Canada.
-
Yongrong G, Shangqi L (2008) Improving Oil Recovery by Adding N2 in SAGD Process for Super-heavy Crude Reservoir with Top-Water. The SPE Russian Oil and Gas Technical Conference and Exhibition, Moscow, Russia.
-
Xin X, Lixin W, Weiwei W, Hong Z, Siyao L (2015) Nitrogen Injection Improves SAGD Development Effect (SAGP) Mechanism Analysis. Chemical Engineer 29(3): 81-85.
-
Liang Q, Chen C, Wengang W, Xiangqian Y, Gao Xi (2019) Countermeasures for improving oil recovery by well network encryption in ultra-low permeability oilfield. Petrochemical Industry Application 38(3): 38-41.
-
Wu CH, Laughlin BA, Jardon M (1989) Infill Drilling Enhances Waterflood Recovery. Journal of Petroleum Technology 41(10): 1088-1095.
-
Dongmei S (2018) Evaluation of development effect of infill well network in ultra-low permeability reservoir. Chemical Management, pp: 190-191.
-
Jianhua T, Xisheng Z, Chunrong T, Chunhai J, Min L, et al. (2010) The Potentials of Well Pattern Infill Development of High Water-Cut Blocks in Karamay Conglomerate Reservoirs. Xinjiang Petroleum Geology 31(3): 269-272.
-
Zhibo L, Linsong C, Youjun J, Qicheng L (2011) Steam and natural gas flooding (SAGP) Mining Characteristics- -Comparative Analysis with Steam-Assisted Gravity Drainage (SAGD). Petroleum exploration and development 38(1): 79-83.
- Nigeria’s Vulnerability in the Face of Global Energy Policy
- A Simulation Study of Investigation of Optimum Oil Production Performance by Applying Various Gas Injection Methods in Oil Reservoir
- Characterization of Permo-Triassic Reservoirs through Thermal Maturity Assessment of Westphalian Source Rocks in the Cheshire Basin
- Influence of Microwax on the Rheological and Thermal Behaviour of a Wax Crude Oil
- Real-Time Monitoring and Performance Optimization of Steam Injection in Heavy Oil Reservoirs Using Fiber Optic Sensing and Integrated Predictive Simulation Models
- Rapid On-Site Determination of the Total Petroleum Hydrocarbon Content of Soils by Handheld Fourier Transform Near-Infrared Spectroscopy: Development of a Global, Site- and Scanner- Independent Calibration Model