Advanced Oxidative Process for Treatment of Effluents with Hydroquinone in a Batch Reactor: Optimization/Modelling Technique by Response Surface Methodology and Artificial Neural Networks
Graphical Abstract The main objective of this research was to evaluate by using the advanced oxidative process (AOP), a toxic compound, such as an initial hydroquinone concentration (C0) of 500 mg L-1 in a batch reactor. At this stage of the work, an optimization method was performed to obtain mineralization of the total organic carbon (TOC). Furthermore, hydrogen peroxide was used as a source of free hydroxyl radicals (•OH). First, a factorial planning 22 was carried out with the two most significant variables, and two levels were used for the variables (pH and RH). Second, a rotational central composite design (RCCD) was used to investigate the optimal point corresponding to the maximum mineralization of hydroquinone (HQ) and the variables used in the model were pH and RH. Third, the optimal point of HQ mineralization was obtained carried for the desirability function, ranging from 0.0 (very undesirable) to 1.0 (very desirable). Fourth, artificial neural networks (ANNs) was used and the values included in the experiment were time (t), initial hydrogen potential (pH), temperature of the liquid effluent (T), air flow supply (QAF), and the mole ratio of hydroquinone/hydrogen peroxide (RH). The optimal conditions for a TOC conversion, (>80%) were identified. Modeling using artificial neural networks (ANNs) was used to predict the TOC conversion as a function of time. The values of the correlation coefficients (R2) for agreement between the ANN predictions and the experimental results were approximately 0.97, indicating that the model was satisfactory. These techniques have shown to be very promising in the prediction of the degradation and mineralization of contaminants. Thus, the process modeling data by ANN, allowed to carry out a treatment of organic liquid effluents in vertical reactors installed on offshore platforms and then to release this treated water into the oceans, after the complete degradation of hydroquinone and the highest TOC conversion. Therefore, seas pollution caused by the exploration on offshore platforms of oil and natural gas, the main sources of obtaining energy in the planet, tends to be minimized, providing a more sustainable energy generation.
Introduction
Water has been considered both as an energy source and an abundant natural resource important for life and environmental, and the treatment of emerging polluters in the aquatic environment is thus extremely relevant for planet sustainability [1, 2]. The classes of phenolic organic compounds from petroleum such as hydroquinone and catechol (phenol intermediates), among others, have been considered as toxic and emerging polluters that have aroused the interest of researchers for years [3, 4]. When in contact with living organisms, these organic substances have toxicological effects, which still need to be thoroughly analyzed [5, 6]. Phenols and their aromatic intermediates are prevalent in industrial wastewater from the oil refining process [4, 7]. Thus, the steps that produce contamination in these industrial effluents are distillation of crude oil, manufacture of lubricants, isomerization techniques, among others [8, 9, 10]. According to The US Environmental Protection Agency– USEPA [11], these organic contaminant compounds are not established in control planning and may be classified in environmental legislation in the next stages of management, corresponding to the results found on scientific research on toxicity, health effects, society understanding and the results acquired on the existence of these compounds in various matrices in the ecosystem [12]. These compounds include complex structures containing several carbon chains as well as aromatic hydrocarbons connected to one or more hydroxyl groups [13]. During the phenol degradation stage, the breakdown of the hydroxyl radical from the aromatic ring gives rise to one of the simplest intermediates, hydroquinone (1,4-dihydroxybenzene) [14, 15]. This compound can be found in various types of industrial effluents [16, 17] and as an intermediate in treatment processes containing phenolic effluents, and when present in low concentrations (ng L–1 to pg L–1), it can also cause harmful effects on living organisms [18, 19]. Hydroquinone has been used in cosmetic products, in alkaline solutions used in photography, and as an antioxidant in the rubber and food industries [20, 21]. Hydroquinone has an important effect on immune complex cells in the body and is known as ecosystem contaminant [22]. It is found in the atmosphere, also known as the gaseous layer of the earth, as a result of the burning of benzene in gasoline or some other hydrocarbon altered [23, 24].
Among the processes developed to treat effluent refractory organics, advanced oxidative processes (AOPs) which are based on the application of highly oxidizing species to promote a more effective degradation of the pollutant, have been highlighted, with excellent results in the remediation of recalcitrant chemical species [25, 26, 27]. The adsorption of phenol and hydroquinone by the PVAm-GO-(o- MWCNTs)-Fe3O4 nanohybrid adsorbent and their competitive performance in batch experiments has been investigated [28]. The results indicated that the adsorption of phenol and hydroquinone reached equilibrium in approximately 45 min and 60 min, respectively, and the maximum removal capacities for phenol and hydroquinone were 224.21 mg g–1 and 293.25 mg g–1, respectively. This adsorbent is a highly efficient material for the simultaneous elimination of phenolic pollutants from aqueous solutions. The efficiency of phenol degradation in most of the technological processes currently used can reach approximately 100%, but total mineralization is not always obtained, and during the degradation process, refractory products that are more toxic than their precursors can form, and also require treatment.
Brandao, et al. [18] report the use of several treatments through AOPs for the removal of organic pollutants, such as homogeneous systems with use of ozone (O3), hydrogen peroxide (H2O2)/ultravioleta (UV), Fenton ou Fenton/photo using. The heterogeneous method contain the photocatalysis [29, 30] and electron-Fenton systems [31, 32].
Currently, several computational implements are used to optimize the experimental results in scientific research, such as linear or nonlinear programming methods, artificial neural networks, and simultaneous modeling of multiple responses. Thus, these methods are applied to optimize chemical techniques and decrease the time and cost of analysis [27, 33, 34].
The complexity of the reaction mechanisms of advanced oxidative processes makes it difficult to determine kinetic models based on the phenomenology of the reaction [35]. Empirical mathematical models cannot satisfactorily describe the process; therefore, models based on artificial neural networks (ANNs) are used [36, 37, 38]. In chemical engineering, the use of neural networks was initiated by Hoskins and Himmelblau [39]. Since then, several applications have been suggested. These include the technique that employs unconventional advanced oxidative processes for the degradation and mineralization of phenolic effluents, known as direct contact thermal treatment (DiCTT). The DiCTT method uses a stainless-steel reactor in which natural gas combustion and hydroxyl radical production (•OH) occur, can oxidize phenolic compounds at low temperature and atmospheric pressure [27, 40, 41].
The aim of the present research was mainly to propose an optimization and modelling process to the highest percentage of total organic carbon (TOC) conversion. Thus, this research was important to assess a synthetic toxic compound, such as the initial hydroquinone concentration (C0) by using the advanced oxidative process (AOP) in a batch reactor. A constant agitation speed of 500 rpm was used, in order to propose an optimization and modelling process for highest TOC conversion. This study presents the first example of process modeling with optimization by the
A
use of a statistical software, and with hydrogen peroxide (H2O2) as a source of free hydroxyl radicals (•OH) for TOC conversion. The modelling methods (response surface methodology‒RSM and artificial neural networks‒ANNs) were used to determine the relationship between input and output variables.
Materials and Methods
Chemicals
Practical tests were performed in a batch reactor using a prepared synthetic solution of hydroquinone (99% PA, Dinamica), hydrogen peroxide, H2O2, analytical grade (35% PA, Vetec). The solution of sulfuric acid and sodium hydroxide were prepared in a concentration of 0.1 M, respectively, adjusting the initial pH of the wastewater as specified. Phosphoric acid (25% PA, Vetec) was used in the TOC analysis method.
Experimental Setup
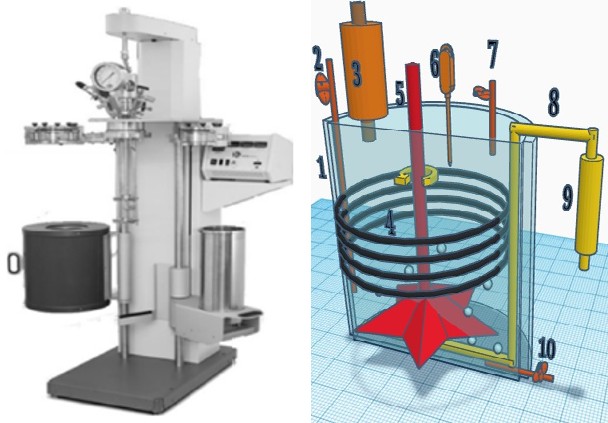
Figures 1A and 1B indicate a photograph and schematic of the reactor, model 4848 (Parr Co., Moline, IL, USA) and constructed with stainless steel, applied in the tests. The reactor has a batch system, with a mechanical agitation, and which presents 1.3 L employee volume. The control of pressure, temperature and stirring speed of sampling is of simultaneous characteristic.
Figure 1: Batch Reactor: A) Photograph; B) Scheme: 1: Heating blanket; 2: Sample collector; 3: Condenser; 4: Coil for cooling; 5: Stirring and mixing system; 6: Thermocouple; 7: Relief Valve; 8: Air distribution system; 9: Rotameter; 10: Discharge valve At the first stage of a proceeding, 1.3 L of a synthetic liquid effluent with an initial hydroquinone concentration (C0) of 500 mg L–1 was conducted by adjusting the initial pH of the effluent with 0.1 M H2SO4 or 0.1 M NaOH as required. This wastewater polluted with hydroquinone was conducted to a batch reactor showing a stirring method, temperature control, and air supply inlet, connected through an adaptor to a vapor condensation system. A rotation rate of 500 rpm was controlled. The operation of the system was stabilized by heating the water. The pressure used in the experiments was 1.0 kgf cm–2 (1.0 Bar). An small fraction of the mole ratio of hydroquinone to hydrogen peroxide (RH) was introduced into the reactor to initiate hydroquinone oxidation in the liquid phase. For each test, samples of approximately 20 mL of solution were collected in triplicate at successive times in dark plastic bottles and refrigerated. A sample of 20 mL of treated water without HQ was also collected to represent a blank for the hydroquinone solutions. The sample collection times (t) were 0, 45, 90, 135, and 180 min, totaling five samples. For the assay that used the optimum point, samples of approximately 5.0 mL of solution were also collected in triplicate in dark plastic bottles and refrigerated. A sample of treated water (5.0 mL) without hydroquinone was also collected. The tests conducted to obtain the ANN and times (t) in this assay were 0, 20, 40, 60, 80, 100, 120, 140, 160, and 180 min, totaling 10 samples.
Analytical Method
Total Organic Carbon (Toc): TOC conversion was analyzed by a TOC apparatus (VCSH Shimadzu model) to quantify the mineralization of the hydroquinone concentration formed in the advanced oxidation process. This analyzer that evaluates the TOC content can simultaneously quantify the total indices of organic carbon and total nitrogen [42, 43].
Use of the Mole Stoichiometric Ratio and Description of Response Variables The application of the molar stoichiometric of hydroquinone in the accumulation of hydrogen peroxide of 100% was used to totally transform 1 mole of hydroquinone into CO2 and H2O in promise with the response stoichiometry demarcated in the following equation:
( ) 6 4 2 2 2 2 Hydroquinone ( ) 13 6 16 C H OH H O CO H O − + → + (1)
This molar ratio other than 100% was calculated by resources of the stoichiometry in Equation (1).
The proportion conversion of TOC was obtained as a response variable, measures the sum of Total Organic Carbon (TOC) transformed into CO2 and H2O, also defined as mineralization for the effluent treatment process, which converts this into innocuous substances. The percentage (%) adjustment of TOC was obtained using the calculation:
0 x TOC TOC TOC TOC TOC B − − = (2)
( ) 100 % 0 where: TOC0= initial total organic carbon in liquid effluent; TOC= total organic carbon in liquid effluent at the given instant; TOCB= total organic carbon in the pure water (blank).
Experimental Methods
A statistical procedure was applied in the test to optimize the method and to assess the effects for TOC conversion, of the following operating parameters: the initial hydrogen ionic potential (pH, set at values 9.0, 10.1 and 11.2); and the molar stoichiometric ratio of hydroquinone to hydrogen peroxide (RH, 90, 110 and 130%). First, a 22 factorial was carried out around the inflection point for the variables (pH and RH) that were more significant in the process compared to the other variables. Second, a rotational central composite design (RCCD) was used to obtain the response surface methodology (RSM) for the same variables (pH and RH). Third, the optimal point of HQ mineralization was obtained carried for the desirability function, ranging from 0.0 to 1.0. In the fourth step, t; pH; T; QAF; and RH were used as inputs to the ANN, whereas the outputs of the ANN was TOC conversion. The influence of the connection between input and output variables was determined and compared with the results obtained by RSM.
Statistical Techniques: According to Galdamez, et al. [44, 45], the meaning of identify the relevant characteristics for a data analysis is quite important to obtain a good experimental planning. The response variables are the parameters on which the experiment has a direct influence and that cause considerable changes in a given assay. The control factors are the parameters that aim to evaluate the effects produced in the response variables; it contribute to the determination of the factors studied and are influenced by the experiment.
The statistical technique applied to the operational variables determines the parameters that prove to be most important in the efficiency of an AOP for the treatment of the organic effluent, for the TOC conversion. These parameters include the liquid effluent temperature (T), time (t), initial pH of the reaction medium (pH), air flow supply (QAF), and molar stoichiometric ratio of hydroquinone/hydrogen peroxide (RH).
In this first phase, factorial planning 22 was carried out with the two most significant variables, and two levels were used around the inflection point for the variables (pH and RH). Tests were conducted to obtain the experimental factorial design, including four runs and five repetitions at the central point, totaling nine runs, with sample collection at times t = 0, 45, 90, 135, and 180 min, around the curvature region of the previous stage. The independent variables used in the experimental model were: pH, with the values 9, 10.1, and 11.2; and RH, with the values 90, 110, and 130%, respectively. The values included in addition to the experimental ones were, for pH, − 1, 0, and +1, and, for RH, –1, 0, and +1.
Oliveira, et al. [46] were successful in applying the MAGM technique to treat a p-cresol solution by a homogeneous AOP of the peroxidation type, in a batch reactor, at temperature of 90°C and reaction time of 180 min. A 22-full factorial design was used with the addition of four repetitions at the central point, totaling 8 runs. The independent variables used in the experimental model were: R, with the values 64, 78, and 92%; and F, with the values 110, 120, and 130 L h−1, respectively, both corresponding to coded levels of −1, 0, and +1.
In the second phase of this research, a Rotational Central Composite Design (RCCD) was used to investigate the optimal point corresponding to the maximum mineralization of hydroquinone (HQ). For this, 13 runs were performed aiming to completement the nine runs of the 22-full factorial design. The tests carried out to obtain the RCCD included four runs, four axial points, and five central points, totaling 13 runs, with sample collection at times t = 0, 45, 90, 135, and 180 min. The independent variables used in the experimental model were, for pH, 8.5, 9, 10.1, 11.2, and 11.7; and, for RH, 82, 90, 110, 130, and 138%, respectively. The values included in addition to the experimental values were, pH and RH, respectively, both corresponding to coded levels of −1.68, − 1, 0, +1, and +1.68.
Oliveira, et al. [46] also used a RCCD to determine the maximum TOC conversion of p-cresol, in which the axial points determined with the Statistic 8.0 software were added, together with an additional central point run, to the runs of the 22-factorial design. Thus, 5 runs were performed aiming to complement the 8 runs of the 22-full factorial design. The independent variables were the same, R with the values of 58, 78, and 98%; and F, with the values 106, 120, and 134 L h−1, respectively, both corresponding to coded levels of −1.41, 0, and +1.41, while keeping the same central point conditions (R = 78%, F = 120 L h−1).
In the third phase of this study, the optimal point of HQ mineralization was obtained carried for the desirability function, available in the Statistica software, ranging from 0.0 (very undesirable) to 1.0 (very desirable).
Finally, in the fourth phase, mathematical modeling of the experimental data collected in the batch reactor was performed with the computational tool of artificial neural networks (ANNs), using the Statistic software, version 8.0, Neural Networks module. The tests conducted to obtain the ANN included 10 runs, with sample collection at times t = 0, 20, 40, 60, 80, 100, 120, 140, 160, and 180 min. The values included in the experiment were, pH = 9.3, T = 90°C; for QAF, 50 L h–1; and, for RH, 110%.
Brandao, et al. [27] applied a modelling method for the ANN to determine the relationship between input and output variables to obtain the highest phenol degradation and TOC conversion rates, with consideration given to obtaining an evaporation rate below 11% and a liquid effluent temperature ranging from 70 to 780C. A total of 102 experimental data points were used to generate the ANN; 80% used for training, 10% for testing, and 10% for validation. Activation functions used for training the hidden layer and output neurons included the logistic and exponential functions. The 20 best networks were retained using the sum of quadratic errors as a criterion. The selected ANN had four neurons in the hidden layer and R(2) equal to 0.9811 for training, 0.9909 for testing and 0.9339 for validation. Validation of Optimal Conditions by the Desirability Function: Desirability function was used in the research with the variables (pH, T, QAF and RH) to obtain optimization for the maximum TOC conversion of hydroquinone after adding two more operational variables (T: temperature, and, QAF: the air flow rate). Desirability function is favored as the response moves away from zero, reaching maximum desirability value with unit value. Thus, it allows to optimize a significant variable to represent the dependent (output) and independent (input) variables from controlled values (0 ≤ d ≤ 1), according to Semenov, et al. [47].
Derringer and Suich [48] changed the original Desirability function and established optimization variable that were the following operating parameters: 𝑆𝑇𝐵 (smaller- the-better), 𝐿𝑇𝐵 (larger-the-better), and 𝑁𝑇𝐵 (nominal-the- better). These authors proposed a output variable (𝑦) with lower specification limit (𝐿𝑆𝐿) and upper specification limit (𝑈𝑆𝐿). The 𝑆𝑇𝐵 function seeks to minimize 𝑦, while the 𝐿𝑇𝐵 function seeks to maximize 𝑦. The 𝑁𝑇𝐵 function seeks to optimize from a target value (𝜆). The different Desirability functions are defined as:
− ≤ ≤ = − >
τ α α y LSL y USL d LSL y USL
( ) (3) STB
0 ( ) − ≤ ≤ = − >
τ α α y LSL y USL d LSL y USL
( ) (4) STB
0 ( )
− = ≤ ≤ − − ≤ ≤ −
( )
0 y LSLou y ULS
(5) s y LSL d LSL y LSL
( ) λ λ NTB τ y ULS y ULS ULS
( ) λ λ where α is the smallest possible value for the response variable (y) and λ is the nominal (target) value for y. The parameters τ and s are constants of the Desirability function (0.01 to 10).
The values predicted (optimal point) by the desirability function for the independent variables were used in triplicate tests for HQ mineralization that were submitted to Statistic 8.0 software package. The factors used to validate the optimal conditions after applying the desirability function were pH= 9.3, T= 90°C, QAF= 50 L h–1, and RH= 110%. Thus, pH and RH are the variables optimized by the desirability function. Process Modelling via Artificial Neural Networks: Mathematical modeling of the process was performed using artificial neural networks (ANNs) from Statistic software version 8.0, and a database acquired by the application of the neural network module was used to obtain the HQ mineralization. In this study, 1,000 artificial neural networks (ANNs) were tested, with characteristics of the multilayer perceptron (MLP) type, to obtain the optimized kinetic conditions for the HQ mineralization process. The activation functions used in the input layers (independent variables) and output layers (dependent variables) by ANN were exponential and logistic, respectively. In this study, the ANN results were generated from data provided at the neural network entrance, where 153 of these data points were applied to create the ANN: 70% used for training, 20% for testing, and 10% for validation of the neural network. The other ten data points were used to predict the values of total organic carbon conversion at the optimum point.
The ANN was created with the following input parameters: the reaction time (t), the initial pH of the reaction medium (pH), the temperature (T), the air flow supply (QAF) and the molar stoichiometric ratio of hydroquinone/ hydrogen peroxide (RH), where the TOC conversion was the neural network output. In this research, the neural network MLP with Yi (input data), Wij and W’jk (weights), f(αj) and f(α’k) (logistic sigmoidal and exponential activation function) and Yk (output data) were used [34]. The neural network presents neurons connected in parallel through the weights (Bk, bias). The logistic sigmoidal activation function is specified by ( ) 1 1 j á e j f α − = + and ( ) ' ' 1
1 k k f e α α − = −
(6) The exponential activation function is given by ( ) j j f e α α − = and ( ) ' ' k k f e α α − = (7) n j ij i k i W Y B α = + ∑ (8) n ( ) ' ' .
k jk j k j W f B α α = + ∑ (9)
Table 1 shows the TOC values that were used for neural network training, testing, and validation. As before, the same factors (pH = 9.3, T = 90 °C, QAF = 50 L h–1, and RH = 110%) were used in the neural network to predict the values of TOC at the optimum point and compared with the TOC values obtained experimentally for the maximum mineralization of HQ (optimal point).
| Index | Time (min) | pH(-) | T (0C) | QAF (L h-1) | R (%) H | *TOC (%) | Index | Time (min) | pH(-) | T (0C) | QAF (L h-1) | R (%) H | *TOC (%) |
|---|---|---|---|---|---|---|---|---|---|---|---|---|---|
| 1 | 20 | 9.3 | 90 | 50 | 110 | 2.18 | 78 | 180 | 7 | 70 | 100 | 50 | 10.3 |
| 2 | 40 | 9.3 | 90 | 50 | 110 | 8.31 | 79 | 0 | 7 | 70 | 200 | 50 | 0 |
| 3 | 60 | 9.3 | 90 | 50 | 110 | 25.73 | 80 | 90 | 7 | 70 | 200 | 50 | 7.1 |
| 4 | 80 | 9.3 | 90 | 50 | 110 | 48.52 | 81 | 180 | 7 | 70 | 200 | 50 | 16.7 |
| 5 | 100 | 9.3 | 90 | 50 | 110 | 64.26 | 82 | 0 | 9.2 | 90 | 120 | 65 | 0 |
| 6 | 120 | 9.3 | 90 | 50 | 110 | 72.04 | 83 | 90 | 9.2 | 90 | 120 | 65 | 44.5 |
| 7 | 140 | 9.3 | 90 | 50 | 110 | 75.43 | 84 | 180 | 9.2 | 90 | 120 | 65 | 61.3 |
| 8 | 160 | 9.3 | 90 | 50 | 110 | 76.83 | 85 | 0 | 10.3 | 90 | 130 | 70 | 0 |
| 9 | 180 | 9.3 | 90 | 50 | 110 | 77.3 | 86 | 90 | 10.3 | 90 | 130 | 70 | 58.1 |
| 10 | 0 | 4 | 80 | 150 | 25 | 0 | 87 | 180 | 10.3 | 90 | 130 | 70 | 77.2 |
| 11 | 90 | 4 | 80 | 150 | 25 | 15.7 | 88 | 0 | 11.4 | 90 | 140 | 80 | 0 |
| 12 | 180 | 4 | 80 | 150 | 25 | 18.9 | 89 | 90 | 11.4 | 90 | 140 | 80 | 50 |
| 13 | 0 | 10 | 80 | 150 | 75 | 0 | 90 | 180 | 11.4 | 90 | 140 | 80 | 52.8 |
| 14 | 90 | 10 | 80 | 150 | 75 | 26.2 | 91 | 0 | 8.1 | 80 | 110 | 60 | 0 |
| 15 | 180 | 10 | 80 | 150 | 75 | 41.2 | 92 | 90 | 8.1 | 80 | 110 | 60 | 25.4 |
| 16 | 0 | 7 | 70 | 100 | 50 | 0 | 93 | 180 | 8.1 | 80 | 110 | 60 | 41.1 |
| 17 | 90 | 7 | 70 | 100 | 50 | 6.2 | 94 | 0 | 11.4 | 90 | 140 | 80 | 0 |
| 18 | 180 | 7 | 70 | 100 | 50 | 6.8 | 95 | 90 | 11.4 | 90 | 140 | 80 | 45.4 |
| 19 | 0 | 10 | 60 | 50 | 75 | 0 | 96 | 180 | 11.4 | 90 | 140 | 80 | 40.8 |
| 20 | 90 | 10 | 60 | 50 | 75 | 3.2 | 97 | 0 | 8.4 | 90 | 50 | 75 | 0 |
| 21 | 180 | 10 | 60 | 50 | 75 | 5.3 | 98 | 90 | 8.4 | 90 | 50 | 75 | 31.9 |
| 22 | 0 | 7 | 70 | 100 | 50 | 0 | 99 | 180 | 8.4 | 90 | 50 | 75 | 58.8 |
| 23 | 90 | 7 | 70 | 100 | 50 | 6.4 | 100 | 0 | 9.3 | 90 | 50 | 95 | 0 |
| 24 | 180 | 7 | 70 | 100 | 50 | 9.7 | 101 | 90 | 9.3 | 90 | 50 | 95 | 51.1 |
| 25 | 0 | 7 | 70 | 100 | 50 | 0 | 102 | 180 | 9.3 | 90 | 50 | 95 | 72.5 |
| 26 | 90 | 7 | 70 | 100 | 50 | 4.1 | 103 | 0 | 10.3 | 90 | 50 | 110 | 0 |
| 27 | 180 | 7 | 70 | 100 | 50 | 7 | 104 | 90 | 10.3 | 90 | 50 | 110 | 45.8 |
| 28 | 0 | 4 | 60 | 150 | 75 | 0 | 105 | 180 | 10.3 | 90 | 50 | 110 | 83.9 |
| 29 | 90 | 4 | 60 | 150 | 75 | 2.6 | 106 | 0 | 9.8 | 90 | 50 | 100 | 0 |
| 30 | 180 | 4 | 60 | 150 | 75 | 4.1 | 107 | 90 | 9.8 | 90 | 50 | 100 | 66.5 |
| 31 | 0 | 4 | 60 | 50 | 25 | 0 | 108 | 180 | 9.8 | 90 | 50 | 100 | 82.2 |
| 32 | 90 | 4 | 60 | 50 | 25 | 1.7 | 109 | 0 | 10.7 | 90 | 50 | 120 | 0 |
| 33 | 180 | 4 | 60 | 50 | 25 | 4.1 | 110 | 90 | 10.7 | 90 | 50 | 120 | 81.5 |
| 34 | 0 | 10 | 80 | 50 | 25 | 0 | 111 | 180 | 10.7 | 90 | 50 | 120 | 83.2 |
| 35 | 90 | 10 | 80 | 50 | 25 | 21.7 | 112 | 0 | 11.2 | 90 | 50 | 130 | 0 |
| 36 | 180 | 10 | 80 | 50 | 25 | 25.8 | 113 | 90 | 11.2 | 90 | 50 | 130 | 74.3 |
| 37 | 0 | 4 | 80 | 50 | 75 | 0 | 114 | 180 | 11.2 | 90 | 50 | 130 | 74 |
| 38 | 90 | 4 | 80 | 50 | 75 | 13.3 | 115 | 0 | 10.1 | 90 | 50 | 110 | 0 |
| 39 | 180 | 4 | 80 | 50 | 75 | 31.6 | 116 | 90 | 10.1 | 90 | 50 | 110 | 70.3 |
| 40 | 0 | 10 | 60 | 150 | 25 | 0 | 117 | 180 | 10.1 | 90 | 50 | 110 | 73.1 |
| 41 | 90 | 10 | 60 | 150 | 25 | 0.2 | 118 | 0 | 11.2 | 90 | 50 | 130 | 0 |
| 42 | 180 | 10 | 60 | 150 | 25 | 1.1 | 119 | 90 | 11.2 | 90 | 50 | 130 | 33.4 |
| 43 | 0 | 7 | 70 | 100 | 50 | 0 | 120 | 180 | 11.2 | 90 | 50 | 130 | 34.4 |
| 44 | 90 | 7 | 70 | 100 | 50 | 5.3 | 121 | 0 | 11.2 | 90 | 50 | 90 | 0 |
| 45 | 180 | 7 | 70 | 100 | 50 | 8.9 | 122 | 90 | 11.2 | 90 | 50 | 90 | 54 |
| 46 | 0 | 4 | 80 | 150 | 75 | 0 | 123 | 180 | 11.2 | 90 | 50 | 90 | 54.1 |
| 47 | 90 | 4 | 80 | 150 | 75 | 21.2 | 124 | 0 | 10.1 | 90 | 50 | 110 | 0 |
| 48 | 180 | 4 | 80 | 150 | 75 | 30.1 | 125 | 90 | 10.1 | 90 | 50 | 110 | 68.2 |
| 49 | 0 | 10 | 80 | 50 | 75 | 0 | 126 | 180 | 10.1 | 90 | 50 | 110 | 76 |
| 50 | 90 | 10 | 80 | 50 | 75 | 19.8 | 127 | 0 | 10.1 | 90 | 50 | 110 | 0 |
| 51 | 180 | 10 | 80 | 50 | 75 | 30.1 | 128 | 90 | 10.1 | 90 | 50 | 110 | 54.9 |
| 52 | 0 | 10 | 60 | 150 | 75 | 0 | 129 | 180 | 10.1 | 90 | 50 | 110 | 76.9 |
| 53 | 90 | 10 | 60 | 150 | 75 | 6.2 | 130 | 0 | 10.1 | 90 | 50 | 110 | 0 |
| 54 | 180 | 10 | 60 | 150 | 75 | 6.3 | 131 | 90 | 10.1 | 90 | 50 | 110 | 50.2 |
| 55 | 0 | 4 | 80 | 50 | 25 | 0 | 132 | 180 | 10.1 | 90 | 50 | 110 | 79.8 |
| 56 | 90 | 4 | 80 | 50 | 25 | 10.1 | 133 | 0 | 8.5 | 90 | 50 | 110 | 0 |
| 57 | 180 | 4 | 80 | 50 | 25 | 12.2 | 134 | 90 | 8.5 | 90 | 50 | 110 | 48.9 |
| 58 | 0 | 10 | 80 | 150 | 25 | 0 | 135 | 180 | 8.5 | 90 | 50 | 110 | 76.2 |
| 59 | 90 | 10 | 80 | 150 | 25 | 12.1 | 136 | 0 | 11.7 | 90 | 50 | 110 | 0 |
| 60 | 180 | 10 | 80 | 150 | 25 | 21.2 | 137 | 90 | 11.7 | 90 | 50 | 110 | 50.3 |
| 61 | 0 | 10 | 60 | 50 | 25 | 0 | 138 | 180 | 11.7 | 90 | 50 | 110 | 49.8 |
| 62 | 90 | 10 | 60 | 50 | 25 | 3.4 | 139 | 0 | 10.1 | 90 | 50 | 80 | 0 |
| 63 | 180 | 10 | 60 | 50 | 25 | 3.5 | 140 | 90 | 10.1 | 90 | 50 | 80 | 41.8 |
| 64 | 0 | 4 | 60 | 50 | 75 | 0 | 141 | 180 | 10.1 | 90 | 50 | 80 | 69.6 |
| 65 | 90 | 4 | 60 | 50 | 75 | 0.7 | 142 | 0 | 10.1 | 90 | 50 | 140 | 0 |
| 66 | 180 | 4 | 60 | 50 | 75 | 3.4 | 143 | 90 | 10.1 | 90 | 50 | 140 | 45.1 |
| 67 | 0 | 4 | 60 | 150 | 25 | 0 | 144 | 180 | 10.1 | 90 | 50 | 140 | 73 |
| 68 | 90 | 4 | 60 | 150 | 25 | 0.8 | 145 | 0 | 9 | 90 | 50 | 90 | 0 |
| 69 | 180 | 4 | 60 | 150 | 25 | 2.2 | 146 | 90 | 9 | 90 | 50 | 90 | 61.7 |
| 70 | 0 | 7 | 90 | 100 | 50 | 0 | 147 | 180 | 9 | 90 | 50 | 90 | 75.1 |
| 71 | 90 | 7 | 90 | 100 | 50 | 40.1 | 148 | 0 | 9.4 | 90 | 50 | 110 | 0 |
| 72 | 180 | 7 | 90 | 100 | 50 | 39.9 | 149 | 90 | 9.4 | 90 | 50 | 110 | 62.5 |
| 73 | 0 | 13 | 70 | 100 | 50 | 0 | 150 | 180 | 9.4 | 90 | 50 | 110 | 78 |
| 74 | 90 | 13 | 70 | 100 | 50 | 23.1 | 151 | 0 | 9 | 90 | 50 | 130 | 0 |
| 75 | 180 | 13 | 70 | 100 | 50 | 26.6 | 152 | 90 | 9 | 90 | 50 | 130 | 47.5 |
| 76 | 0 | 7 | 70 | 100 | 50 | 0 | 153 | 180 | 9 | 90 | 50 | 130 | 73.2 |
| 77 | 90 | 7 | 70 | 100 | 50 | 5.2 |
Table 1: Data used for hydroquinone modelling by ANN.
*TOC values to be predicted by the model generated from neural networks. Table 1: Data used for hydroquinone modelling by ANN.
Results and Discussion
Statistical Analysis of the TOC Conversion
Teododio, et al. [43] used a statistical technique in their experiments to optimize the process and to assess the effects for hydroquinone degradation (HD) and TOC conversion. The following operating variables were: the initial hydrogen ionic potential of the reaction medium (pH) of 4, 7, and 10; the temperature (T) of the liquid effluent of 60, 70, and 80°C; the air flow rate (QAF) of 50, 100, and 150 L h–1; and the molar stoichiometric ratio of hydroquinone to hydrogen peroxide (RH) of 25%, 50%, and 75%. First, a 24 factorial design was performed to obtain the effects of the variables (pH, T, QAF and RH); Second, the maximum ascending gradient method (MAGM) was performed to analyze the optimal point of the process on the effects of the variables (pH, T, Q and R), and, in the third phase a lumped kinetic model (LKM) was obtained to describe the profile of the TOC conversion.
Factorial Planning (22)
A new factorial planning (22) was elaborated in this research, around the region of curvature at the MAGM stage after the results obtained by Teododio et al. [43], being a continuation of their experimental results for this recent study, with the objective of finding the maximum mineralization point for hydroquinone. In this stage, only the
2 variables proved to be significant, so the use of a planning with only two levels (22) was studied. Thus, two independent variables were initially designated, that was pH and RH, whose actual values were 9, 10.1 and 11.2; and 90, 110, and 130%, respectively, corresponding to coded levels of ‒1, 0, and +1.
Table 2 shows the results obtained from the factorial planning (22) for the hidroquinone mineralization. The highest TOC conversion in trials 5 to 9 at the center point were obtained and is possibly due to the increase in the oxidation rate of hydroquinone at higher pH. Furthermore, highest TOC conversion in trial 8 with value of pH (10.1) and RH (%) (110), respectively were obtained, approximately, 80%.
From assay 5, the equilibrium shift in the direction of the formation of parabenzoquinone was observed during the adjustment of the initial pH of the reaction medium. This reaction intermediate was verified by the darkening of the model effluent (red-brown coloration). The concentration of quinone, the intermediate product of the reaction, catalyzes the oxidation of hydroquinone. Quinone reacts with the hydroquinone dianion to form an unstable radical (semiquinone), which can react quickly and spontaneously with oxygen, forming a stable dimer [49].
| Test | pH | R (%) H | TOC (%) |
|---|---|---|---|
| 1 | 9 (‒) | 90 (‒) | 75.12 |
| 2 | 11.2 (+) | 90 (‒) | 54.16 |
| 3 | 9 (‒) | 130 (+) | 73.27 |
| 4 | 11.2 (+) | 130 (+) | 34.41 |
| 5* | 10.1 (0) | 110 (0) | 76 |
| 6* | 10.1 (0) | 110 (0) | 73.2 |
| 7* | 10.1 (0) | 110 (0) | 75.6 |
| 8* | 10.1 (0) | 110 (0) | 79.98 |
| 9* | 10.1 (0) | 110 (0) | 78 |
Table 2: Matrix for factorial planning 22 and results obtained.
*Center point Table 2: Matrix for factorial planning 22 and results obtained.
The analysis of the data through ANOVA for the significant factors (pH and RH) is described in Table 3. The two main factors pH and RH were significant in this new interval studied. The determination coefficient (R2) and adjusted determination coefficient (R2 Adj) values for the Experimental complete factorial, (22), Significant Terms QS DF QA F p (1) pH 894.639 1 894.639 136.094 0.0003 (2) RH 116.665 1 116.665 17.7472 0.0136 1 by 2 80.093 1 80.093 12.1839 0.0251 Lack of Adjustment 666.539 1 666.54 101.4 0.0006 Pure Error 26.295 4 6.5737 QS Total 1784.23 8 model were 61.17% and 37.90%, respectively. Thus, the lack of adjustment to the linear model of the data showed that possibly a quadratic model can be better adjusted to the experimental data.
- QS= Quadratic Sum; DF= Degrees of Freedom; QA=Quadratic Average; F= F Test; p= p-value.
- R2= 0.6117; R2
- Adj= 0.379.
Table 3: Analysis of variance for the TOC conversion, factorial planning (22).
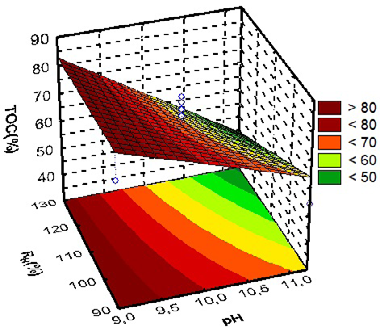
Figure 2 indicates that highest TOC conversion was greater than 80% when the pH levels are lower (equal to 9), independent of the range of the RH.
Teododio, et al. [43] recently investigated the treatment of effluents containing hydroquinone in a batch reactor by a homogeneous AOP with the reaction time of 180 min. First, a 24 factorial design was carried out for the classification order of the significant variables (pH, T, QAF, and RH) for the TOC conversion.
The results shows that the TOC conversion increased (>35%) when the levels of these factors (pH and T) increased to T= 80ºC and pH >7, for values at their maximum levels, pH >7 and RH= 75%, and for T= 80ºC and RH = 75%, respectively, showing a positive interaction between these variables for the mineralization of hydroquinone. Second, the maximum ascending gradient method (MAGM) was used to determine the optimum point of the process for the same variables (pH, T, QAF, and RH) for the TOC Conversion and HQ degradation. The results shows the maximum TOC conversion of approximately 84%, and HQ degradation of 100%, considering a water evaporation rate of up to 11%. Oliveira, et al. [46] applied the MAGM technique to treat a p-cresol solution by a homogeneous AOP. These authors used the variables (T, R and F) with the reaction time of 180 min to obtain the point optimal for TOC conversion. The results shows the maximum TOC conversion of approximately 64%, considering a water evaporation rate of up to 11% and with the same batch reactor used in this actual research and by Teododio, et al. [43].
Norouzi, et al. [50] studied the phenol contaminated water treatment by photocatalytic degradation on electrospun Ag/TiO2 nanofibers and response surface method (RSM) was used for the design of experiment (DOE) for statistical optimization. The three factors used were pH, initial phenol concentration, and concentration of photocatalyst in water. The maximum phenol degradation of 92.91% was obtained at optimal values of phenol concentration, catalyst dosage and pH, respectivamente, corresponding the values of 5.62 mg L-1, 2.06 g L-1, and 7.87. Brandao, et al. [41] recently described the use of an unconventional AOP for the treatment of synthetic water containing phenol in a reactor, called Direct Contact Thermal Treatment (DiCTT) using the combustion of natural gas and excess air, acts as a thermochemical process. The three factors used were initial phenol concentration, molar stoichiometric ratio of phenol/hydrogen peroxide and reaction time. The maximum phenol degradation of 99% and a TOC conversion >40% was obtained at optimal values, while the liquid phase flowrate, burner power dissipation, air excess, and recycle rate of gaseous thermal wastes were set at 170 L h−1, 38.6 kW, 10%, and 100%, respectively.
Ji, et al. [51] reported degrade refractory pollutants using perovskite oxides as heterogeneous catalysts by a AOP. These catalysts showed the efficiency of activating oxidizing species and forming other reactive oxygen compounds with high redox potential and degrade contaminants in water. However, the use of perovskite-based AOPs has some limitations, such as leaching of metal ions, small surface area, low number of active sites, etc.
Rotational Central Composite Design
Table 4 shows the matrix of the planning of the rotational central composite design (RCCD) with the addition of the axial points from the factorial planning (22). The highest TOC conversion in trial 12 was obtained at the center point of 110, with an average of approximately 79.98%.
The analysis of variance Table 5 shows that the factors that influence the response are pH (quadratic and linear terms) and the quadratic term of the RH. The interaction between these two factors was also significant, as was the lack of adjustment to the linear model. This result proves the existence of a maximum region where there is an optimal point at which mineralization reaches the highest value. The quadratic model is the best fit for the experimental data.
| Test | pH | R (%) H | TOC (%) |
|---|---|---|---|
| 1 | 9 | 90 | 75.12 |
| 2 | 9 | 130 | 73.27 |
| 3 | 11.2 | 90 | 54.71 |
| 4 | 11.2 | 130 | 34.41 |
| 5* | 8.5 | 110 | 76.42 |
| 6* | 11.7 | 110 | 50.01 |
| 7* | 10.1 | 82 | 69.79 |
| 8* | 10.1 | 138 | 73.12 |
| 9** | 10.1 | 110 | 76 |
| 10** | 10.1 | 110 | 73.2 |
| 11** | 10.1 | 110 | 75.6 |
| 12** | 10.1 | 110 | 79.98 |
| 13** | 10.1 | 110 | 78 |
Table 4: Matrix for RCCD.
*Axial Points; Central Points Table 4:** Matrix for RCCD.
| Planning, (RCCD), Significant Terms | |||||
|---|---|---|---|---|---|
| QS | DF | QA | F | p | |
| (1)pH (L) | 1180.18 | 1 | 1180.18 | 179.352 | 0.0002 |
| pH (Q) | 526.037 | 1 | 526.037 | 79.942 | 0.0009 |
| (2)R (L) H | 35.659 | 1 | 35.659 | 5.419 | 0.0804 |
| R (Q) H | 145.497 | 1 | 145.497 | 22.111 | 0.0093 |
| 1L by 2L | 80.108 | 1 | 80.108 | 12.174 | 0.0251 |
| Lack of Adjustment | 280.899 | 3 | 93.633 | 14.23 | 0.0124 |
| Pure Error | 26.321 | 4 | 6.58 | ||
| QS Total | 2212.905 | 12 |
Table 5: Matrix for RCCD.
QS= Quadratic Sum; DF= Degrees of Freedom; QA=Quadratic Average; F= F Test; p= p-value. R2= 0.86; R2 Adj= 0.76. Table 5: Analysis of variance for the TOC conversion, planning RCCD.
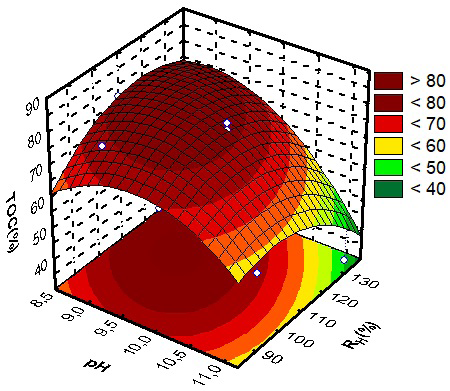
Figure 3 indicates that the highest TOC conversion was greater than 80% when the pH levels were lower (<10), and the range of RH was greater than 90%. It was possible to observe a region of curvature, that is, a region of maximum, which explains the lack of adjustment to the linear model obtained in the analysis of ANOVA. Thus, the maximum mineralization point is in a pH range of approximately 8.7 to 10.0 and an RH range of 100% to 130%.
According to Brandao, et al. [52] the presence of excess air, which is used as an oxidant has been an essential step for the radical production reaction. As well, the junction of excess air plus hydrogen peroxide helps in chemical oxidation, facilitating the degradation process of persistent organic pollutants to wastewater treatments.
Benali, et al. [53] described that the saturation with molecular oxygen applied in several existing methods for the treatment of organic liquid effluents can generate some recent radicals by a sequence of several recombination reactions. In the Catalytic Wet Peroxide Oxidation (CWPO) system, for example, complementary •OH radicals can be produced by activating molecular oxygen in addition to hydrogen. Consequently, the presence of oxygen facilitates the increase of the propagation steps of the radical reactions, and thus favors the increase of the degradation efficiency of the compounds.
Barrault, et al. [54] reported that some types of gases are often not efficient to obtain a high degradation and mineralization of the compound in the reaction steps. The degradation of phenol and the conversion of TOC, for example, remain low in the presence of atmospheric nitrogen, an inverse result obtained for the use of atmospheric air under the same reaction conditions.
Brandao, et al. [18] evaluated the liquid phase flow rate (QL) of 100 and 170 L h−1 and the effect of initial phenol concentration (CPh0) of 500, 2000 and 3000 mg.L−1 for the treatment of synthetic water containing phenol in a reactor DiCTT. The experiments studies were performed using a molar stoichiometric ratio of phenol/hydrogen peroxide (RP/H) of 50%, an air excess (E) of 40%, a combustion gas recycling rate (QRG) of 50%, and, a natural gas flow (QGN) of 4 m3 h−1. The complete degradation of phenol of 100% was obtained independently of QL, and, of CPh0, with the reaction time of 170 min. A TOC conversion of almost 35% was observed corresponding to an operational time of approximately 210 min at a QL of 170 L h−1.
Optimization for TOC (Desirability Function)
At this stage of the research, the optimal point of HQ mineralization was obtained using the desirability function, available in the Statistic software. This function allows the transformation of each response variable into an individual function, ranging from 0.0 (very undesirable) to 1.0 (very desirable). The dependent variables were chosen to achieve greater overall desirability. Table 6 lists the values of the critical point calculated using this desirability function.
| Factor | Minimum observed | Critical values | Maximum observed |
|---|---|---|---|
| pH | 8.54 | 9.33 | 11.66 |
| R H | 81.72 | 110 | 138.28 |
Table 6: Values of the critical points, factors (pH and R), for the TOC conversion.
Predicted value for TOC (%) at the critical point (optimal) = 80.77 Table 6: Values of the critical points, factors (pH and R), for the TOC conversion.
Figure 4 shows the predicted value for hydroquinone mineralization at the critical point, and this value is approximately 81% for predicted values, pH and RH, respectively.

Oliveira, et al. [46] recently reported the treatment of effluent containing p-cresol through an advanced oxidation process in a batch reactor to identify the most significant process variables and propose an optimization approach for complete p-cresol degradation and maximum TOC conversion. In this research, the Desirability function method was used with the variables (R and F) to obtain optimization for TOC conversion. Thus, the application of the Desirability function to the experimental data with T of 90°C pointed to the following conditions as the optimal ones for TOC conversion: R= 78%, and F= 120 L h−1. The results shows that the Desirability function achieved the highest value (d= 0.88572) for R= 78%, and TOC conversion of 62.6%. The curves correlated to air flow suggest maximum points (d= 0.88572, TOC= 62.6%) for F= 120 L h-1. The upper curve (on the right) suggests that the maximum TOC conversion of 64% (d= 1) can be achieved for optimized values of R and F.
Test at the Optimal Point
Table 7 shows the values obtained for o TOC conversion after 180 min. Thus, with the values of the variable pH (9.3) and RH (110%) from the critical point (optimal point) obtained through the desirability function triplicate tests were performed to determine the mineralization of hydroquinone.
The experimental results obtained in the TOC conversion (80.1%) after 180 min of the process, confirm the prediction made by the desirability function. This predicts a mineralization of approximately 81% for TOC conversion (Figure 4) in 180 min, in the oxidation reaction of hydroquinone, using the values of factors (pH and RH) at the optimal point.
| Time (min) | TOC (mg L-1) | TOC (%) |
|---|---|---|
| 0 | 323.12 | 0 |
| 20 | 307.76 | 4.8 |
| 40 | 236.92 | 26.7 |
| 60 | 185.88 | 42.5 |
| 80 | 143.16 | 55.8 |
| 100 | 98.16 | 69.7 |
| 120 | 89.38 | 72.3 |
| 140 | 77.36 | 76.2 |
| 160 | 67.92 | 79.1 |
| 180 | 64.52 | 80.1 |
Table 7: Hydroquinone Oxidation Reactions with TOC conversion.
Operational parameter: RH= 110%, pH= 9.3, T=900C, QAF= 50 L h‒1. Table 7: Hydroquinone Oxidation Reactions with TOC conversion.
Process Modeling by Artificial Neural Networks
The ANNs were evaluated by the sum of the errors. Thus, the ANN with a 5:4:1 configuration presented the ideal features, with the lowest error and the highest accuracy. In this study, the logistic sigmoidal activation function was used for the neural network hidden layer, and a logistic exponential activation function was used for the neural network output. Approximately 50,000 neural networks were tested for training, of which the best 10 results were selected for evaluation. The minimum and maximum numbers of neurons in the hidden layer were three and six, respectively. Among the 1000 trained networks, the 10 best networks were retained. Table 8 shows the 10 neural networks chosen according to training, testing, and validation, and index 2 presented a better configuration with an error sum equal to 0.011.
| Index | Network | Training error | Test error | Validation error | Hidden activation | Output activation | Sum error |
|---|---|---|---|---|---|---|---|
| 1 | MLP 5:3:1 | 0.004 | 0.0031 | 0.0076 | Logistic | Exponential | 0.0147 |
| 2 | MLP 5:4:1 | 0.0036 | 0.0032 | 0.005 | Logistic | Exponential | 0.0117 |
| 3 | MLP 5:6:1 | 0.004 | 0.0035 | 0.0056 | Logistic | Exponential | 0.013 |
| 4 | MLP 5:3:1 | 0.0061 | 0.004 | 0.0063 | Logistic | Exponential | 0.0163 |
| 5 | MLP 5:3:1 | 0.0056 | 0.0035 | 0.0064 | Logistic | Exponential | 0.0155 |
| 6 | MLP 5:3:1 | 0.005 | 0.0035 | 0.0053 | Exponential | Exponential | 0.0137 |
| 7 | MLP 5:5:1 | 0.0061 | 0.0033 | 0.0183 | Exponential | Exponential | 0.0276 |
| 8 | MLP 5:3:1 | 0.006 | 0.0032 | 0.006 | Exponential | Logistic | 0.0152 |
| 9 | MLP 5:5:1 | 0.0041 | 0.0035 | 0.0063 | Logistic | Exponential | 0.014 |
| 10 | MLP 5:5:1 | 0.0041 | 0.0034 | 0.007 | Logistic | Exponential | 0.0145 |
Table 8: ANN used according to training, testing and validation.
Table 8 shows the best 10 models tested. And of these 10 models, the best result was obtained in the second index with a configuration of 5:4:1, also shown and proven in Figure 5A, due to the lower sum of errors in training, testing and validation. Thus, the minimum explained variable was 0.9614.
Table 9 shows the weights (W1 and W2) of the input and output variables, and the hidden layer/input (bias) obtained by the ANN for the TOC conversion. In this ANN, an MLP with a 5:4:1 design was obtained that corresponded five input data (t, pH, T, QAF, and RH), four neurons in the hidden layer and one output results (TOC conversion). The consistency of the results obtained (output variable) was observed from the data modeled by the neural network and presented according to the experimental results, for the data set of training, testing and validation. Neural network training was used to adjust ANN weights and the test to evaluate its configuration.
| Conections | W 1 | W 2 | |||||
|---|---|---|---|---|---|---|---|
| No. of neurons | t (min) | pH(‒) | T (0C) | Q AF(L h-1) | R H(%) | Layer/Input (Bias) | Output/TOC conversion |
| 1 | -0.25 | 0.4009 | 0.4884 | -2.532 | -2.672 | 1.0859 | -1.6556 |
| 2 | 3.441 | -2.9039 | -1.2909 | -0.694 | -1.635 | 0.3659 | 4.1162 |
| 3 | -4.83 | -0.9765 | -10.763 | 0.8507 | -0.688 | 4.0423 | -4.1284 |
| 4 | 0.501 | -2.1527 | -1.158 | -1.721 | -2.543 | 3.3366 | -3.7797 |
| HLa | 0.2698 |
Table 9: Weight values between the input and output layers, W1, and between the hidden and output layers, W2, for TOC conversion.
aHL: hidden layer/(bias). Table 9: Weight values between the input and output layers, W1, and between the hidden and output layers, W2, for TOC conversion.
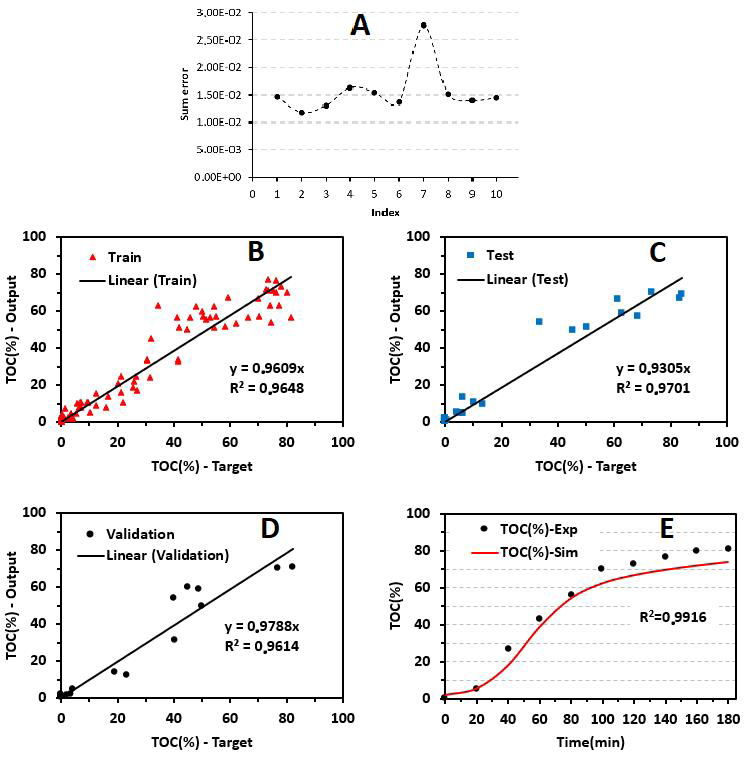
Figure 5A shows the behavior presented by the best ten ANNs retained based on a low sum of errors in training, testing, and validation. These neural networks were compared, and although ANN 7 showed a small variation in its interval, it was observed that the other ANNs had practically the same sum of errors. However, ANN 2 was chosen because it had the lowest sum of errors.
The ANNs selected had four neurons in the hidden layer. Figures 5B, 5C, and 5D show the data generated by neural network modeling of the dataset, compared with the experimental results based on the TOC conversion (%). To observe the consistency of the results obtained (output variable) by ANN, the figures were generated based on the calculated data, presented according to the experimental results for the training, test, and validation data sets. The linear correlation factors (R2) were obtained through a linear fitting of the configuration of the analyzed network.
These results show the good agreement of the data simulated by the network with the experimental data used for the training, test, and validation, and that represent well the behavior of the system. The validation showed a slightly lower linear correlation index when compared to training and testing of the network, but the models presented a good fit of the calculated data, with the following linear correlations: training, R2= 0.9648; test, R2= 0.9701; and validation, R2 = 0.9614. Figure 5E shows the predicted values of TOC conversion together with the experimental results (mean of three values of the test results at the optimal point for HQ oxidation). The prediction of the neural network was a good approximation to the experimental results for TOC conversion at the optimal point, with linear correlation R2= 0.9916.
Brandao, et al. [27] studied an unconventional advanced oxidation processes for phenolic compounds, and obtained in the experimental results for total organic carbon (TOC)
conversion (>30%) for a given rate of evaporation for the liquid phase (<11%) and effluent temperature (70– 78°C). The ANN-type MLP with a 4:4:2 configuration for the construction of RSM proved to be satisfactory for a correlation coefficient (R2) of 0.999 for TOC conversion.
Conclusions
The results obtained during this research showed that the TOC conversion values increased. Furthermore, highest TOC conversion with pH (10.1) and RH (%) (110), respectively were obteined, approximately, 80%, showing the excellent efficiency of the method to obtain the best optimized process conditions, allowing a twofold increase in hydroquinone mineralization. According to the tests performed at the optimal point (pH= 9.3, RH= 110%), the prediction made by applying the desirability function was validated, obtaining a mineralization of 80.10%, and the value prediction of the TOC was 80.76%. The ANN had a 5:4:1 configuration at the 10 best networks retained with the lowest error sum equal to 0.011 for training, testing, and validation were observed for the ANN-type MLP. ANN shows four neurons in the hidden layer to predict the most accurate response to TOC conversion. The results obtained by ANN presented to be a good agreement due to linear adjustment for the configuration of the analyzed network, with linear correlations: training (R2= 0.9648), test (R2= 0.9701) and validation (R2= 0.9614). In the study obtained by ANN mathematical modeling for the construction of RSM proved to be efficient, in relation to the experimental results, performed from the experimental planning RCCD, being the best quadratic model that fits the experimental data. Thus, the results achieved in this research corroborate with the experimental data, to obtain greater TOC conversion (>80%), at the reaction time (t) (180 min), with the most important operating variables for the process (pH= 9.3, T= 90 °C, RH= 110% and QAR= 50L h-1).
Acknowledgement
The authors wish to express thanks to the Studies for the National Council for Scientific and Technological Development˗CNPq for awarding research grants. The authors also would like to thank Editage (www.editage.com) for English language editing.
Conflict of Interest Statement
On behalf of all authors, the corresponding author states that there is no conflict of interest.
References
-
Wang Y, Wang X, Li M, Dong J, Sun C, et al. (2018) Removal of pharmaceutical and personal care products (PPCPs) from municipal waste water with integrated membrane systems, MBR-RO/NF. Int J Environ Res Public Health 15(2): 269.
-
Alkhuraiji TS, Boukari SOB, Alfadhl FS (2017) Gamma irradiation-induced complete degradation and mineralization of phenol in aqueous solution: effects of reagent. J Hazard Mater 328: 29-36.
-
Farah MA (2012) Processamento de Petroleo e Gas: Petroleo e seus Derivados, Processamento Primario, Processos de Refino, Petroquimica. LTC Rio de Janeiro, Brazil.
-
Fedorov K, Plata-Greyly M, Khan JA, Boczkaj G (2020) Ultrasound-assisted heterogeneous activation of per sulfate and peroxymonosulfate by asphaltenes for the degradation of BTEX in water. J Hazard Mater 397: 122804.
-
Gorla FA, Tarley CRT (2014) Determinacao Simultanea de Hidroquinona, Catecol, Guaiacol e 4-Nitrofenol Empregando Eletrodo de Nanotubo de Carbono e Surfactante. Sociedade Brasileira de Quimica, Natal.
-
Iliuta I, Iliuta MC (2022) Intensified phenol and p-cresol biodegradation for wastewater treatment in counter current packed-bed column bioreactors. Chemosphere 286(Pt 2): 131716.
-
Jun LY, Yon LS, Mubarak NM, Bing CH, Pan S, et al. (2019) An overview of immobilized enzyme technologies for dye and phenolic removal from waste water. J Environ Chem Eng 7(2): 102961.
-
Mukherjee M, Goswami S, Banerjee P, Senguptha S, Das P, et al. (2019) Ultrasonic assisted graphene oxide nanosheet for the removal of phenol containing solution. Environ Technol Innovation 13: 398-407.
-
Razzaghi M, Karimi A, Ansari Z, Aghdasinia H (2018) Phenol Removal by HRP/GOx/ZSM-5 from aqueous solution: Artificial neural network simulation and genetic algorithms optimization. J Taiwan Inst Chem Eng 89: 1-14.
-
Siebert APF, Silva ACB, Moraes CM, Bezerra RS, Silva LCM, et al. (2020) Utilizacao da _Moringa oleifera_ Lam e da radiacao solar no tratamento de agua para consumo humano. Braz J Dev 6(11): 86102-86129.
-
USEPA (1989) United States Environmental Protection Agency. Laws & Regulations.
-
Abugazleh MK, Rougeau B, Ali H (2020) Adsorption of catechol and hydroquinone on titanium oxide and iron (III) oxide. J Environ Chem Eng 8(5): 104180.
-
Jae-Young Kim JY, Moon J, Lee JH, Jin X, Choi JW, et al. (2020) Conversion of phenol intermediates into aromatic hydrocarbons over various zeolites during lignin pyrolysis. Fuel 279: 118484.
-
Berenguer CF, Brandao YB, Benachour M (2018) Estudo de Tratamento de agua em Efluentes Refratarios por Processo Fenton para Degradacao e Mineralizacao desses Compostos em Reator de escala Laboratorial Modelo PARR. Anais da II MEMU, pp: 139-155.
-
Chandana L, Subrahmanyam Ch (2018) Degradation and mineralization of aqueous phenol by an atmospheric pressure catalytic plasma reactor. J Environ Chem Eng 6(3): 3780-3786.
-
Shim J, Kumar M, Goswami R, Mazumder P, Oh BT, et al. (2019) Removal of p-cresol and tylosin from water using a novel composite of alginate, recycled MnO2 and activated carbon. J Hazard Mater 364: 419-428.
-
Xiao M, Qi Y, Feng Q, Li K, Fan K, et al. (2021) p-Cresol degradation through Fe(III)-EDDS/H2O2 Fenton-like reaction enhanced by manganese ion: Effect of pH and reaction mechanism. Chemosphere 269: 129436.
-
Brandão YB, Oliveira JGC, Benachour M (2017) Phenolic Waste waters: Definition, Sources and Treatment Processes. In: Marcos SH, et al. (2017) Phenolic Compounds: Natural Sources, Importance and Applications. Intech, Rijeka-Croatia, pp: 323-342.
-
Duan WY, Meng FP, Cui HW, Lin Y, Wang G, et al. (2018) Ecotoxicity of phenol and cresols to aquatic organisms: a review. Ecotoxicology Environ Saf 157: 441-456.
-
Enguita FJ, Leitao AL (2013) Hydroquinone: environmental pollution, toxicity, and microbial answers. Biomed Res Int 2013: 542168.
-
Chen T, Chen Y, Rehman HU, Chen Z, Yang Z, et al. (2018) Ultra tough, self-healing, and tissue-adhesive hydrogel for wound dressing. ACS Appl Mater Interfaces 10(39): 33523-33531.
-
Ribeiro ALT, Shimada ALB, Hebeda CB, de Oliveira TF, de Melo Loureiro AP, et al. (2011) In vivo hydroquinone exposure alters circulating neutrophil activities and impairs LPS-induced lung inflammation in mice. Toxicol 288(1-3): 1˗7.
-
Dong RF, Chen DY, Li NJ, Xu Q, Li H, et al. (2020) Removal of phenol from aqueous solution using acid- modified Pseudomonas putida-sepiolite/ ZIF-8 bio- nanocomposites. Chemosphere 239: 124708.
-
Bari MdA, Kindzierski WB (2018) Ambient volatile organic compounds (VOCs) in Calgary, Alberta: Sources and screening health risk assessment. Sci Total Environ 631˗632: 627-640.
-
Yang L, Si B, Martins MA, Watson J, et al. (2018) Improve the biodegradability of post hydrothermal liquefaction wastewater with ozone conversion of phenols and N-heterocyclic compounds. Water Sci Technol 2017(1): 248-255.
-
Jimenez S, Andreozzi M, Mico MM, Alvarez MG, Contreras S (2019) Produced water treatment by advanced oxidation processes. Sci Total Environ 666: 12˗21.
-
Brandao YB, Fernando FSD, Oliveira DC, Zaidan LEMC, Teodosio JR, et al. (2021) Unconventional advanced oxidation technique: Evaporation liquid rate and phenolic compounds degradation evaluation and modelling/optimization process with CFD, RSM and ANNs. Fuel 300: 120967.
-
Zhou K, Zhang J, Xiao Y, Zhao Z, Zhang M, et al. (2020) High-Efficiency Adsorption of and Competition between Phenol and Hydroquinone in Aqueous Solution on Highly Cationic Amino-Poly (vinylamine)-Functionalized GO- (o-MWCNTs) Magnetic Nanohybrids. Chem Eng J 389: 124223.
-
Broccoli F, Paparo R, Lesce MR, Serio MD, Russo V (2023) Heterogeneous Photodegradation Reaction of Phenol Promoted by TiO2: A Kinetic Study. Chem Engineering 7(2): 27.
-
Costa GS, Althoff CA, Schneider JT, Peralta-Zamora P (2019) Advanced Oxidation Processes to the Remediation of Liquid Residue from the Thermal Treatment of Oily Sludge. J Braz Chem Soc 30(7).
-
Li B, Zhi-Ying Y, Liu XN, Tang C, Zhou J, et al. (2019) Enhanced Bio-Electro-Fenton degradation of phenolic compounds based on a novel Fe–Mn/Graphite felt composite cathode. Chemosphere 234: 260-268.
-
Jingkun Na, Nan Li, Yu Wu, Wang S, Liao C, et al. (2020) Revealing Decay Mechanisms of H2O2-Based Electrochemical Advanced Oxidation Processes after Long-Term Operation for Phenol Degradation Environ Sci Technol 54(17): 10916-10925.
-
Paiva EJD (2008) Optimization of manufacturing processes with multiple responses based on capability Indices. Masters Dissertation, University Federal of Itajubá, Brazil.
-
Kim Z, Shin Y, Yu J, Kim G, Hwang S, et al. (2019) Development of NOx removal process for LNG evaporation system: Comparative assessment between response surface methodology (RSM) and artificial neural network (ANN). J Ind Eng Chem 74: 136-147.
-
Pelalak R, Alizadeh R, Ghareshabani E, Heidari Z (2020) Degradation of sulfonamide antibiotics using ozone- based advanced oxidation process: Experimental, modeling, transformation mechanism and DFT study. Sci Total Environ 734: 139446.
-
Mohammadi L, Zafar MN, Bashir M, Sumrra SH, Shafqat SS, et al. (2021) Modeling of phenol removal from water by NiFe2O4 nanocomposite using response surface methodology and artificial neural network techniques. J Environ Chem Eng 9(4): 105576.
-
Rahmani AR, Poormohammadi A, Zamani F, Birgani YT, Jorfi S, et al. (2018) Activated persulfate by chelating agent Fe·/complex for in situ degradation of phenol: intermediate identification and optimization study. Res Chem Intermed 44: 5501-5519.
-
Nascimento CAO, Giudici R, Guardani R (2000) Neural network based approach for optimization of industrial chemical processes. Computer Chem Eng 24(9-10): 2303-2314.
-
Heo S, Lee JH (2018) Fault detection and classification using artificial neural networks. IFAC-Papers OnLine 51(18): 470-475.
-
Brandao Y, Teodosio J, Dias F, Eustaquio W, Benachour M (2013) Treatment of phenolic effluents by a thermochemical oxidation process (DiCTT) and modelling by artificial neural networks. Fuel 110: 185- 195.
-
Brandão YB, Oliveira DC, Dias FFS, Teodosio JR, Oliveira JGC, et al. (2023) Thermochemical advanced oxidation process by DiCTT for the degradation/mineralization of effluents phenolics with optimization using response surface methodology and artificial neural networks modelling. Pet Petro Chem Eng J 7(1): 1-21.
-
Kasiri MB, Aleboyeh H, Aleboyeh A (2008) Modeling and optimization of heterogeneous photo-fenton process with response surface methodology and artificial neural networks, Environ Sci Technol 42(21): 7970-7975.
-
Teodosio JR, Brandao YB, Oliveira DC (2023) Treatment of effluents containing hydroquinone in a batch reactor: Optimization technique via RSM, MAGM and kinetic modelling. Energies 7: 000341.
-
Galdámez EVC, Carpinetti LCR (2004) Aplicacao das tecnicas de planejamento e analise de experimentos no processo de injecao plastica. Gest Prod 11(1): 121˗134.
-
Silva JGC (2007) Estatistica experimental: planejamento de experimentos. Pelotas, Rio Grande do Sul.
-
Oliveira JGC, Brandão YB, Oliveira DC, Teodosio JR, Moraes CM, et al. (2023) Treatment treatment of effluent containing p-cresol through na advanced oxidation process in a batch reactor: kinetic optimization. Energies 16(13): 5027.
-
Semenov SA, Reznik AM (2013) Molecular design of the phenol type extractants. Springerplus 2(1): 120.
-
Derringer G, Suich R (1980) Simultaneous optimization of several response variables. J Qual Technol 12: 214- 219.
-
Connors KA, Amidon GL, Stella VJ (1986) Chemical stability of pharmaceuticals: a handbook for pharmacists. 2nd(Edn.), John Wiley, New York, pp: 864.
-
Norouzi M, Fazeli A, Tavakoli O (2020) Phenol contaminated water treatment by photocatalytic degradation on electrospun Ag/TiO2 nanofibers: Optimization by the response surface method. J Water Process Eng 37: 101489.
-
Ji R, Chen J, Liu T, Zhou X, Zhang Y, et al. (2021) Critical review of perovskites-based advanced oxidation processes for wastewater treatment: Operational parameters, reaction mechanisms, and prospects. Chin Chem Lett 33(2): 643-652.
-
Brandão Y, Teodosio J, Benachour M (2010) Study of the effect of excess air and the dissipated power of the burner on the capacities of the DiCTT process in the treatment of liquid phenolic effluents. Rev Iberoam Sist Cib Inf 7(2): 1-9.
-
Benali M, Guy C (2007) Thermochemical oxidation of phenolicladen liquid effluent models. Journal of Environmental Engineering Science, 6: 543-552.
-
Barrault J, Abdellaoui M, Bouchoule C, Majesté A, Tatibouët JM, et al. (2000) Catalytic wet peroxide oxidation over mixed (Al–Fe) pillared clays. Applied Catalysis B: Environmental 27(4): 225-230.
- Nigeria’s Vulnerability in the Face of Global Energy Policy
- A Simulation Study of Investigation of Optimum Oil Production Performance by Applying Various Gas Injection Methods in Oil Reservoir
- Characterization of Permo-Triassic Reservoirs through Thermal Maturity Assessment of Westphalian Source Rocks in the Cheshire Basin
- Influence of Microwax on the Rheological and Thermal Behaviour of a Wax Crude Oil
- Real-Time Monitoring and Performance Optimization of Steam Injection in Heavy Oil Reservoirs Using Fiber Optic Sensing and Integrated Predictive Simulation Models
- Rapid On-Site Determination of the Total Petroleum Hydrocarbon Content of Soils by Handheld Fourier Transform Near-Infrared Spectroscopy: Development of a Global, Site- and Scanner- Independent Calibration Model