Streams of High-Energy Solar Alpha Particles - The Cause of Both Rising Global Temperature (Global Warming) and Partly Human Mortality?
In the present work, the author presents arguments that global warming of at least the last 70 years is partly or entirely caused by changes in the solar magnetic field and is probably a consequence of ionizing radiation emitted as a result of solar activity. The ionizing radiation is positively charged particles with high energy. They penetrate deep into the Earth's atmosphere, creating in the atmosphere an increased content of ions serving as condensation nuclei, which increases cloudiness in the lower atmosphere and lowers the surface air temperature. When solar activity decreases as observed in the last 70 years, the reverse process occurs – cloud cover decreases, more solar electromagnetic radiation reaches the earth's surface and increases the temperature. An additional argument for the presence of high-energy radiation that penetrates deeply into the earth's atmosphere and reaches the earth's surface is the high statistically significant correlation between the fluxes of such radiation recorded by GOES series satellites in a geostationary orbit (36000 km above the earth's surface) and the human mortality from deadliest diseases
Introduction
In the Synthesis Report, “CLIMATE CHANGE 2023”, Summary for Policymakers, in the first chapter “A. Current Status and Trends, Observed Warming and its Causes” the authors from the Intergovernmental Panel on Climate Change (IPCC) claim: “Human activities, mainly through emissions of greenhouse gases, have unequivocally caused global warming, with the global surface temperature reaching 1.1°C above 1850-1900 in 2011-2020 [1]. In modern times, the thesis quoted above has become the dominant scientific paradigm about global warming. In the present work, the author presents arguments that global warming of at least the last 70 years is partly or entirely caused by changes in the solar magnetic field and is probably a consequence of ionizing radiation emitted as a result of solar activity. The ionizing radiation is positively charged particles with high energy.
They penetrate deep into the Earth’s atmosphere, creating in the atmosphere an increased content of ions serving as condensation nuclei, which increases cloudiness in the lower atmosphere and lowers the surface air temperature. When solar activity decreases as observed in the last 70 years, the reverse process occurs – cloud cover decreases, more solar electromagnetic radiation reaches the earth’s surface and increases the temperature. An additional argument for the presence of high-energy radiation that penetrates deeply into the earth’s atmosphere and reaches the earth’s surface is the high statistically significant correlation between the fluxes of such radiation recorded by GOES series satellites in a geostationary orbit (36000 km above the earth’s surface) and the human mortality from deadliest diseases.
Material and Methods
In connection with the described study, 3 types of data were collected and processed, obtained from reliable sources – globally recognized databases of NOAA, NASA, EUROSTAT, and US National Center for Health Statistics –
- Data on the surface temperature,
- On the solar corpuscular radiation with high energy, reaching the Earth’s orbit, and
- For mortality in the human population from causes, mostly diseases, supposedly dependent on said solar radiation.
The joint study of the three types of data allowed a conclusion to be drawn as to the cause of an invisible chain of interconnected phenomena, to which, in the humble opinion of the author, global warming is also connected.
Temperature Data
In Bulgaria, a network of several dozen meteorological stations has existed since the last quarter of the 19th century. For some of the stations, such as the one in Stara Zagora, there is an almost continuous series of surface temperature data with a length of 126 years. Meteorological data for some major stations are published every year and are freely available in the country’s statistical yearbook prepared by the National Statistical Institute. Meteorological data for the individual stations were also obtained upon request by the National Institute of Meteorology and Hydrology. For four of the meteorological stations in the country, data are also available through the NOAA website, National Climatic Data Center, in the Global Historical Climatology Network daily (GHCNd) database [2]. The ground temperature data for the rest of the world is also from this database. The study used data on average annual temperatures over the last 90 years and included only stations whose data had a series length of at least 50 years. Unfortunately, this requirement is met by a very small number of stations around the world – a few dozen.
Solar Activity Data
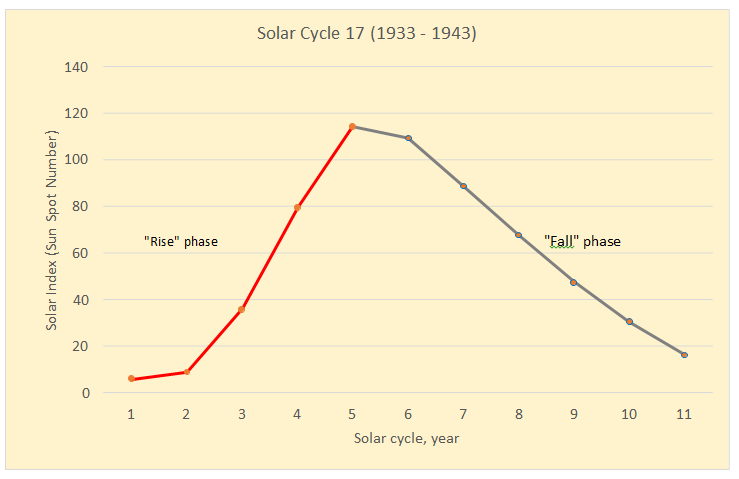
The solar substance is in a plasma state – a mixture of particles with a positive charge (protons and alpha particles) and a negative charge (electrons). Rising from deep to the surface of the Sun, heated flows of plasma (convection) export energy that leaves the Sun in the form of electromagnetic radiation. The solar magnetic field changes cyclically with a period of about 22 years. Its change is observable because in phases of field growth (solar activity) areas of increased magnetic field on the visible surface of the Sun (photosphere) have reduced convection, as a result of which they are cooler, emit less radiation, and from a great distance they appear darker (sunspots). Along with the appearance of spots during the active phase of the Sun, solar mass ejections (SME), explosive processes with increased radiation brightness (flares), etc. occur. Within a 22-year cycle, solar activity changes twice with a period of about 11 years (solar cycle). For more than two and a half centuries, solar activity has been monitored regularly through the number of sunspots (SSN, Solar Index). Each of its cycles gets a number. The Sun is currently nearing the maximum of its 25th cycle. Within the solar cycle, solar activity increases for several years (“rise” phase), reaches a maximum, and decreases (“fall” phase) to a minimum, (Figure 1). For different cycles, the maximum SSN varies, for the last 5 cycles (from the 18th to the 23rd, since the mid- 1950s) there has been a decline in the number of sunspots at the maxima of the cycles. SSN data were obtained from the sites [3, 4].
Solar Corpuscular Radiation Data
Satellite data on corpuscular radiation – protons and alpha particles recorded by the satellites of the two series SMS (Synchronous Meteorological Satellites) and GOES (Geostationary Operational Environmental Satellites) were obtained from an NOAA site [5]. The satellites of the SMS and GOES series fly in geostationary orbit (above the Earth’s equator), at an altitude of 36,000 kilometers above the Earth’s surface, make one lap in 24 hours, that is, they “hang” over a certain point on the Earth’s surface and are not shade by the Earth at their circumference around it. Data on alpha- particle and proton fluxes (unit: (number of particles).cm-2.s-1. sr-1.MeV-1)) with energies of the range 3.8 – 21.3 MeV were used. The fluxes were recorded by the satellite high-energy particle detectors:
- Energetic Particles Sensor (EPS), and
- Energetic Proton, Electron, and Alpha Detector (EPEAD), and
- High Energy Proton and Alpha Particles (HEPAD).
The data are available averaged over a 5-minute interval, during which there are up to 25 reports of the instrument. The frequency of solar fluxes of positively charged particles is higher during the rising phase in solar activity cycles.
Day and Night Cloud Data
Cloud data are recorded by the MODIS (Moderate Resolution Imaging Spectroradiometer) instruments on board the satellites EOS AM-1 (Earth Observing System, “Terra”), in orbit since December 1999, and EOS PM-1 (“Aqua”), in orbit since May 2002, flying in a sun-synchronous orbit 700 km above the Earth’s surface. Data on the relative fraction of monthly mean daytime and nighttime cloud cover during the 23rd solar cycle (from 2009 to 2018) were obtained from the NASA GIOVANNI database [6].
Mortality Data by Place and Cause of Death
The analysis below is based on the authoritative sources of health data – EUROSTAT [7] and the US National Center for Health Statistics (NCHS) [8]. In the study, the parameter annual mortality rate – number of deaths per 100,000 inhabitants was used as a characteristic of mortality. EUROSTAT offers free access to data on mortality rates from causes in the countries of the European Union, the European Economic Area, and the candidate countries for membership in the union. Geographically, these countries occupy Europe and the Mediterranean. Data are grouped by NUTS (Nomenclature Des Unités Territoriales Statistiques in French, the Nomenclature of Territorial Units for Statistics). Mortality data from the EUROSTAT shortlist in which mortality rates are grouped by causes of death into 88 groups, mostly diseases, were used in the study. The groups are related to the classes in the International Disease Classifier ICD-10, (10th revision). The shortlist contains mortality data for EU countries (NUTS-1) and EU regions (NUTS-2, smaller areas of the larger NUTS-1 countries). Currently (2023) the shortlist includes mortality rate data for the interval 2011 – 2020. Annual mortality rate data were extracted for 377 European regions (NUTS-2) separately from each of the shortlist groups for the interval 2011 – 2019 (the last pre- pandemic year).
Data Processing
Correlation analysis [9] was used for data processing. Separately, for each of dozens of meteorological stations on the surface of the planet with sufficient length of annual mean temperature data, mean surface air temperatures were calculated for the years of solar activity phase ”rise” Figure 1 for the eight solar cycles from the 17th to the 24th (from 1933 to 2018). For each of the stations, the obtained series of 8 mean temperatures were compared with the corresponding series of 8 mean SSNs for the phases “rise” of the same cycles. To assess whether there is a causal relationship between the solar activity phenomena and surface air thermal changes for a given station, the correlation coefficient between the two series of values – mean temperatures and mean SSNs – was calculated. In mathematical statistics, the level of statistical significance [9] is a parameter indicating the degree of reliability of the calculated correlation coefficient. The smaller the number of this parameter, the more reliably the correlation coefficient is established, i.e. the more reliably a cause-and-effect relationship has been established.
The correlation coefficient and the level of statistical significance are related. For the 8 solar cycles included in the study, a minimum correlation coefficient of 0.708 corresponds to a statistical significance level of 0.05, a minimum correlation coefficient of 0.835 corresponds to a statistical significance level of 0.01, and a minimum correlation coefficient of 0.925 corresponds to a statistical significance level of 0.001 [9]. In scientific studies, a level of statistical significance of 0.05 is accepted as a criterion for the reliability of the correlation coefficient. Correlation coefficients with a significance level less than 0.05 are of high reliability (the higher the number of the significance level, the lower the significance level of the correlation coefficient) i.e. the existence of a causal relationship between ground air temperature and SSN can be considered reliably established if their correlation coefficient is no less than 0.708 for data including 8 solar cycles.
Using the statistical method regression analysis, the coefficient of determination can be calculated, indicating the extent to which the variation in the independent variable, in this case, mean SSN, explains the variation in the dependent variable, in this case, surface air temperature. If the coefficient of determination is 1.000, the dependence between two processes is deterministic – the process effect depends only on the process cause. If the dependence is deterministic, there is no other cause independent of the first to intervene in the course of the process effect. An example of a deterministic process is the change in the magnitude of the electric current through a given wire – the effect depends on a single cause – the change in voltage between the two ends of the wire. If the dependence between two variables is linear and the value of the coefficient of determination is close to unity, the dependence is close to deterministic, the effect is influenced by only one cause and there is no other independent cause that affects the effect. In particular, if the variation of the surface air temperature is a linear consequence of the solar activity and the dependence has a coefficient of determination close to unity, only the solar activity intervenes in the variation of the surface air temperature. No other cause, independent from solar activity intervenes, in particular greenhouse gases in the air. Of course, the hypothetical possibility remains that solar activity is related to the emission of greenhouse gases, but such a hypothesis should explain why their concentration increases with the decreasing trend of solar activity in the last few decades.
Results
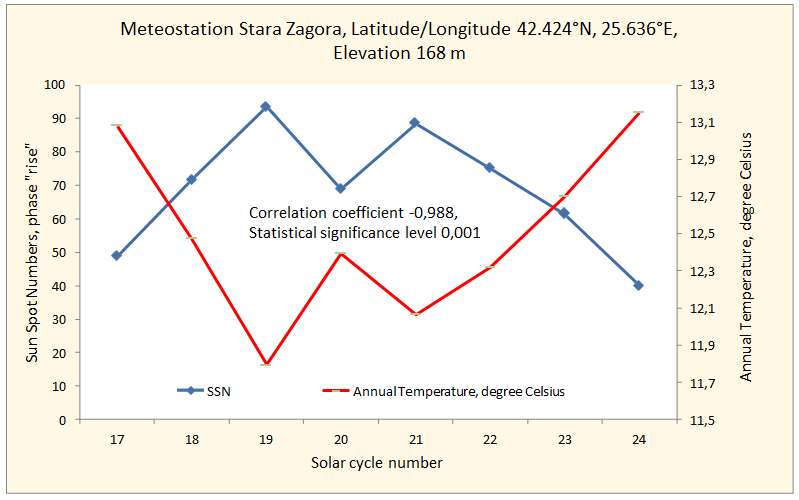
The examples shown below are for the Stara Zagora station, Bulgaria, due to the long accurate operation at the station – the surface air temperature data has a row length of 126 years. Figure 2 shows the relationship between the average value of the annual surface air temperatures measured at the Stara Zagora station, averaged for the phase “rise” of solar activity cycles with numbers from 17 to 24 (the cycles have a total duration of 86 years), and the average value of the annual SSNs for the rising phases for the same cycles of solar activity. There is a high negative statistically significant correlation between the two series of data, indicating the existence of a causal relationship between the two phenomena – temperature changes in the Stara Zagora region and solar activity. As solar activity increases within a particular cycle, the temperature decreases. Due to the decreasing trend in SSN values over the last five cycles and their negative correlation with temperature, the surface air temperature for the Stara Zagora region has been increasing in recent years.
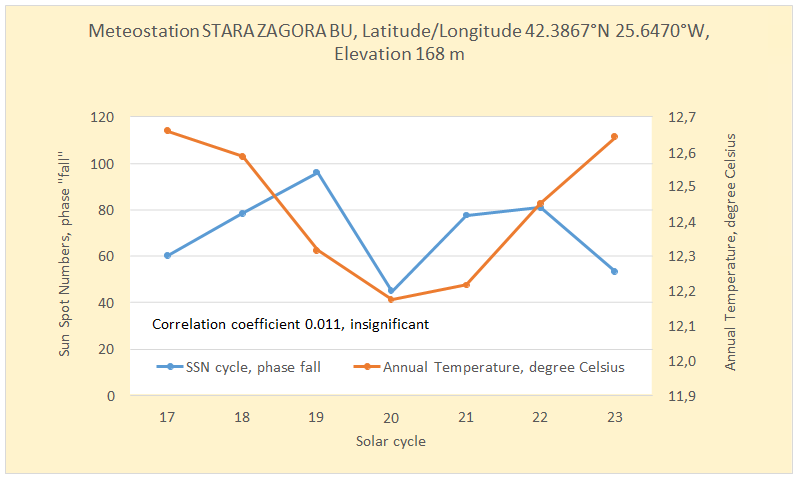
There is no correlation between the change in surface air temperature for the Stara Zagora region and the SSN for the phase “fall” of the solar cycles included in the study Figure 3. The change in temperature during the phase “fall” in solar activity cycles is below 0.5°C, while during the phase “rise” the temperature changes almost 3 times more – by 1.4°C.
It can be summarized that during the last several tens of years, the surface air temperature for the Stara Zagora region has been increasing during the phase “rise” of the solar cycles, because:
- It is negatively correlated with SSN during the same phase, and
- SSN has been decreasing over the past few cycles.
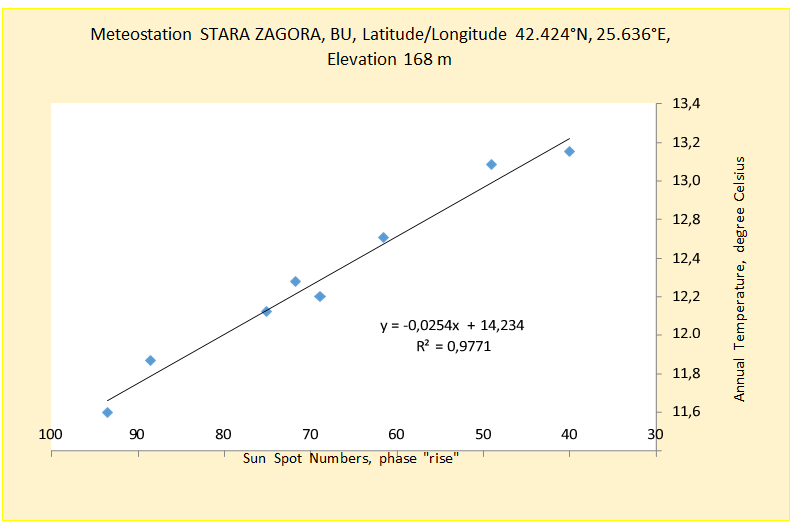
Figure 4 shows the dependence of the surface air temperature for the Stara Zagora region on the SSN for the phase “rise” of the solar cycles included in the study. The dependence is linear, with a high coefficient of determination R2 = 0.9771 (maximum value of 1.000). According to the explanation above, there is an almost deterministic linear dependence of the surface temperature due to a single cause – the solar activity characterized by SSN. The obtained result rejects the hypothesis of dependence of the rising temperature on the concentration of greenhouse gases, at least for the region of Stara Zagora. This conclusion is particularly impressive, as it was made for the Stara Zagora region, the air above which should contain an increased amount of carbon dioxide released from the burning coal in the powerful energy complex with thermal power plants located in the area. Since in a source region of greenhouse gases, their influence on the rising air temperature is negligible, the conclusion is that solar activity is the dominant, if not the only, cause of the global increase in air temperature in the last few decades.
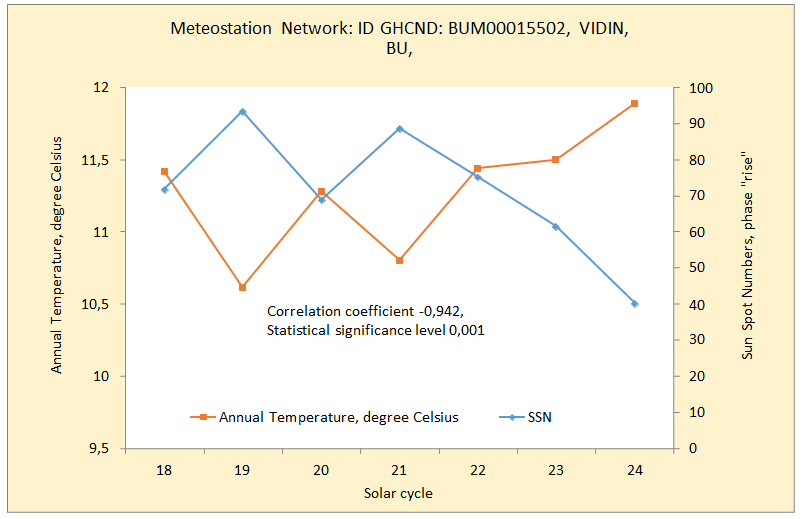
Figures 5-7 show other examples from meteorological stations in Bulgaria, showing the same dependence of surface air temperature on solar activity in the rising phase of the solar cycle, with a statistically significant correlation coefficient large in absolute value. The examples shown are only for some of the stations where this phenomenon is observed on the territory of Bulgaria.
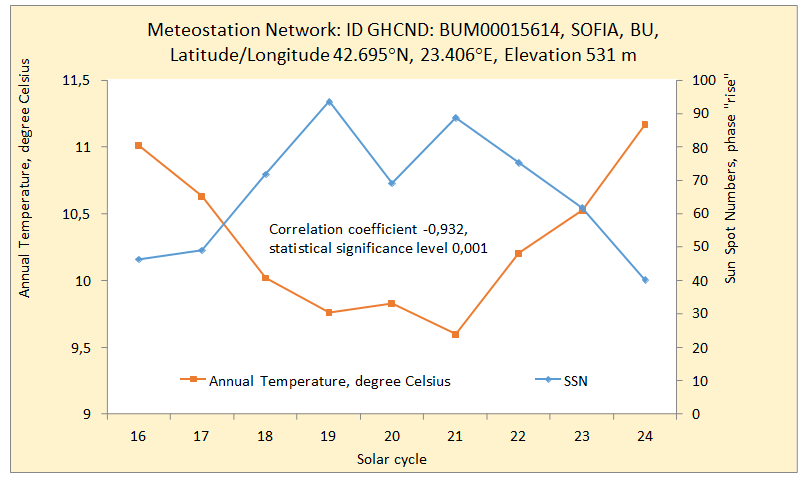
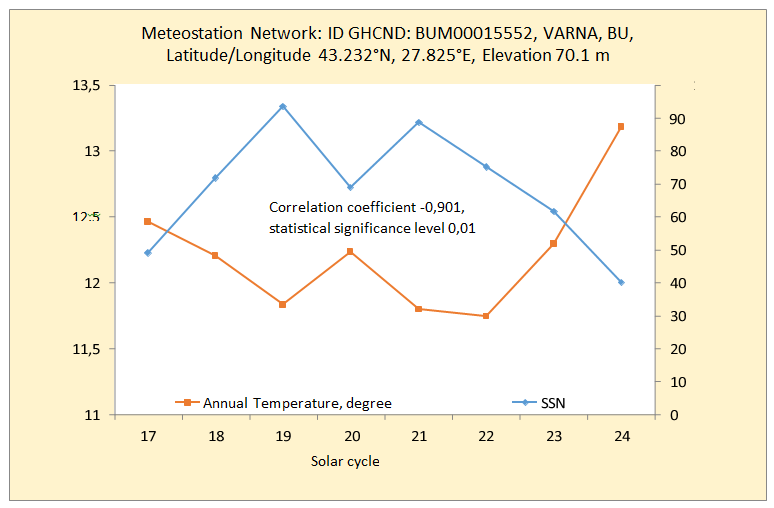
In varying degrees of manifestation, the described phenomenon is also observed in other weather stations around the world. Examples of a part of the dozens of stations where the phenomenon is observable are shown in Figures 8-11.
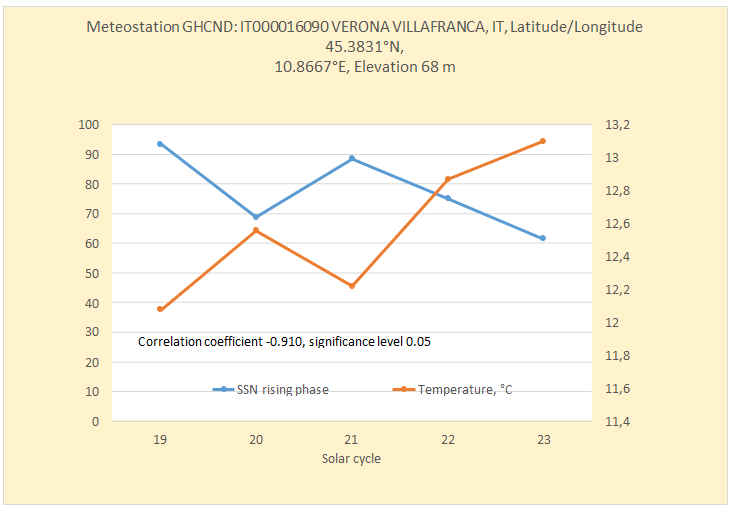
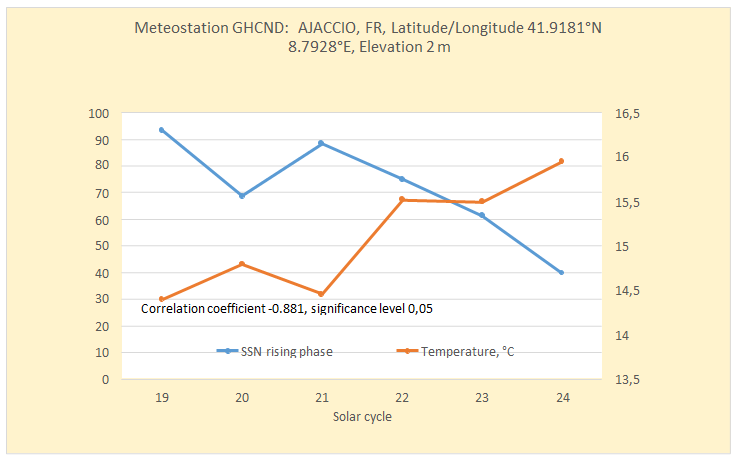
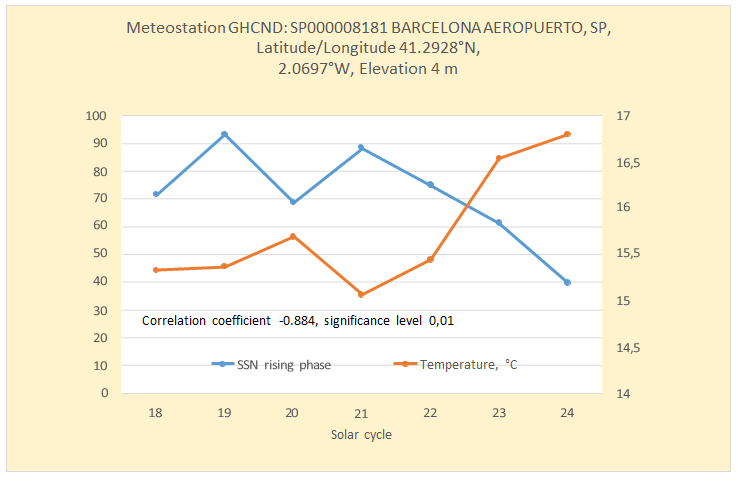
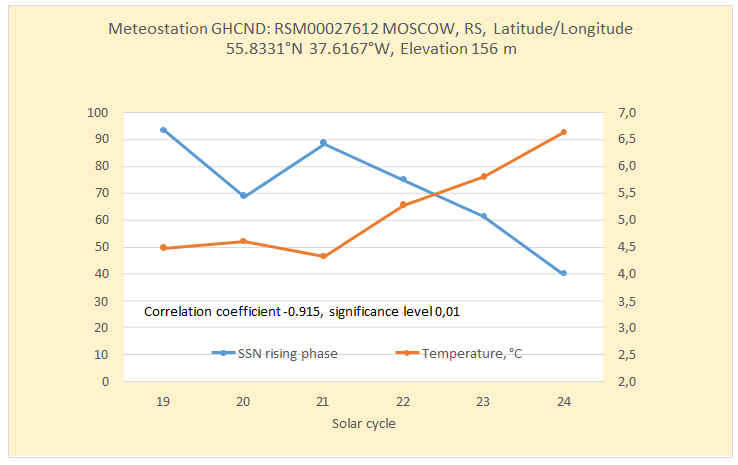
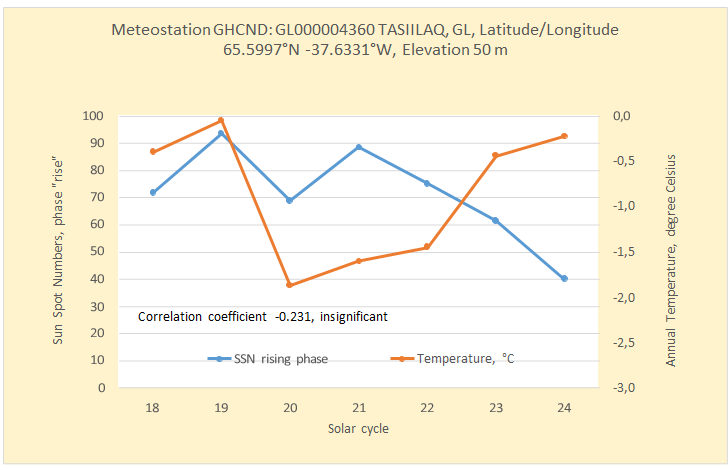
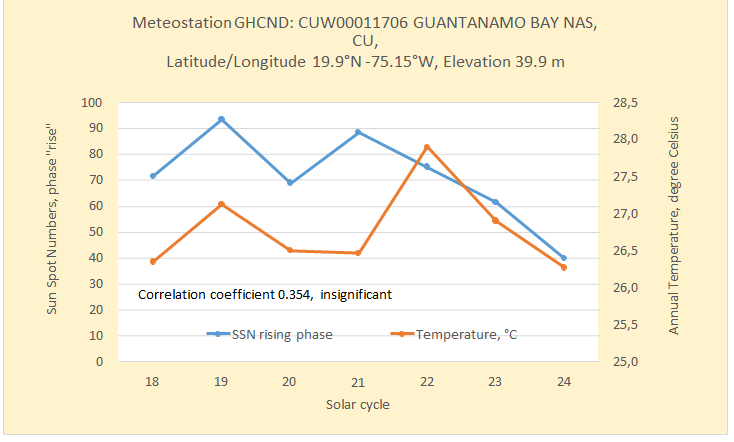
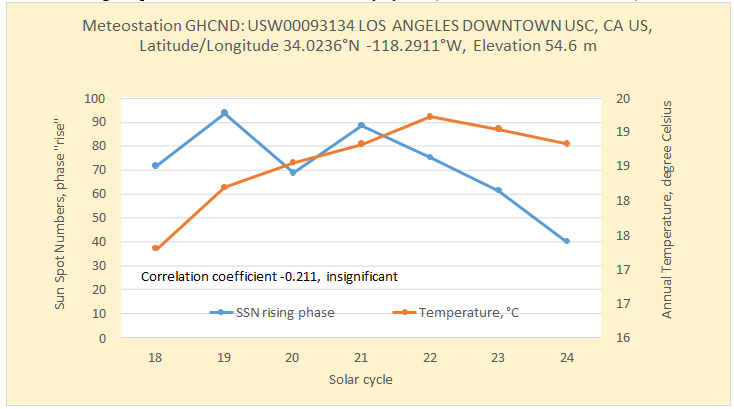
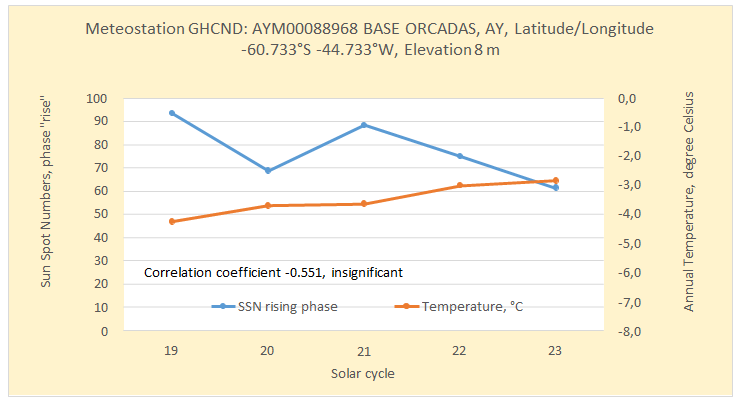
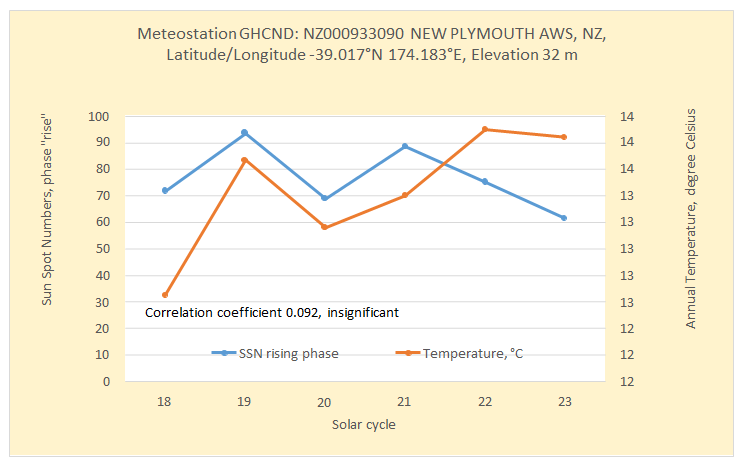
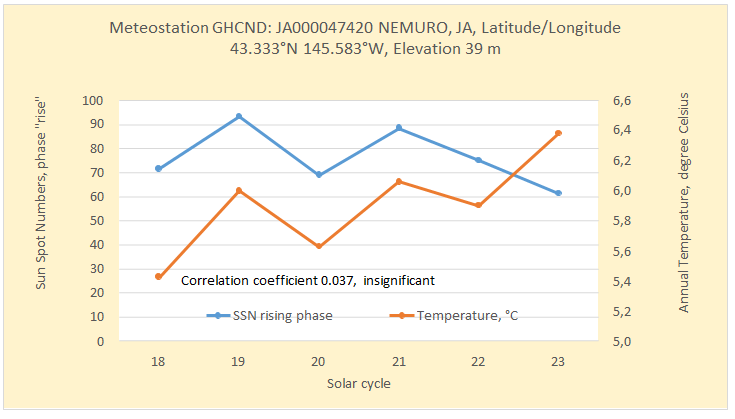
Figure 18 on a Google Earth map shows the location of several stations in the region of Europe for which there is data on the described phenomenon. Depending on the correlation coefficient between surface air temperature and SSN for the phase “rise” of the solar cycles, the markers of the stations are colored accordingly: with red color – very high (over -0.900) statistically significant correlation; with orange color high (above -0.800) statistically significant correlation, with yellow color – statistically insignificant correlation.
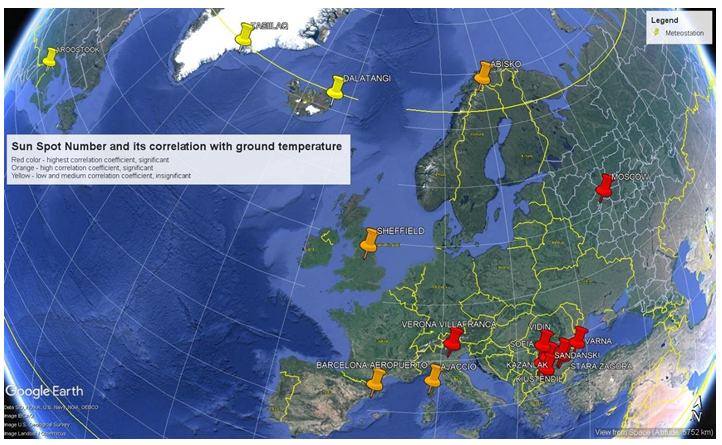
Figure 18: Google Earth map with stations from the Northern Hemisphere, the markers for which are colored depending on the magnitude of the correlation coefficient between surface air temperature and SSN for the phase “rise” of the solar cycles. With red color – a very high statistically significant correlation; with orange color high statistically significant correlation, with yellow color – a statistically insignificant correlation.
During a cycle with a high SSN maximum, a reduced emission of electromagnetic radiation from the solar photosphere should be expected due to the large number of sunspots darker than the average photosphere brightness. As a result, less solar energy would reach the Earth’s surface.
This would explain the lower temperature of the ground air during the “rise” phase of the solar cycle, as electromagnetic radiation absorbed by the earth’s surface supplies the energy that is converted into heat for the ground air. Such an effect is not observed due to the accompanying sunspot areas (faculae), brighter than the average brightness of the photosphere. The increased brightness of the faculae completely compensates for the decreased brightness of the photosphere in the sunspots region.
The area of the Earth’s surface in which the above- described phenomenon of negative correlation between the number of sunspots and the temperature of the surface air during the “rise” phase of the solar cycles is most clearly expressed is with reference coordinates 20°E, 40°N, 30°E, 50°N, covering part of the Balkans. Average monthly data on the flux of solar electromagnetic radiation reaching the Earth’s surface since 1980 have been obtained for this area [6]. The data covers the last four solar cycles – a total of 7 phases of solar activity of both types – “rise” and “fall” with values between 212 W.m-2 and 220 W.m-2. The comparison between the average fluxes of electromagnetic radiation during the two phases showed that there was no statistically significant difference between the fluxes. There are also no statistically significant correlations between the change in flows and the change in air temperatures in each of the phases, i.e. follows the conclusion that the described phenomenon is not related to changes in the Sun’s electromagnetic radiation.
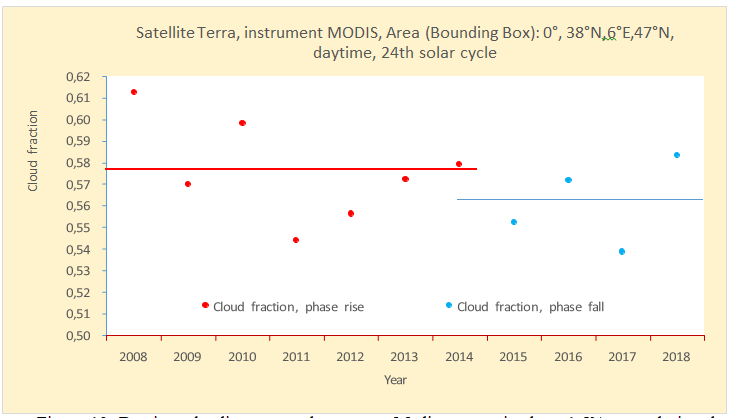
Data on the relative fraction of clouds covering the sky, separately for daytime and nighttime cloudiness, for two areas with high correlation coefficients between SSN and surface air temperature – the Balkans and the Western Mediterranean – were obtained from the onboard MODIS (or Moderate Resolution Imaging Spectroradiometer) instruments on the Terra and Aqua satellites [6]. The data has a row length only for the last complete solar cycle 24 (the planned life of the mentioned satellites was 6 years, Terra has been operating so far for more than 25 years, Aqua – 22 years). The short length of the data series makes the difference between daytime cloudiness for the two phases of the solar cycle – rising and falling – statistically insignificant. For both studied areas – the Balkans and the Western Mediterranean, during the “rise” phase of the solar activity cycle, the daily cloud fraction is higher than that of the “fall” phase according to the data of both satellites. The difference reaches 1.5% cloud fraction Figure 19. Increasing cloud shading during the daytime during the “rise” phase is a reasonable explanation for the decrease in surface temperature for this phase. The increased cloudiness may be due to the increased number of condensation nuclei in the atmosphere at the condensation level where the cloudiness forms. Condensation and, as a result, the formation of clouds depends on the presence of ions, which at a height of several kilometers are the only type of condensation nuclei around which water vapor forms droplets and, as a result, clouds.
The GOES series satellite data show that the positively charged particles with high energy – hydrogen and helium nuclei (protons and alpha particles), capable of ionizing the air, arrive from the Sun to the Earth [5]. Most often these particles do not penetrate deep into the Earth’s atmosphere to the ground layer – the troposphere, where clouds are formed, due to the deflecting effect of the Earth’s magnetic field and the energy losses in the collisions with the particles of the Earth’s atmosphere.
However, a study shows that positively charged high- energy solar particles, i.e. with a high ionization potential, probably penetrate the atmosphere and even reach the earth’s surface [10, 11, 12, 13, 14, 15, 16, 17, 18, 19, 20, 21, 22, 23]. The study reveals a high positive statistically significant correlation between fluxes of positively charged solar particles registered by GOES
satellites and human mortality, a phenomenon that could be explained by penetrating the particles through the atmosphere to the Earth’s surface. The most affected are the inhabitants of Europe and the Mediterranean.
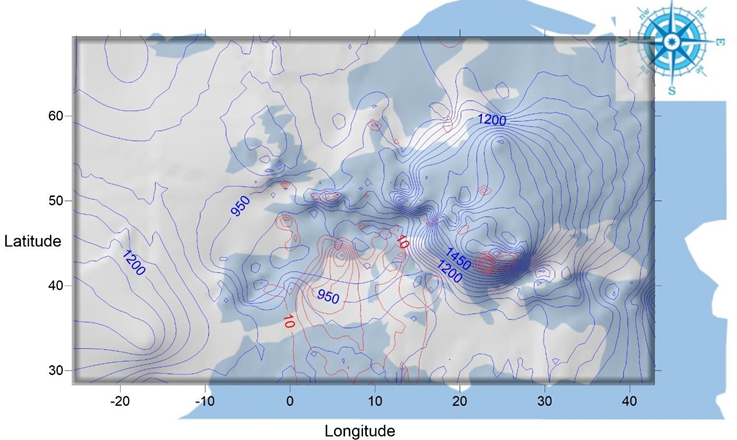
Figure 20 shows with blue isolines the distribution of mortality by the group cause “All causes of death (A00-Y89) excluding S00-T98” of EUROSTAT shortlist in 2012 – the year with the highest mortality for the studied interval years 2011 – 2019. The map was made from data for 377 NUTS- 2 regions on the territory of Europe and the Mediterranean. A region with increased mortality stands out over Eastern Europe with a maximum over the Central Balkans.
Red isolines show the distribution of the impact index of the annual flux of solar alpha radiation recorded by the GOES series satellites for the studied interval years 2011 – 2019 on mortality in each of the NUTS-2 regions. The index was calculated as a weighted sum of the number of statistically significant correlations for the studied interval of years between the annual mortality by groups of causes and the annual flux of solar alpha radiation for each of the regions separately. The number of correlations is divided into three groups depending on their levels of statistical significance – most significant, above 0.001, with medium significance between 0.001 and 0.01, and with least significance between 0.01 and 0.05. In the weighted sum, the weighting factor for the most significant group is 3, for the intermediate 2, and for the least significant 1. For individual NUTS-2 regions, the impact index varies from 0 to 30. The maximum value of 30 the impact index reaches for the region “Yugozapadna i yuzhna tsentralna Bulgaria”. Two areas of maximum impact stand out – the Balkans and the Western Mediterranean. And while in the Western Mediterranean, this does not lead to a significant increase in mortality, in the Balkans there is a marked coincidence between mortality and solar alpha radiation recorded by the GOES satellites.
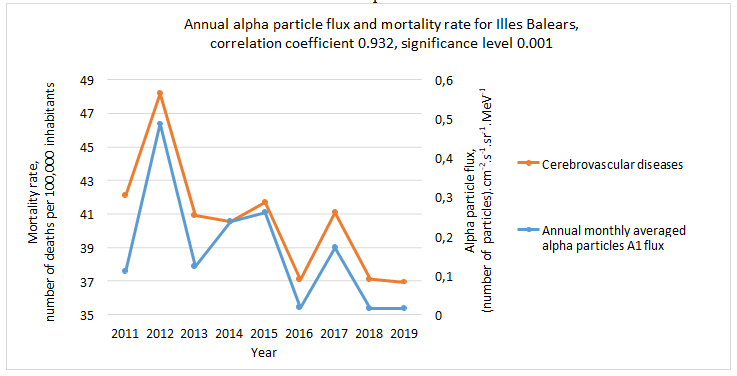
Figures 21-23 give examples of a strong correlation, indicating the presence of a cause- and-effect relationship, between the annual mortality for some of the deadliest causes listed in the EUROSTAT shortlist and the annual flux of solar alpha radiation.
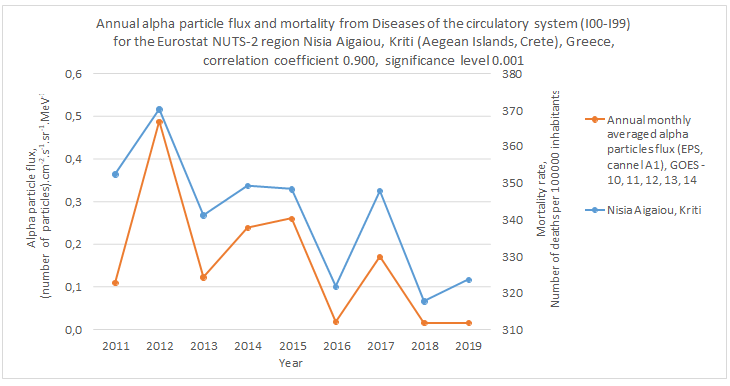
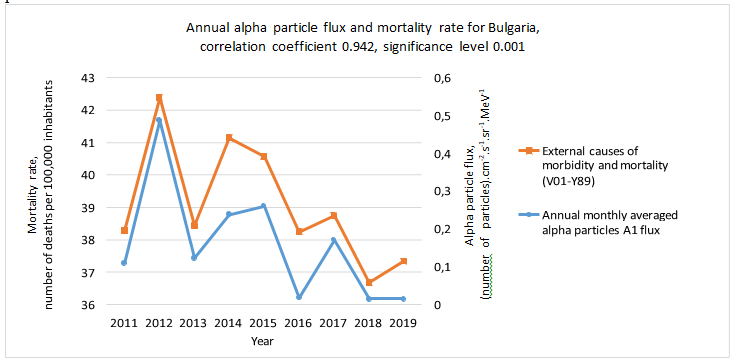
Further arguments are presented below in support of the hypothesis that the cause of death in the listed cases is streams of (so far unrecorded) solar alpha particles with very high energy, allowing them to penetrate to the earth’s surface, and therefore to pass through the atmosphere and with ionization within it to increase condensation nuclei and associated cloudiness.
A hypothetical mechanism, explaining described human mortality with the impact of invading high-energy solar alpha particles [10, 11, 12, 13, 14, 15, 16, 17, 18, 19, 20, 21, 22, 23].
An observed phenomenon – in the statistics of several countries located mainly in the 30°N – 50°N band, mortality from certain diseases, mainly those of the circulatory system, is strongly correlated with flows of positively charged particles with energy of the order of 4 – 21 MeV, recorded by the SMS and GOES series satellites in Earth orbit.
- The recorded alpha particle flows are mostly pulses with duration of less than 5 minutes (the averaging interval of the recording device).
- Proposed hypothesis – positively charged particles with high energy penetrate through the Earth’s atmosphere to the Earth’s surface and damage human health, to the greatest extent the human circulatory system, causing death mainly in elderly people with an already damaged circulatory system.
- As the average altitude of the affected countries increases, the particle flux-correlated mortality from diseases of the circulatory system shows an increasing trend [12, 18]. It is probably due to the more intense radiation flux penetrating the thinner atmosphere over the mountainous region of Earth’s surface – an argument favoring the hypothesis.
- The source of the flows of positively charged particles is the Sun – mortality increases with observable processes on the Sun photosphere – from SME and flares directed to Earth (phenomenons on the solar surface that could be observed with other astronomical means) [12, 18]. The Alpha Magnetic Spectrometer (AMS-02) on the International Space Station measures cosmic rays, excluding those of solar origin (when shielded from the Sun by the station’s solar panels). In particular, it measures the flow of 3He and 4He (alpha particles) in cosmic rays. The measurements show [24] increasing annual flux of alpha particles in cosmic rays for the interval of years from 2011 to 2017 (last available data), while the flux of GOES registered (solar?) alpha particles for the same interval of years is decreasing Figures 21,22, and 23. Indirect evidence for the Sun as a source of high-energy alpha particles is that this assumption convincingly explains the downstream processes that ultimately lead to death from circulatory system diseases.
- Positively charged solar particles capable of penetrating through the Earth’s atmosphere to the Earth’s surface are high-energy alpha particles. Calculators PSTAR [25] and ASTAR [26] calculate the penetration parameters of protons, respectively alpha particles in different substances, in particular in air. Calculations with data for a homogeneous atmosphere – an atmospheric model with constant density, temperature, and pressure decreasing with height [12] show that only particles whose energy is above 2.4 GeV for protons and over 6.2 GeV for alpha particles can penetrate the Earth’s atmosphere to the surface. There are no registered from GOES satellites protons above 0.7 GeV, but there are registered alpha particle fluxes with energy above 3.4 GeV, hypothetically also those with energy above 6.2 GeV [12, 18, and 20], i.e. the particles that penetrate to the Earth’s surface are probably high-energy alpha particles. An only flux of alpha particles with a magnitude of at least (1000 particles).cm-2.s-1.MeV-1 is correlated with the mortality of the Earth’s surface.
- It is assumed that the alpha particles recorded by the satellites were emitted simultaneously with the hypothetical fast alpha particles in a common explosive process on the solar surface. It can be calculated that particles with energy of 7 GeV need 8.87 min to reach the Earth’s surface from the Sun’s surface, and registered from satellites particles with energies of 5 – 10 MeV travel about 2 hours. The registered alpha particles do not have enough energy to penetrate the atmosphere, unlike the hypothetical fast alpha particles that reach the surface of the Earth in minutes from the center of the solar disk. However, the registered alpha particles are an indicator that two hours earlier there was an irradiation of the Earth’s surface with fast alpha particles.
- Although alpha particle streams irradiate the entire illuminated part of the atmosphere, penetration of fast alpha particles to the surface occurs only in a limited area of the surface (death spot), for which two conditions favoring penetration are combined:
a. The Sun is culminating for the center of the death spot, b. For the center of the death spot, a coincidence is in effect – the direction of the geomagnetic vector coincides with the direction of the alpha particle intrusion – then the alpha particle movement is not affected by the deflecting magnetic force. Such a coincidence occurs twice a year for latitudes in the band from 28°N to 48°N [12]. For latitudes outside this band, such a coincidence is impossible, the fast alpha particles do not reach the Earth’s surface, which explains why for countries located near the North Pole no correlation is observed between alpha radiation fluxes and mortality from circulatory system diseases.
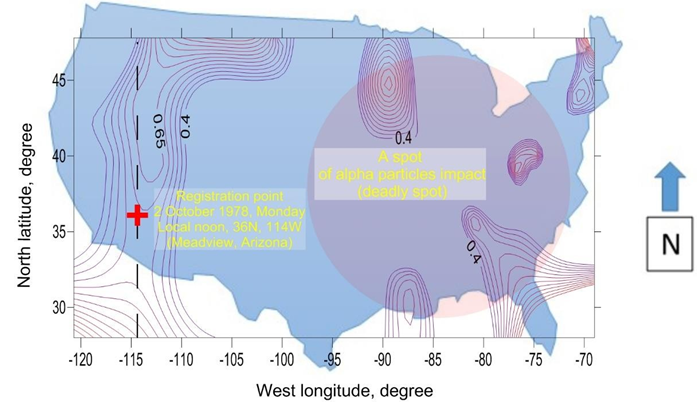
c. The point of registration is a point on the Earth’s surface where the solar disk is at its culmination at that moment of the alpha particle flux registration. Its longitude can be determined from the data for the hours and minutes of registration by the GOES satellites. And its latitude – from the date of registration. The approximate center of the dead spot can be calculated – the Earth’s angular velocity is 15° per hour, therefore dead spot center is approximately 30° east of the registration point. The examples from the USA mortality are shown in Figures 24 and 25.
US Medical Statistics provides free access for research purposes to the world’s most complete mortality information for US citizens, in particular information on each death. For some interval of years in the recent past, US mortality statistics have also collected information on an individual’s date of death. This made it possible, in sync with the temporal specificity of the flows of alpha particles with high kinetic energy recorded by the satellites, to track the rapid changes in the number of deaths in the United States.
Discussion
At the moment, the dominant idea for the cause of the global warming of the surface air in the last few decades is the burning of fossil fuels, i.e. it is accepted as reliably established that global warming is caused by human activity. This idea offers hope for a possible solution to the problem if drastic measures are taken across the planet to limit the use of fossil fuels. In the exposition above, the more pessimistic conclusion was drawn that the main cause of the rising temperature is solar activity. This conclusion takes away the hope that humanity can take measures to deal with the problem. Measures can be taken to adapt to the inevitable changes imposed by nature.
What can be expected in the future? Of course, it is not excluded that the natural processes will change a direction desired by humanity with the normalization of the temperature. There is nothing we as humanity can do to help such a change. Changes in temperature with a short-term nature of a few tens of years have also occurred in the recent past – for example, from the middle of the 17th century, for about 70 years, temperatures were lowered compared to previous years – the time interval is known as the “little ice age”, supposedly also associated with changes in solar activity. The continued increase in global temperature, regardless of its cause, risks triggering an uncontrollable melting process of the polar and Greenland ice sheets, due to the absorption of more heat from the ever-larger areas of ocean and land freed from the ice – i.e. so-called positive feedback between the decreasing ice areas reflecting light to space and the heat absorbed by the planet.
Conclusion
A high negative correlation between the average Sun Spot Number in phase “rise” in the 11-year cycle of solar activity and the annual average Earth’s surface temperature was observed in the data from several meteorological stations in Bulgaria. As solar activity has decreased over the last 70 years – the last few solar cycles up to the 24th number have had a monotonically decreasing number of sunspots – their negative correlation with temperature results in a rising surface air temperature. This increase is related to processes in the Sun’s magnetosphere and has nothing to do with the increasing concentration of greenhouse gases in the surface atmosphere.
If part of the mortality on the Earth’s surface is caused by solar alpha particles, then on their path to the surface they create an increased concentration of ions in the atmosphere as well. Fluxes of solar alpha particles are more frequent during the phase „rise“ of solar activity. Particles penetrating the atmosphere create an increased concentration of ions (condensation nuclei) in the troposphere. As a result of the increased number of condensation nuclei, daytime cloudiness is increased, and this increases the reflection of solar electromagnetic radiation from the upper surface of the clouds back into space. Less electromagnetic solar radiation reaches the Earth’s surface during the day as a result of increased shading from additional cloud cover. The Earth’s surface, absorbing electromagnetic radiation, heats up less, i.e. the ground air temperature is reduced. From the
19th to the 24th cycle, solar activity decreases. To the extent that the frequency of solar alpha particle fluxes is related to solar activity, especially during the phase “rise”, high- energy alpha radiation fluxes also decrease in frequency and intensity. As a result, daytime cloud cover decreases and more electromagnetic radiation reaches the Earth’s surface, raising the temperature of the Earth’s surface and surface air in the last decades of declining solar activity.
References
-
Lee H, Romero J (2023) CLIMATE CHANGE 2023: Synthesis Report, Summary for Policymakers. IPCC, Geneva, Switzerland, pp: 1-34.
-
NOAA (2023) National Climatic Data Center.
-
(2023) Royal Observatory of Belgium, Brussels.
-
(NOAA) National Centers for Environmental Information.
-
Data from GOES satellites.
-
(2024) GIOVANNI, NASA.
-
(2023) Causes of death - crude death rate by NUTS 2 region of residence. EUROSTAT.
-
Centers for Diseases Control and Prevention (CDC), USA, National Center for Health Statistics (NCHS), Scientific Data Documentation, Detailed Mortality File, 1962-1992.
-
Lakin GF (1990) Biometrics. Moscow. Higher School Publishing House. 208-214.
-
Takuchev N (2019) Solar corpuscular radiation and mortality from various forms of ischemic heart disease in Bulgaria for the interval 2005 – 2015. AIP Conference Proceedings 2075: 130005.
-
Takuchev N (2020) Ischemic Heart Diseases Mortality for Bulgaria Partly Depends on Solar Corpuscular Radiation? ES Journal of Cardiology 1(2): 1010.
-
Takuchev N (2021) How Ischemic Heart Diseases Mortality Depends on Solar Corpuscular Radiation: A Case from Bulgaria. Challenges in Disease and Health Research. Book Publisher International 8: 44-55.
-
Takuchev N (2021) Does the Angel of Death Sometimes Use Solar Alpha Particles to Take Our Souls? Book Publisher International, pp: 1-40.
-
Takuchev N (2021) Solar Corpuscular Fluxes of Alpha Particles and Mortality from Ischemic Heart Disease in Bulgaria. In: Proceedings of a scientific conference “RADIATION SAFETY IN THE MODERN WORLD”, Tarnovo, Bulgaria.
-
Takuchev N (2022) The Solar Alpha Particles Invading Earth and Ischemic Heart Diseases – the Worldwide Killer Number One, Connected? London Journals Press 22(5): 31-39.
-
Takuchev N (2023) The High-Energy Positive Solar Particles Invading the Earth with Contribution to the Mortality from Ischemic Heart Diseases? SCIREA Journal of Physics 9(2): 54-65.
-
Takuchev N (2023) Alpha particle fluxes and ischemic heart disease mortality study for Bulgaria and Los Angeles, California, USA. J Mod Appl Phy 6(2): 1-6.
-
Takuchev N (2023) Solar Alpha Particles and Death from Ischemic Heart Disease. CMRO 6(6): 1615-1625.
-
Takuchev N (2023) Space threat to the USA – increase in mortality from ischemic heart disease due to high- energy alpha particles entering Earth’s orbit. J Mod Appl Phys 6(3): 1-13.
-
Takuchev N (2023) Solar Alpha Particles and Death from Ischemic Heart Disease. Int J Complement Alt Med 16(4): 228-232.
-
Takuchev N (2023) Humanity is subject to a deadly cosmic impact – is non-human intelligent intervention also possible? J Mod Appl Phys 6(3): 1-11.
-
Takuchev N (2023) High Energy Solar Alpha Particles are Dangerous for the People on the Earth’s Surface. J Phys Astron 11(8): 368.
-
Takuchev N (2024) Space Alpha Particle Fluxes towards the Earth’s Surface Increase Human Mortality – Examples from the Balkans and Greece. Open J of Astro 2(1): 1-7.
-
(SSDC) Cosmic Ray Data Base: Database for charged cosmic ray measurements.
- Sense, Gravity, Parity & Chirality in Mathematical Physics
- Quantum Lattice Simulations PHYSICS: Microcircuit Particle Formation and Observable Macroscopic Irreversible Time - A Discrete Lagrangian with Cellular Automata Framework
- Quantum Biology from Biomacromolecule to Cell, and Central Dogma Described by Quantum Theory
- Focus, Agility, Speed and Technology (FAST) for Sustainability and Growth
- Square Root Metric Geometry and Pati-Salam Model in Curved Space-Time
- A Simple System Demonstrating the Mpemba Effect in Classical Mechanics