The Properties of Biomaterials Hidden in the Spaces of Higher Dimension
The influence of the higher dimension of biomolecules on processes in biomaterials is investigated. It has been proved that the optical activity of organic compounds is a consequence of the higher dimensionality of molecules in solution, and not a consequence of the three-dimensional shape of solid crystals, as Pasteur suggested. It is shown that glucose and ribose molecules have dimensions of 15 and 12, respectively. Helical chains of glucose molecules are characterized by the rotation of molecules in perpendicular planes in the opposite directions. A hidden order of interaction of nucleic acids in a space of higher dimension was discovered, leading to a one-to-one correspondence between the number of pair of bound nitrogenous based and the number of amino acids.
Introduction
The study of the structure of biomaterials is the subject of many studies. All these studies suggest that the dimension of biomolecules is no more than three. However, recent studies by the author Zhizhin, 2014-2022 [1, 2, 3, 4, 5, 6, 7, 8, 9, 10, 11, 12, 13, 14] convincingly prove that almost all molecules of inorganic and organic chemistry, especially biomolecules, have a higher dimension. Ignoring the higher dimensionality of the molecules that form biomaterials does not allow one to explain many observed phenomena and leads to incorrect conclusions regarding the properties of biomaterials. In this paper, this is illustrated by three important examples: studies of tartaric acid, the properties of glucose, and the interaction of nucleic acids.
The Studies of Tartaric Acid
The study of tartaric acid played an important role in the development of biology, beginning with the well-known work of Pasteur (1848) Pasteur [15] on the rotation of the plane of polarization of light by tartaric acid. In the Fischer form, tartaric acid has two enantiomorphic forms D and L (Figures 1 & 2).
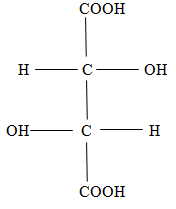
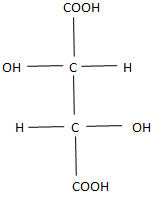
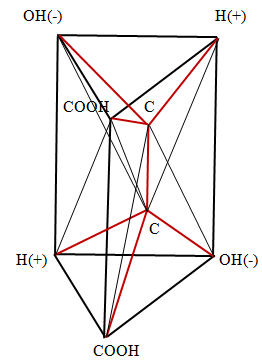
Fischer forms are flat and do not reflect the spatial shape of the molecule. From Figures 1, 2 it follows that in the spatial image both forms D and L have two tetrahedrons with a center. Moreover, the center of one of them is the top of the other, and the center of the other is the top of the first. These spatial images are shown in Figure 3 (D) and Figure 4 (L), respectively.
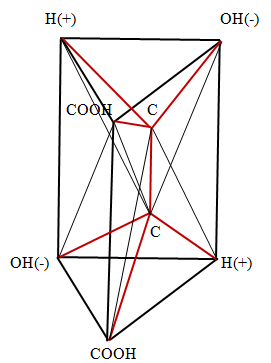
Here, the edges corresponding to chemical bonds are depicted in red, and the edges, which are necessary only to represent the spatial images of molecules, are marked in black. In Figure 3, along with the indication of the functional group located at the vertex, the symbol of the vertex is indicated by a small Latin letter. It is necessary to determine the dimension of the polytope bcdfahgo. The polytope in Figure 3 has 8 vertices ( 0_f_ =8), 22 edges ( ab, ag, af, ao, ah, gh, gf, go, gd, bf, bo, bd, bc, df, do, dc, hc, hf, ho , cf, co, fo). Therefore, 1_f_ = 22. The polytope in Figure 3 has 29 planar faces, of which 26 are the triangles (aho, afo, ahf, afg, ahg, aog, aob, afb, bfo, bco, bod, bfd, bfc, bcd, ghf, gho, gfo, god, gfd, dfo, dco, dfc, cof, chf, cho, hfo) and 3 quadrangles (abdg, hcgd, abhc). Therefore,
2_f_ = 29. The polytope in Figure 3 has 20 three - dimensional figures, of which 13 are tetrahedrons (bcfd, ahog, dcfo, bcdo, bfdo, cfdo, ahof, ahgf, hogf, aogf, fgod, fohc, foab), 6 pyramids (agbdo, ahbcf, ahbco, agbdf, Chgdf, chgdo) and one (ahgbcd) prism. Therefore, 3_f_ = 20. It follows from the construction of the polytope in Figure 3 that it includes two tetrahedrons with the center bcdfo and oahgf. In addition to these two polytopes with dimension 4, five 4 - polytopes also appear in the polytope in Figure 3. Three of these polytopes have as their base three rectangular faces of the prism ahgbcd, whose vertices are connected with the vertices f, o located inside the prism. To prove their 4 - dimensionality, consider one of these polytopes abhcfo, since the proofs for the other two polytopes are similar. This polytope has 6 vertices ( 0_f_ =6); 13 edges (ab, ah, hc, bc, af, hf, bf, cf, ho, ao, bo, co, fo), 1_f_ =13; 13 two - dimensional faces (ahf, aho, abo, abf, afo, bfo, boc, ahbc), 3_f_ = 13; 6 three -dimensional faces (hfoc, abof, bfoc, afho, ahcbf, ahcbo), 3_f_ =13. Define dimension polytope in Figure 3 on the Euler- Poincare equation Poincare [16].
1 n i i i i f P
− $$ \sum_ {i = 0} ^ {n - 1} (- 1) ^ {i} f _ {i} (P) = 1 - (- 1) ^ {i}, [ 1 ] $$
0 ( 1) ( ) 1 ( 1) ,
is the number of the elements with the dimension i at polytope P; n is dimension of the polytope P.
Substituting the obtained values of the numbers of faces of different dimensions into equation (1), can find that equation (1) is satisfied for n=4 6-13 + 13 - 6 = 0.
It is proved by the 4 - dimensionality of the polytope abhcfo.
The two polytopes of dimension 4 there are formed by the ahgbcd prism with the vertex f or o inside its. Consider the prism ahgbcd with the vertex f (the proof for the prism with vertex o is similar). The polytope ahgbcdf has 7 vertices,
0_f_ = 7; 15 edges (ah, hg, ag, bd, bc, cd, ab, hc, gd, af, fh, fg, bf, fc, fd), 1_f_ = 15; 14 two - dimensional faces (ahg, bdc, ahf, hfg, afg, bfc, fcd, bfd, fhc, afb, fgd, ahbc, hcgd, agbd), 2_f_ =14; 6 three - dimensional faces (ahgbcd, ahgf, bcdf, abdgf, hgcdf, ahbcf), 3_f_ =6. Substituting the values of the numbers of faces of various dimensions obtained for the polytope ahgbcdf into equation (1), can find that it is satisfied for n=4 7 - 15 + 14 - 6 = 0. This proves that the polytope ahgbcdf has a dimension of 4.
Thus, for the polytope in Figure 3 are 0_f_ =8, 1_f_ =22, 2_f_ =29, 3_f_ =20, 4_f_ =7. Substituting these values into equation (1), can find that it is satisfied for n =5 8 - 22 + 29 - 20 + 7 = 2.
This proves that the polytope in Figure 3 has dimension 5.
The images obtained make it possible to explain the main property of tartaric acid - rotation of the plane of polarization of the incident light in different directions: in the case of the D form to the right, in the case of the L form to the left. It is known devices for rotating the plane of polarization of light, having the appearance of two folded triangular prisms, the boundary between which serves to reflect light Wood [17]. Can say that the molecule of tartaric acid is a natural device for rotating the plane of light polarization. Two carbon atoms play the role of the reflecting partition in the molecule. The rotation occurs in the forms D and L in different directions because of the opposite arrangement of the charges of the hydrogen ions (+) and the hydroxyl group (-) in these forms.
The Chains of Molecules α – D - Glucose
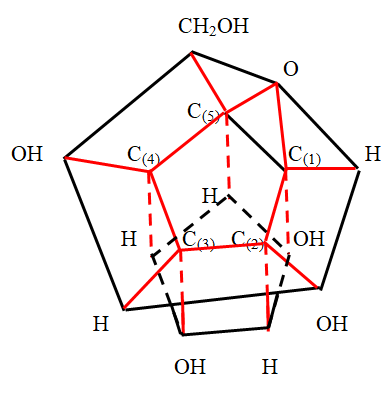
Back in 2016 [4], a spatial model of the α - D-glucose molecule was built and it was proved that the molecule has the type of a simplex, and its dimension is 15. In this work, based on this model, a simplified three-dimensional model of this molecule was built, taking into account the features of the full model. Figure 5 shows the complete model of the molecule.
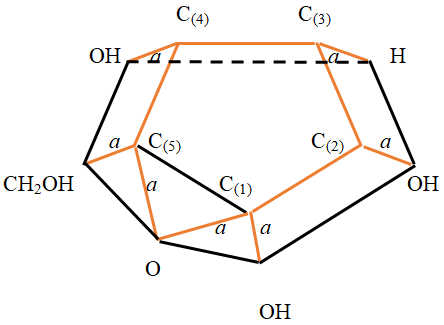
Now, based on the image of the higher dimensional image of the pyranose glucose molecule (Figure 5), we can begin to obtain a three - dimensional simplified image of this molecule and then compare this image with known common images. To obtain a three - dimensional simplified model of the molecule α -D - glucose, in Figure 5 we leave only the edges corresponding to chemical covalent bonds, the edges of the external contour, and the edge connecting the (1) (5) , C C
atoms. We assume as a first approximation that
the ring of carbon atoms
$$ \begin{array}{l} C _ {(1)} \div C _ {(5)} \\ 5 \mathrm {n m} \text {f t h o} \\ \end{array} $$
is a regular pentagon
with a side length of 0.15 nm (the standard length of the
carbon - carbon chemical bond). Since carbon atoms exhibit
tetrahedral coordination, other valence bonds of carbon
atoms must be located either above the plane of the ring or
below the plane of the ring. It is convenient to assume for
further geometric analysis that the atoms of hydrogen and
the hydroxyl group located in Figure 5 inside the carbon ring
are in space above the plane of the carbon ring. While the
oxygen atom and the functional groups of the outer contour
(larger) are under the plane of the carbon ring. A part of this
spatial structure located under the plane of the carbon ring
is shown in Figure 6.
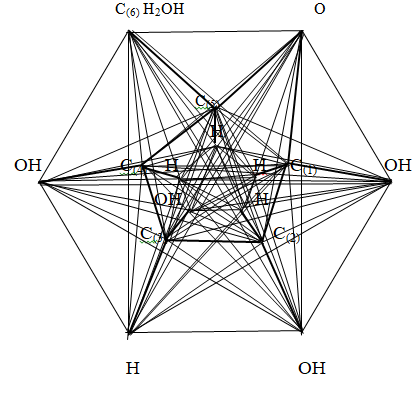
Figure 6: The part of the glucose molecule located under the carbon ring The length of the carbon – hydrogen and carbon – oxygen bonds is denoted by the letter a = 0.1 nm. Then the carbon - carbon bond length takes the form 1.5a. Thus, the part of the construction of the α -D - glucose molecule under the carbon ring is a pyramid with a lower base in the form of an irregular hexagon and an upper base in the form of a regular pentagon.
To determine the yet unknown geometric characteristics of the figures, it is first necessary to find the value of the angle of inclination of the side edges of the pyramid to its base. For this, we consider separately the flat lateral faces of the pyramid in the vicinity of the oxygen atom. We double these faces and designate the vertices and some characteristic points of this structure in separate letters (Figure 7).
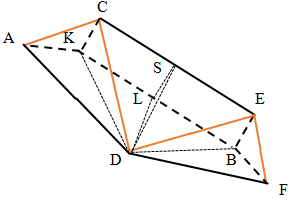
We denote the angle CAK by the letter ϕ . Given that / 2 AKC π ∠ = we have sin CK LS BE a ϕ = = = , so AC=CD=DE=EF=a, AK=a cosϕ . Since the carbon cycle is a
regular pentagon, then
$$ \angle A K L = \pi / 2 - 5 4 = 1 2 6 ^ {o}. \mathrm {S i n c e} $$ CE=1.5a and point S is middle of segment CE then $$ D S = \sqrt {a ^ {2} - (3 / 4) ^ {2} a ^ {2}} = a \sqrt {7} / 4. $$
From triangle DSL we have
| a | 7 −16sin2ϕ. |
|---|
triangle KLD we obtain
$$ K D = \sqrt {D K ^ {2} + K L ^ {2}} = a \cos \varphi = A K. $$ Then . KDC ϕ ∠ = Besides, $$ \sin \angle D K L = \frac {D L}{K D} = \frac {\sqrt {7 - 1 6 \sin^ {2} \varphi}}{4 \cos \varphi}. $$ Therefore,
2 7 16sin 126 arcsin 4cos
$$ \angle A K D = \angle A K L - \angle D K L = 1 2 6 ^ {o} - \arcsin \frac {\sqrt {7 - 1 6 \sin^ {2} \varphi}}{4 \cos \varphi}. $$ From the triangle KAD we obtain
$$ \left| \frac {A D}{2 a \cos \varphi} = \sin \frac {\angle A K D}{2}. \right| $$
From here we find
2 7 16sin 1 2cos sin(63 arcsin ). 2 4cos
$$ A D = 2 \cos \varphi \sin \left(6 3 ^ {o} - \frac {1}{2} \arcsin \frac {\sqrt {7 - 1 6 \sin^ {2} \varphi}}{4 \cos \varphi}\right). \tag {2} $$ Besides, from four - angle AKLD we have KN/AK=cos (126o -90o). Then, Therefore,
3 cos cos36 . cos sin36 . 4
o o KN a LM AM AN NM a a ϕ ϕ = = = + = +
$$ M D = D L - L M = \frac {a}{4} \sqrt {7 - 1 6 \sin^ {2} \varphi} - a \cos \varphi \cos 3 6 ^ {\circ}. $$
2 7 16sin cos cos36 . 4
Thus, we find also one express for segment AD
| a | 7 −16sin2ϕ |
|---|
. (3) Comparing (2) and (3) after transformations, we obtain the equation for finding the angleϕ for any a
1/2 2 2 7 16sin 7 16sin 1 1 3 sin36 sin(63 arcsin ) cos36 2 4cos 2 8 cos 8cos
$$ \left[ ^ {o} - \frac {1}{2} \arcsin \frac {\sqrt {7 - 1 6 \sin^ {2} \varphi}}{4 \cos \varphi}) = \left[ \frac {1}{2} + \frac {3}{8} \frac {\sin 3 6 ^ {o}}{\cos \varphi} - \cos 3 6 ^ {o} \frac {\sqrt {7 - 1 6 \sin^ {2} \varphi}}{8 \cos \varphi} \right] ^ {1 /} $$ o o o ϕ ϕ ϕ ϕ ϕ . (4) Solving equation (4) numerically, we find that the angle ϕ = 36o. Thus, the height of the lower part of the α -D - glucose molecule is sin a ϕ = 0.058778 nm, the characteristic size of the upper base is 0.243 nm, and the characteristic size of the lower base is 0.243+2acosϕ = 0.405 nm.
The angle of inclination of the side edges of the lower part of the model, as follows from the solution, is different from 90. This reflects in averaged form the presence of atoms in the conformations of the α -D - glucose molecule located quite close to the equatorial plane of the molecule [18, 19, 20].
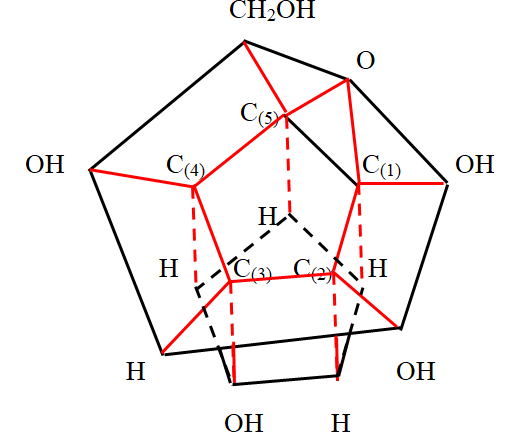
The upper part of the α -D - glucose molecule above the carbon cycle should be depicted in the form of a pentagonal prism, directing the volatile bonds from the carbon atoms of the cycle vertically upward. This is consistent with the tetrahedral coordination of atoms around a carbon atom. Thus, the α -D - glucose molecule in a simplified three - dimensional form is a pyramid in contact with the carbon cycle with hexagonal and pentagonal bases and a straight pentagonal prism. However, in order to compare the obtained image with the known images of the α -D - glucose molecule in the Haworth projection [20], it is necessary to expand so that the pentagonal prism is at the bottom and the arrangement of other atoms and functional groups is consistent. In this case, it is necessary to take into account the possibility of changing the position of the hydroxyl group at the carbon atom (1) C . In this way, two spatial simplified images of the glucose molecule are obtained, shown in Figure 8 ( β - anomer) and Figure 9 (α - anomer).
In the molecules of other pyranoses, the atoms or functional groups partially connected to the carbon atoms of the carbon cycle partially change. In this case, the structure of the molecules, up to functional groups, remains the same for glucose molecules in the pyranose cycle carbon atoms. Therefore, the dimension of molecules such as D - mannose, D - galactose, L - fucose is also equal to 15.
Thus, we see that a simplified three - dimensional image of a pyranose monosaccharide molecule has the form of two three – dimensional polytopes stacked on top of each other. The lower figure is cylindrical prism with a regular pentagon base. The top figure is a pyramid with pentagonal and hexagonal bases. These figures are connected by a carbon cycle. We emphasize that this image was obtained as a result of the analysis of the image in the space of higher dimension and numerical research. The resulting image does not in any way resemble an armchair, which is widely used in the literature as an image of a pyranose monosaccharide molecule.
Representations of the saccharide molecules in the form of polytope simplifies the understanding of the formation of polysaccharides.
Monosaccharide molecules combine with each other thanks to the combination of two hydroxyl groups with the release of a water molecule. The remaining oxygen atom connects the remaining part of the monosaccharides. The most common chains of α -D - glucose monosaccharide residues. Here, residual α - D - glucose molecules can be joined through an oxygen atom, connecting carbon atoms 1 - 1, 1 - 4, 4 - 4, 4 - 1. In some cases, the carbon atom C(2) in the cycle will be involved in the compound. Branching chains of glucose molecules occurs at the sixth carbon atom in the functional group CH2OH. Monosaccharide chains have different forms depending on the type of these molecules, i. e. depending on whether these molecules are β -anomers or α - anomers. Using the obtained simplified three - dimensional models of α - D - glucose molecules, we consider in more detail these compounds in a metric image, taking into account the angles between the valence bonds. Let two β -anomers of the α - D - glucose molecule join together, linking the carbon atom C(1) of the first α - D - molecule to the carbon atom C(4) of the second α -D - molecule (lactose). Based on the geometric image in Figure 10, you can imagine a top view of this connection (Figure 10).
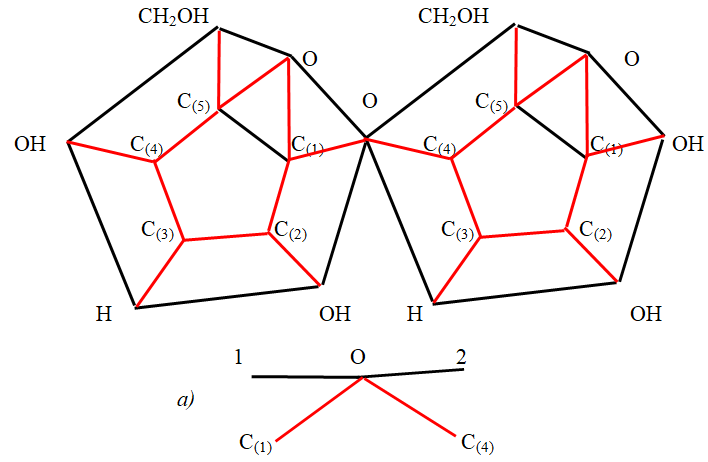
It is easy to see that the same attachment of the third α - D - glucose molecule leads to a linear arrangement of molecules when viewed from above on this compound. Linearity will not change with the following similar connections. However, given the three - dimensionality of the image, you should look at this connection from a different view. Figure10a) shows an image of the junction of two α - D
- glucose molecules when viewed from the front. The black segments in Figure 10 a) are the traces of the intersection of the upper bases of the prism with a plane passing through the valence bonds of the oxygen atom and carbon atoms. According to the obtained solution of equation (3), the angle between the base of the prism and the valence bond is 36 degrees. both the first α -D - glucose molecule and the second α -D - glucose molecule. The valence angle at the oxygen atom in compounds with two carbon atoms in the chain of α -D - glucose molecules, as you know, is slightly larger than the normal valence angle and is about 112 degrees. Thus, the angle 102 in Figure 10a) is 176 degrees. This means that the base of the second α -D - glucose molecule has a slope to the base of the first α - D - glucose molecule other than zero. More precisely, this slope is 4 degrees, therefore the second α - D - glucose molecule, when viewed in full view, turns to the left relative to the first α - D - glucose molecule. It is clear that such an addition of a third α - D - glucose molecule will increase the angle of inclination of this molecule relative to the first molecule. Thus, the statement about the linearity of the chain of α - D - glucose molecules when connecting them in the case of anomers is not entirely accurate. One can say that this statement is somewhat one - sided.
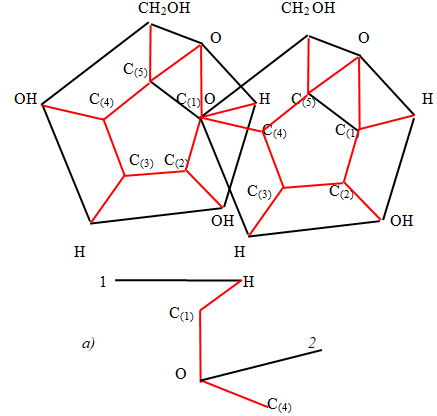
Let two α - anomers of the α - D - glucose molecule join together, linking the carbon atom C(1) of the first α -D - molecule to the carbon atom C(4) of the second α - D - molecule (maltose). Based on the geometric image in Figure 9, you can imagine a top view of this connection Figure 11.
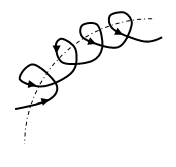
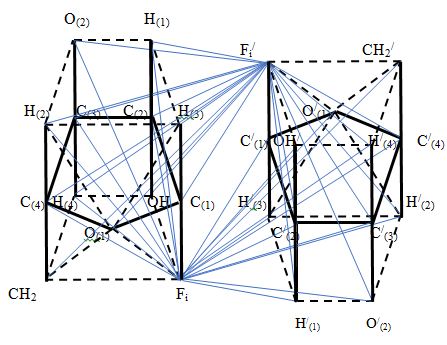
Nonlinearity will save with the following similar connections. Thus, the chain of molecules turns to the right. However, given the three - dimensionality of the image, you should look at this connection from a different view. Figure 11a) shows an image of the junction of two α - D - glucose molecules when viewed from the front. The black segments in Figure 11 a) are the traces of the intersection of the upper bases of the prism with a plane passing through the valence bonds of the oxygen atom and carbon atoms. According to the obtained solution of equation (3), the angle between the base of the prism and the valence bond is 36 degrees both the first α - D - glucose molecule and the second α - D - glucose molecule. Thus, on the Figure 11a the angle 1H C(1) is 36 degrees and the angle C(1)OC(4) is 112 degrees. Since, the angle C(4)O2 is 36 degrees too, so the angle between bases 1H and O2 is 14 degrees. This means that the base of the second α - D - glucose molecule has a consequently slope to the base of the first α - D - glucose molecule to the left. It is clear that such an addition of a third α - D - glucose molecule will increase the angle of inclination of this molecule relative to the first molecule. In the chains of - anomers, one of the projections is linearly transmitted along the chain, and the projection perpendicular to it along the chain along a curved line. In chains of α - anomers (spirals), it is observed that when moving along a chain of projections in mutually perpendicular planes, the pyranose molecules rotate in opposite directions (Figure 12).
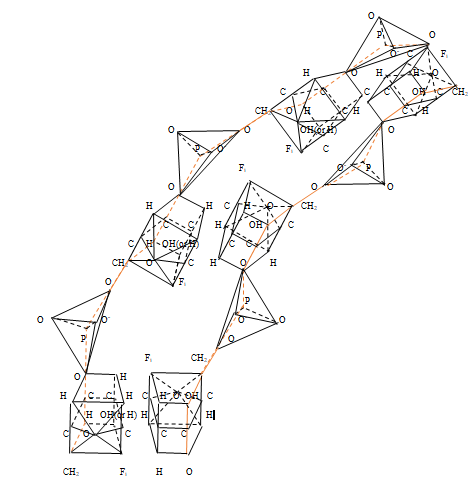
Thus, chains of α - anomers of α - D - glucose molecules rotate simultaneously in opposite directions in perpendicular planes. The study of furanose chains using simplified three - dimensional models was carried out using nucleic acids as an example, in which furanose models were connected to each other using phosphoric acid residues. These studies showed that, when nucleic acids bound by nitrogen bases interact, there is a latent degree of freedom of arrangement of nitrogen bases in higher dimensional space, leading to an unambiguous corresponding number of nucleotides taking into account their possible location in space and the number of amino acids [11, 12, 13].
Conclusion
Thus, the reason for the different rotation of the plane of polarization of light lies not in the different forms of the crystals of D - tartaric acid and L-tartaric acid, as Pasteur suggested, but in different forms of molecules, clearly visible in the image in the space 5D.
Three-dimensional geometric models of the pyranose molecule and chains of these molecules, constructed on the bases of simplification of complete higher-dimensional models of such molecules, are studied in detail. It is shown that a simplified three-dimensional model of the pyranose molecule consists of two parts of a straight pentagonal prism and a pyramid with pentagonal and to the difference in the geometric three-dimensional figures that form the sugar molecule, the spiral chains of these molecules are characterized by a seemingly paradoxical property: rotation of the figures in two perpendicular planes in opposite directions.
A simplified three-dimensional model of a double- stranded nucleic acid with antiparallel edges has been constructed. It was found that the existence of five different nucleotides A, U, C, G, T allows each of the five planar nitrogenous bases to be located in the accessible coordinate planes of the polytope of hereditary information of dimension 13. This leads to the Chargaff’s rule of the order of interaction of nitrogenous bases. The existence of five coordinate planes in the polytope of hereditary information and four types of nucleotides for each nucleic acid correlates the number of possible locations of nitrogenous bases in the polytope of hereditary information and the number of possible types of amino acids, without requiring the introduction of three-membered codons. The general flow of transmission of hereditary information in a polytope of hereditary information is determined by the flow of incidents of geometric elements of various dimensions in this polytope.
It should be noted that the widespread algebraic (linear or matrix) description of the genetic code [28] does not take into account the hidden geometric order of nucleic acids and the biological features of their interaction.
References
-
Zhizhin GV (2014a) On the higher dimension in nature. Biosphere 6(4): 313-318.
-
Zhizhin GV (2014b) World-4D. St.-Petersburg: Polytechnic Service.
-
Zhizhin GV (2015) Polytopic prismahedrons- fundamental regions of the n-dimension nanostructures. Paper presented at The International conference “Nanoscience in Chemistry, Physics, Biology and Mathematics. Cluj-Napoca, Romania.
-
Zhizhin GV (2016) The structure, topological and functional dimension of biomolecules. J Chemoinformatics and Chemical Engineering 5(2): 44- 58.
-
Zhizhin GV, Diudea MV (2016) Space of Nanoworld. In: Putz MV & Mirica MC (Eds.), Sustainable Nanosystems, Development, Properties, and Applications, New York: IGI Global, pp: 214-236.
-
Zhizhin, GV (2018) The Metric Structure of Nucleic Acids and the Higher Dimension of Their Constituents. International Journal of Chemoinformatics and Chemical Engineering 7(2): 1-15.
-
Zhizhin GV (2019) The Structure of the Polytope of Hereditary Information. International Journal of Chemoinformatics and Chemical Engineering 8(2): 7-22.
-
Zhizhin GV (2019) Attractors and Higher Dimensions in Population and Molecular Biology: Emerging Research and Opportunities. Hershey, PA: IGI Global.
-
Zhizhin GV (2019) The Polytope of Hereditary Information: Structure, Location, Signification.
-
Zhizhin GV (2019) The Law of Conservation of Incidents of the Space of Nanoworld. International Journal of Chemoinformatics and Chemical Engineering 8(1): 25- 46.
-
Zhizhin GV (2020) Hidden Nucleic Acid Bond Order? Acta Scientific Biotechnology 1(4): 34-36.
-
Zhizhin GV (2021) Interaction of Nucleic Acids: Hidden Order of Interaction. International Journal of Applied Research in Bioinformatics 11(2): 1-8.
-
Zhizhin GV (2021) The Structures of DNA taking into account the Higher Dimension of its Components. In: Kosrapohr (Eds.), Encyclopedia of Organizational Knowledge, Administration, and Technologies. Hershey, PA: IGI Global, pp: 730-745.
-
Zhizhin GV (2021) Methylated Polytope of Hereditary Information. International Journal of Applied Research on Public Health Management 6(2): 49-60.
-
Pasteur L (1960) Selected works. Moscow: Publishing House of the Academy of Sciences of the USSR.
-
Poincare A (1895) Analysis situs. J de é Ecole Polytechnique 1: 1-121.
-
Wood R (1936) Research in physical optics. Wentworth Press.
-
Metzler DE (1980) Biochemistry the Chemical Reactions of Living Cells, New York: Academic Press, pp: 1-3.
-
Lehninger AL (1982) Principles of Biochemistry. The Jons Hopkins University: Worth Publishers, Inc.
-
Koolman J, Roehm KH (2020) Coloratlas of Biochemistry. Stuttgart, New York: Thieme.
-
Spirin AS (2019) Molecular biology. The ribosomes and protein biosynthesis. Moscow: Knowledge Lab.
-
Watson JD, Crick FHC (1953) Molecular structure of nucleic acids. Nature 171: 738-740.
-
Watson JD, Crick FHC (1953) Genetical implications of the structure of deoxyribose nucleic acid. Nature 171: 964-967.
-
Crick FHC (1959) The present position of the coding problem. Brokhaven Symp. Biol 12: 35-39.
-
Mancuso S (2017) Plant Revolution. Le piante hanno gia inventato it nostro future. Guiuti Editore.
-
Lindquist S, Chakrabortee S, Kayatekin C, Newby GA (2016) Luminidependens (LD) is an arabidopsis protein with prion behavior. Proceedings of the National academy of sciences of the United States of America 113(21): 6065- 6070.
-
Hawkes EJ, Hennelly SP, Novikova IV, Irwin JA, Sanbonmatsu KY, et al. (2016) COOLAIR antisense RNAs from evolutionary conserved elaborate secondary structures. Cell Rep 16(12): 3087-3096.
-
Petoukhov SV (2006) Metaphysical aspects of matrix analysis of genetic coding and the golden ratio. In Metaphysics. Century 21, In: Vladimirov YS (Eds.), Moscow: BINOM, Knowledge laboratory, pp: 250.
- Origin, Evolution, and Functional Impact of Short Insertion- Deletion Variants in Human Genomes: A Review
- Harnessing Molecular Glues for Next-Generation Vaccine, Cancer and Cardiovascular Disease Drug Development: A Comprehensive Review
- Lateral Cervical Epidermal Inclusion Cyst in a Paediatric Patient: A Rare Case Report
- Malarial Plasmodium Falciparum with Hepatitis B and C Virus Infections among Blood Donors in Ife Central Local Government Area, Ile Ife, Osun State, Nigeria
- Withanolides and Withaferin A- What’s next in Ashwagandha Research
- Designing of Dual Pulse Photoacoustic Tomography for Imaging of Drug-Response and Tumor Growth