Cytoarchitecture of Cerebellar Cortex: Fractal Analysis as a Method for Quantitative Studies
In this study we aimed to assess the possibility of fractal analysis utilization for the quantitative studies of cytoarchitecture in neuromorphology, namely in the studies of cerebellar cortex. We have chosen box counting method for fractal analysis. As an object of study we have chosen granule cell layer of cerebellar cortex. To estimate the informativeness of fractal analysis in the studies of cytoarchitecture and to assess the impact of the influencing factors (cell size, cell density or cell number, and pattern of cell distribution) we created artificial models of granule cells composition in the cerebellar cortex. We submit a proposition to consider the cell clusters and their assemblages as a whole entity. The cytoarchitecture as a whole entity exhibits some fractal properties: self-similarity of different scales, irregularity of the spatial configuration. Fractal dimension is the measure of space filling degree, so the fractal dimension measured in cellular groups characterizes space filling degree of cell assemblages. We revealed that the space filling degree depends on cell size, cell density (cell number) and pattern of cell distribution and clusterization. Increase in cell size or/and cell density (cell number) results in the increase in Fractal dimension values. Fractal dimension values are higher when cells are distributed evenly than when cells form the clusters. While the size and density (relative number) of cells can be estimated using traditional morphometric methods, the pattern of cell arrangement is mainly qualitative, and the fractal analysis allows to quantitatively and comprehensively assessing the cytoarchitecture of brain cortex.
Introduction
The brain structure at different levels of its organization is one of the most sophisticated and complexly organized in the human body. The cell distribution in the brain cortex and nuclei is complex and reflects both the functional features of various brain structures and the morphofunctional state of these structures. Cellular composition and its appearance under microscope are called cytoarchitecture (also called cytoarchitectonics) [1, 2, 3, 4, 5, 6, 7]. Studies of cytoarchitecture are quite informative when conducting neuromorphological studies of various brain structures. So, these studies are used both in comparative morphology and for studying the structures of the human brain [2, 3, 4, 5]. Despite the fact that classic studies of cytoarchitecture were widely used several decades ago [2, 3], studies of cellular distribution do not lose their relevance even nowadays [1, 4, 5, 6].
The search for additional methods of visualization and quantitative assessment to expand the informativeness of the cytoarchitecture studies continues. Studies of cytoarchitectonics are often combined with various quantitative methods of the cell distribution assessment. Most often, the cell density is determined, for which various counting, morphometric and stereometric methods are used [8, 9, 10]. The cell distribution in different brain structures is quite irregular. Nervous and glial cells form different cellular groups – layers and clusters. Granule cell layer of cerebellar cortex has high density of cell arrangement. The cerebellar granule cells form irregular cell clusters which architecture is irregular and reflects the spatial distribution of cells, their functional connections and morphofunctional state. Due to features of cell clusters spatial configuration, traditional morphometric methods are insufficient for comprehensive morphometric assessment of brain cytoarchitecture.
In recent decades, different natural sciences (including medicine and biology) increasingly use fractal analysis for the quantitative studies of irregular structures. Fractal analysis is a mathematical analysis method that allows you to determine the degree of space filling with a certain structure (the fractal dimension (FD) is a measure of space filling degree), which reflects the degree of structural and spatial complexities of the studied objects [11]. Fractal analysis is widely used in different fields of neuroscience and neuromorphology on anatomical and histological levels of brain organization [12, 13, 14]. This method is used for studies of cerebral [13, 15, 16] and cerebellar [17, 18, 19] structures (white matter and cortex) and as an additional morphometric method in neuroimaging. In our previous studies we determined fractal dimension values of skeletonized images of cerebral hemispheres [20, 21] and cerebellar white matter [22]. Fractal analysis also is used on microscopic level of brain organization: it was used for the quantitative studies of neuronal dendritic arborizations [22, 23, 24, 25, 26], astrocytes [27, 28] and microglial cells [29].
Despite the numerous studies of individual brain cells (neurons and glial cells) by fractal analysis, we did not find in the assessable literature works on the fractal analysis based evaluation of cell clusters in brain cortex, their grouping and brain cytoarchitecture. In this study we aimed to assess the possibility of fractal analysis utilization for the quantitative studies of cytoarchitecture in neuromorphology, namely in the studies of cerebellar cortex.
Material and Methods
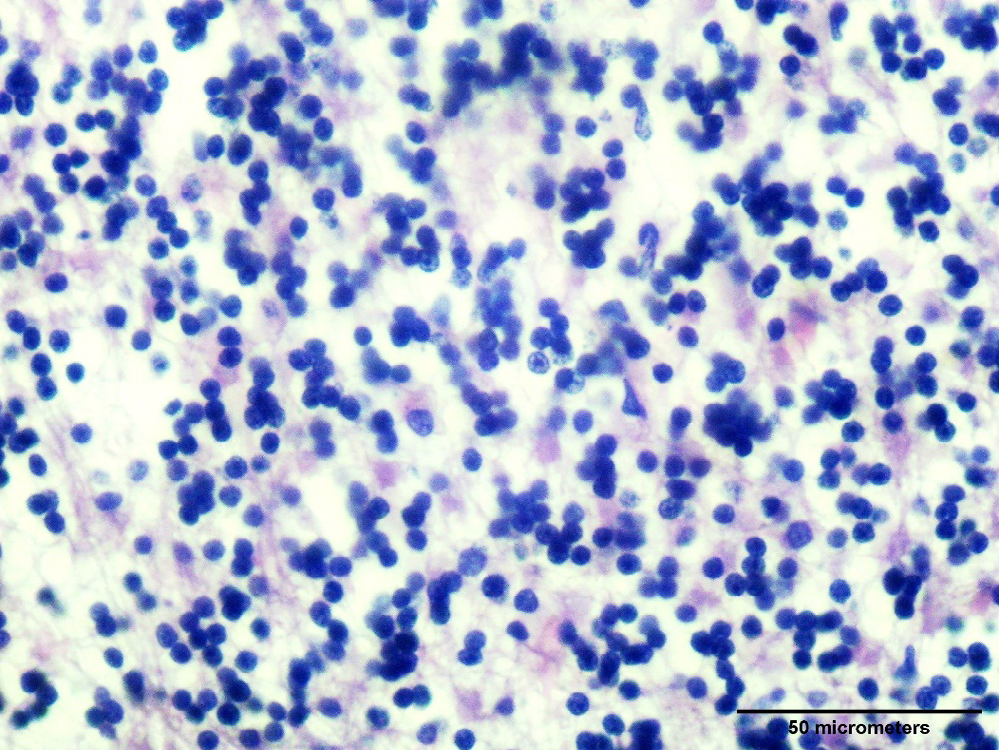
Different fractal analysis methods and different image preprocessing algorithms are used in medicine and biology. Methods of fractal analysis include box counting method (grid method), dilatation method, caliper method (perimeter stepping, ruler or Richardson`s method), mass- radius method, cumulative intersection method, grid intercept method [11, 12, 13, 14]. The box counting is the most commonly used fractal analysis method in natural sciences because of its universality and simplicity. There are different modifications and adaptations of method due to features of its application in different scientific fields. Thus, there is a modification of box counting developed for the studies of neurons [23]. Also there is a modification for the studies of the skeletonized magnetic resonance brain images [18]. In the present study, we have chosen box counting method to assess its informativeness in brain cytoarchitecture studies. As an object of study we have chosen granule cell layer of cerebellar cortex (Figure 1).
Fractal analysis can be used to study different image types: color images (Figure 2A), including histological microphotographs, grayscale and binary images. The counting for the fractal analysis may be done manually (only fractal grid is required) or using morphometric software such as Image J (instrument “fractal box count”) [30]. The utilization of software requires image preprocessing and image converting into binary format, i.e. containing only white and black pixels (Figure 2B).
The classical box counting method includes some following stages (iterations). Usually a square fragment of the image is examined. This method utilizes fractal grid dividing image into several boxes (Figure 2C-F). On the first stage the fractal grid divides each of the image sides into 2 segments (box size = 1/2), resulting in the image being divided into 4 boxes (Figure 2C). On the 2nd stage of fractal analysis the fractal grid divides each of the image sides into 4 segments (box size = 1/4); the image is divided into 16 boxes (Figure 2D). On the 3rd stage of fractal analysis the fractal grid divides each of the image sides into 8 segments (box size = 1/8); the image is divided into 64 boxes (Figure 2E). On the following stages of fractal analysis, the image sides are divided by fractal grid into 16, 32, 64 segments and so on (the box size values are 1/16, 1/32, 1/64, respectively) and the image is divided into 256, 1024, 4096 boxes, respectively. Thus, the box size is the first value included in the fractal dimension calculation. Several stages of fractal analysis are utilized during the study.
On each stage of fractal analysis number of boxes, intercepting (containing) fragments of studied objects (cells) is calculated (N). Thus, the number of filled boxes (N) is the second value included in the fractal dimension calculation (Table 1).
| Stage of Fractal Analysis | Box size | 1/box size | LN(1/box size) | N | LN(N) |
|---|---|---|---|---|---|
| 1st | 0.5 | 2 | 0.693 | 4 | 1.386 |
| 2nd | 0.25 | 4 | 1.386 | 16 | 2.773 |
| 3rd | 0.125 | 8 | 2.079 | 62 | 4.127 |
| 4th | 0.0625 | 16 | 2.773 | 188 | 5.236 |
Table 1: Classical box counting method. The data for fractal dimension calculation.
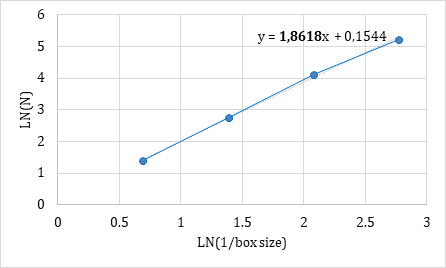
Natural logarithms of two values are calculated: 1/box size and N. Based on these two values, a linear regression equation is calculated (Figure 3) where LN (N) is the response (dependent) variable, LN (1/box size) is the predictor (independent) variable and the fractal dimension value is the estimated slope. In the example, used for the calculation of equation from Figure 3, the fractal dimension value is 1,8618.
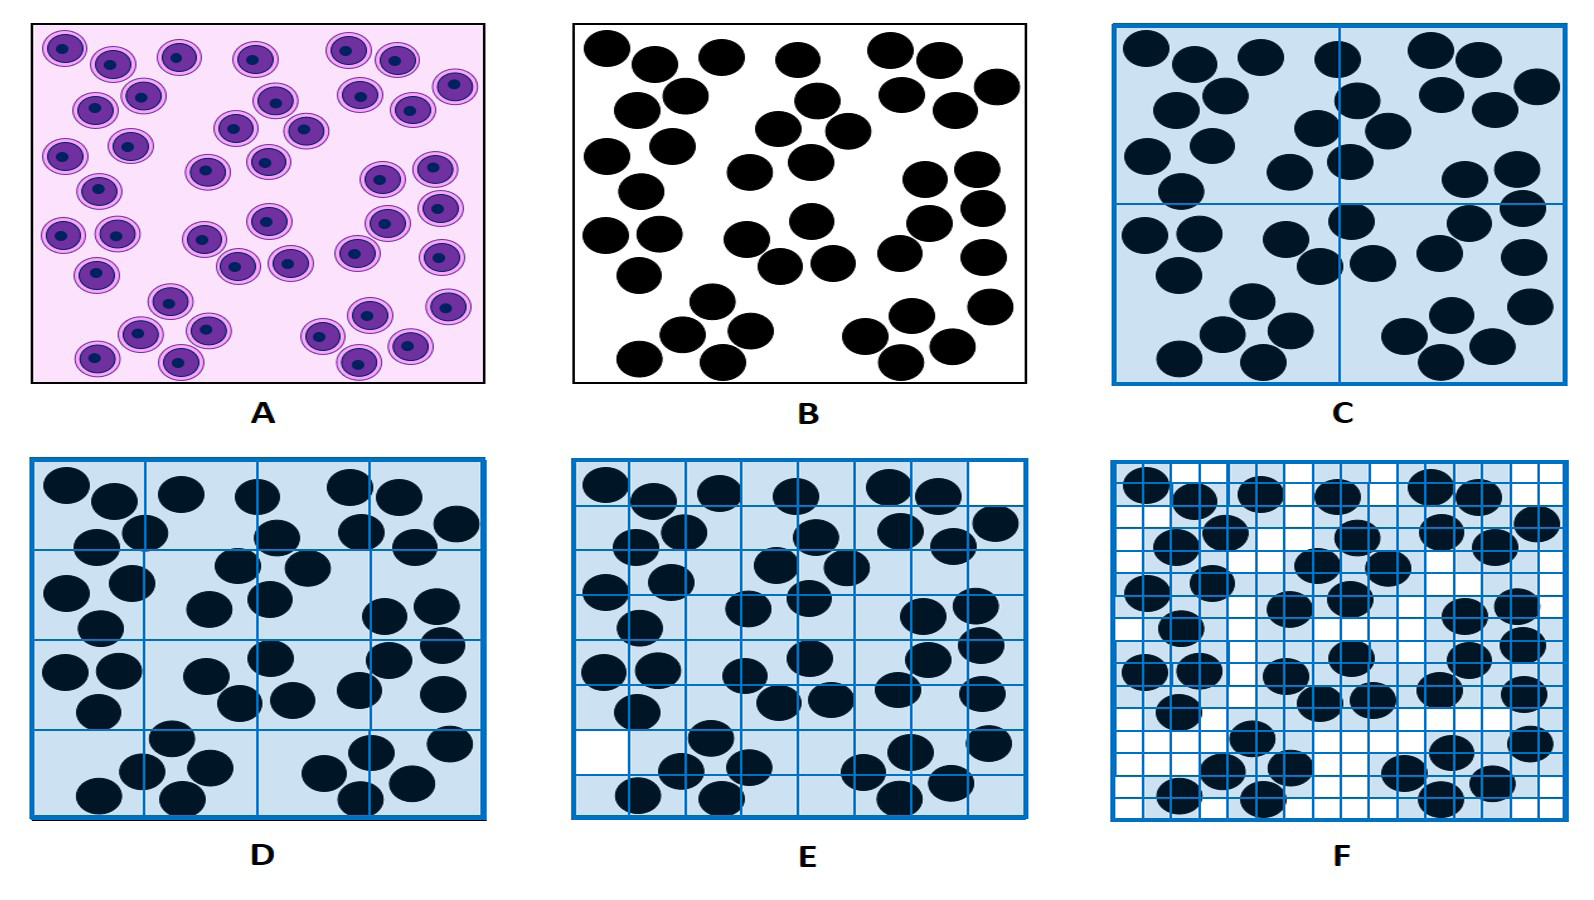
Figure 2: Fractal analysis of granule cells clusters in granular layer of cerebellar cortex, classical box counting method principle (author`s diagram) A – artificial model of granule cell clusters distribution; B – silhouette mask, binary image after segmentation; C-F – stages (iterations) of fractal analysis: C – 1st stage, box size = 1/2; D – 2nd stage, box size = 1/4; E – 3rd stage, box size = 1/8; F – 4th stage, box size = 1/16. Number of boxes containing cell silhouettes is counted (N).
Results and Discussion
To estimate the informativeness of fractal analysis in the studies of cytoarchitecture and to assess the impact of the influencing factors (cell size, cell density or cell number, and pattern of cell distribution) we created artificial models of granule cells composition in the cerebellar cortex (Figures 4-6). The fractal dimension values were measured by Image J software [30]. We used five stages of fractal analysis with the following box size values: 1/2, 1/4, 1/8, 1/16, 1/32.
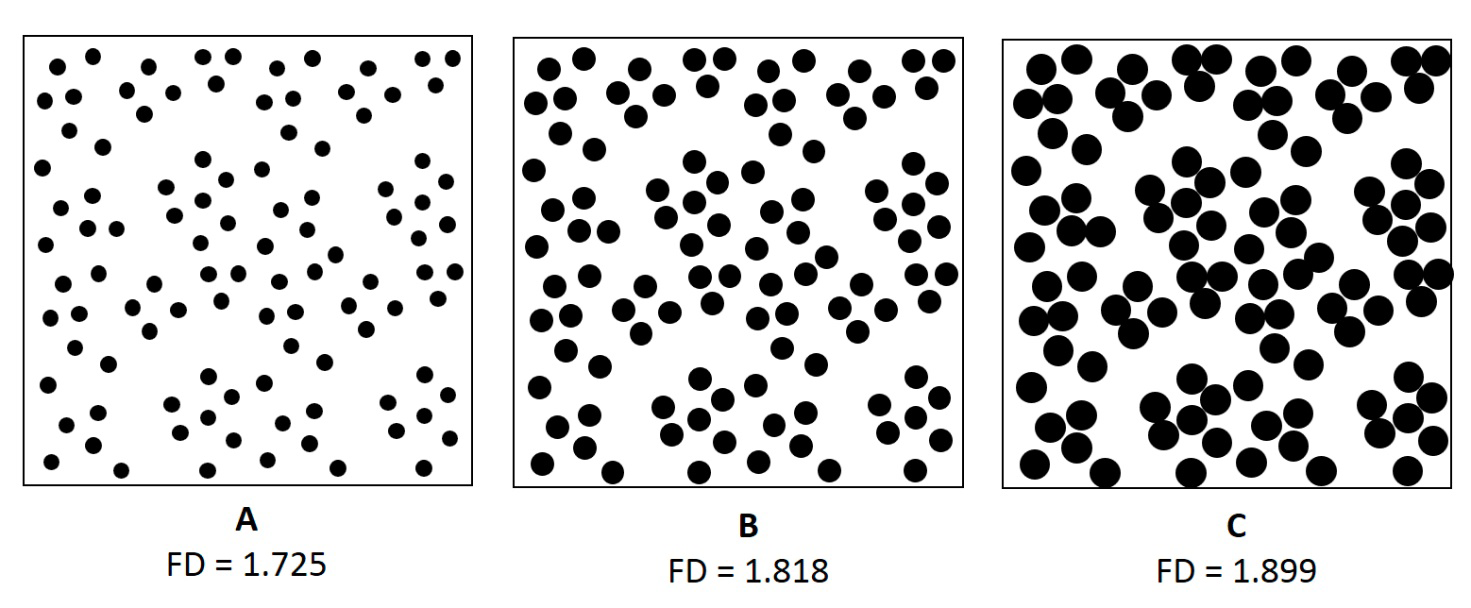
Firstly, we estimated the influence of the cell size (Figure 4). We created model reflecting the pattern of granule cell composition in cerebellar cortex; the size of cells was considered average or medium (Figure 4B). After that we changed cell size: decreased (Figure 4A) and increased (Figure 4C); cell number and cell distribution were not changed. It was revealed that the size of the cell affected the values of the fractal dimension: the values increased with increase in cell size: the FD value of the model with small cell size was 1.725, medium cell size – 1.818, large – 1.899. Taking into account that fact that fractal dimension is the measure of space filling degree, we can conclude that the size of each individual cell has an impact on space filling degree of cell clusters and their assemblage as a whole.
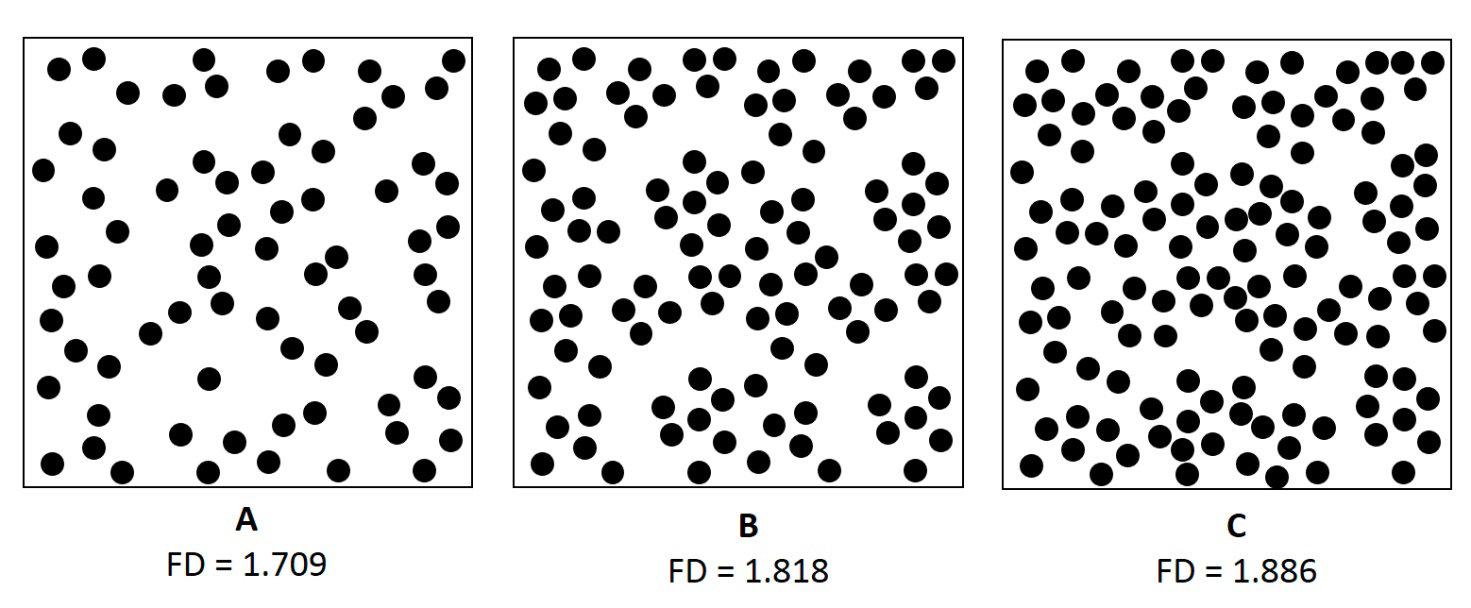
Secondly, we estimated influence of the cell density and cell number – the parameters that are usually calculated when studying cytoarchitecture of brain structures. To study the influence of the cell number and cell density we also used the model of granule cell layer cytoarchitecture; the number of cells and their density were considered average (Figure 5B). We modified this model: to decrease cell density, we deleted several cells (Figure 5A); and to increase cell density we added several cells in the model (Figure 5C). We didn’t change the localization of the remaining cells, so the pattern of cell distribution was similar in all three models. Cell size was the same. We revealed that the number and density of cells also had an influence of fractal dimension values: the FD value of the model with decreased cell density was the smallest - 1.709, average cell density – 1.818, increased cell density – 1.886. Thus, the space filling degree also depends on cell density: number of cell increases resulting in the increase of the space filled by assemblage of cell clusters.
The cell density and cell size are quantitative parameters of cytoarchitecture which can be evaluated by the traditional morphometric methods based on Euclidean geometry as well as by the fractal analysis. But cytoarchitecture is also characterized by qualitative parameter – pattern of cell distribution (Figure 6): cells may be distributed evenly or may form cell clusters. The cell clusters may have different cell density inside them and different density of clusters distribution. Pattern of cell distribution is specific in different brain structures and it is an important factor in the neuromorphological studies which should be assessed. The evaluation of cell clusterization pattern is mainly subjective and descriptive and cannot be quantified by traditional morphometric methods. We tried to quantify it using fractal analysis. We created models with different pattern of cell distribution: with even distribution (Figure 6A), distribution with moderate clusterization (Figure
6B) and with well recognizable cell clusterization (Figure 6C). The size and number of cells were the same. The FD values of the assessed models were significantly different: the FD value of the model with evenly distributed cells was the highest - 1.862. The FD value of the model with moderate clusterization was 1.818. And the FD value of the model with well recognizable cell clusterization was the smallest - 1.781. So, the increased cell clusterization results in the decrease of FD values. The same sells having different arrangement may have the different space filling degree: when cells are located evenly, they fill more space than when forming the clusters. Cells are located closer to each other and more compactly, and it results in increase of “empty” space between the cell clusters. It in turn results in decrease of space filling degree of assemblage of cell clusters as a whole entity.
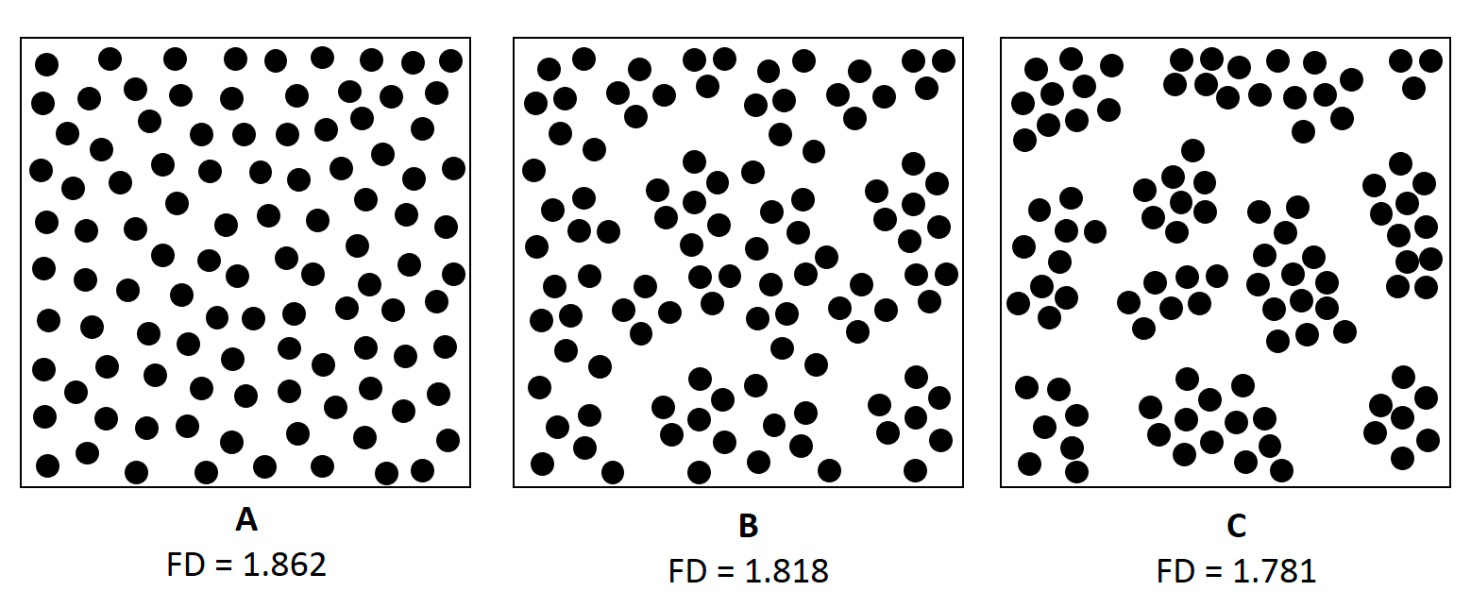
Figure 6: Models of granule cell layer cytoarchitecture of cerebellar cortex. Different pattern of cell arrangement: A – cells are distributed evenly without clusterization, B – cell distribution with moderate clusterization, C – cell distribution with well recognizable cell clusterization. Cell number and size are the same in all three models.
Fractal analysis and fractal dimension evaluated by it are quite informative in the quantitative studies of cytoarchitecture of brain structures. Traditionally, fractal analysis in neuroscience and morphology is used for the studies of solid, continuous structures: individual cells (neurons, glial cells) [12, 14, 23, 24, 25, 26, 27, 28, 29] cerebral and cerebellar cortex and white matter [13, 15, 16, 17, 18, 19, 20, 21]. We submit a proposition to consider the cell clusters and their assemblages as a whole entity. The cytoarchitecture as a whole entity exhibits some fractal properties: self-similarity of different scales, irregularity of the spatial configuration. Fractal dimension is the measure of space filling degree, so the fractal dimension measured in cellular groups characterizes space filling degree of cell assemblages as a whole entity.
We revealed that the space filling degree in the granule cell layer of cerebellar cortex depends on cell size, cell density and pattern of cell distribution and clusterization. Increase in cell size or/and cell density results in the increase in FD values. FD values are higher when cells are distributed evenly than when cells form the clusters. While the size and density (relative number) of cells can be estimated using traditional morphometric methods [8, 9, 10], the pattern of cell arrangement is mainly qualitative, and the fractal analysis allows to quantitatively and comprehensively assessing the cytoarchitecture of brain cortex.
Thus, fractal analysis can be utilized in the studies of cytoarchitecture in different structures of nervous system. This method can be used to describe the differences in the cell distribution in different cortical layers, different parts of cerebellar and cerebral cortex and to describe changes which occur under influence of different factors (aging or diseases).
The fractal analysis also may be applied in the quantitative studies of other biological structures when it is important to assess the cell clusterization and cell arrangement pattern.
References
-
Gattass R, Soares JGM, Lima B (2018) Cytoarchitecture and Myeloarchitecture of the Pulvinar. Adv Anat Embryol Cell Biol 225: 5-8.
-
Osen KK (1969) Cytoarchitecture of the cochlear nuclei in the cat. J Comp Neurol 136(4): 453-484.
-
Hanaway J, McConnell JA, Netsky MG (1970) Cytoarchitecture of the substantia nigra in the rat. Am J Anat 129(4): 417-437.
-
Palomero-Gallagher N, Zilles K (2019) Differences in cytoarchitecture of Broca’s region between human, ape and macaque brains. Cortex 118: 132-153.
-
Graïc JM, Peruffo A, Corain L, Centelleghe C, Granato A, et al. (2020) Asymmetry in the Cytoarchitecture of the Area 44 Homolog of the Brain of the Chimpanzee Pan troglodytes. Front Neuroanat 14: 55.
-
Chen X, Zhang X, Zhong Q, Sun Q, Peng J, et al. (2017) Simultaneous acquisition of neuronal morphology and cytoarchitecture in the same Golgi-stained brain. Biomed Opt Express 9(1): 230-244.
-
Chenevert TL, Sundgren PC, Ross BD (2006) Diffusion imaging: insight to cell status and cytoarchitecture. Neuroimaging Clin N Am 16(4): 619-632.
-
Chance SA, Tzotzoli PM, Vitelli A, Esiri MM, Crow TJ, et al. (2004) The cytoarchitecture of sulcal folding in Heschl’s sulcus and the temporal cortex in the normal brain and schizophrenia: lamina thickness and cell density. Neurosci Lett 367(3): 384-388.
-
Cotter D, Mackay D, Chana G, Beasley C, Landau S, et al. (2002) Reduced neuronal size and glial cell density in area 9 of the dorsolateral prefrontal cortex in subjects with major depressive disorder. Cereb Cortex 12(4): 386-394.
-
Schmitz C, Hof PR (2007) Design-Based Stereology in Brain Aging Research. In: Riddle DR (Ed.), Brain Aging: Models, Methods, and Mechanisms. CRC Press/Taylor & Francis.
-
Mandelbrot BB (1982) The fractal geometry of nature. W.H. Freeman and Company, San Francisco, pp: 470.
-
Di Ieva A, Grizzi F, Jelinek H, Pellionisz AJ, Losa GA, et al. (2014) Fractals in the Neurosciences, Part I: General Principles and Basic Neurosciences. Neuroscientist 20(4): 403-417.
-
Di Ieva A, Esteban FJ, Grizzi F, Klonowski W, Martín- Landrove M, et al. (2015) Fractals in the neurosciences, Part II: clinical applications and future perspectives. Neuroscientist 21(1): 30-43.
-
Fernández E, Jelinek HF (2001) Use of fractal theory in neuroscience: methods, advantages, and potential problems. Methods 24(4): 309-321.
-
King RD, George AT, Jeon T, Hynan LS, Youn TS, et al. (2009) Characterization of Atrophic Changes in the Cerebral Cortex Using Fractal Dimensional Analysis. Brain Imaging Behav 3(2): 154-166.
-
Roura E, Maclair G, Andorrà M, Juanals F, Pulido- Valdeolivas I, et al. (2021) Cortical fractal dimension predicts disability worsening in Multiple Sclerosis patients. Neuroimage Clin 30: 102653.
-
Akar E, Kara S, Akdemir H, Kırış A (2015) Fractal dimension analysis of cerebellum in Chiari Malformation type I. Comput Biol Med 64: 179-186.
-
Liu JZ, Zhang LD, Yue GH (2003) Fractal dimension in human cerebellum measured by magnetic resonance imaging. Biophys J 85(6): 4041-4046.
-
Wu YT, Shyu KK, Jao CW, Wang ZY, Soong BW, et al. (2010) Fractal dimension analysis for quantifying cerebellar morphological change of multiple system atrophy of the cerebellar type (MSA-C). Neuroimage 49(1): 539-551.
-
Maryenko NI, Stepanenko OY (2022) Fractal dimension of skeletonized MR images as a measure of cerebral hemispheres spatial complexity. Reports of Morphology 28(2): 40-47.
-
Maryenko N, Stepanenko O (2021) Characterization of white matter branching in human cerebella: quantitative morphological assessment and fractal analysis of skeletonized MR images. Biomedical Research and Therapy 8(5): 4345-4357.
-
Jelinek HF, Fernandez E (1998) Neurons and fractals: How reliable and useful are calculations of fractal dimensions? J Neurosci Methods 81(1-2): 9-18.
-
Ristanović D, Stefanović BD, Puškaš N (2014) Fractal analysis of dendrite morphology of rotated neuronal pictures: the modified box counting method. Theor Biol Forum 107(1-2): 109-121.
-
Takeda T, Ishikawa A, Ohtomo K, Kobayashi Y, Matsuoka T, et al. (1992) Fractal dimension of dendritic tree of cerebellar Purkinje cell during onto- and phylogenetic development. Neurosci Res 13(1): 19-31.
-
Puškaš N, Zaletel I, Stefanović BD, Ristanović D (2015) Fractal dimension of apical dendritic arborization differs in the superficial and the deep pyramidal neurons of the rat cerebral neocortex. Neurosci Lett 589: 88-91.
-
Milosević NT, Ristanović D (2006) Fractality of dendritic arborization of spinal cord neurons. Neuroscience letters 396(3): 172-176.
-
Pirici D, Mogoantă L, Mărgăritescu O, Pirici I, Tudorică V,, et al. (2009) Fractal analysis of astrocytes in stroke and dementia. Rom J Morphol Embryol 50(3): 381-390.
-
Reichenbach A, Siegel A, Senitz D, Smith TG (1992) A comparative fractal analysis of various mammalian astroglial cell types. Neuroimage 1(1): 69-77.
-
Karperien AL, Jelinek HF (2015) Fractal, multifractal, and lacunarity analysis of microglia in tissue engineering. Frontiers in bioengineering and biotechnology 3: 51.
-
Schneider CA, Rasband WS, Eliceiri KW (2012) NIH Image to ImageJ: 25 years of image analysis. Nat Methods 9(7): 671-675.
- Huddled and Preternatural- Atypical Lobular Hyperplasia
- Cytologic Surveillance Versus Immediate Referral to Colposcopy for Women with a Cervical Cytology Diagnosis of ASC-US and LSIL in the Absence of HPV DNA Test
- Callow and Vernal-Hepatoblastoma
- Black Plum Fruit Extract as a Substitute for Haematoxylin in Haematoxylin and Eosin Staining Technique
- Critical Analysis of World Status of Research on the Development of High Yielding Strains of Jatropha Curcas L
- Non-Invasive Follicular Thyroid Neoplasm with Papillary-Like Nuclear Features: Pitfalls of Cytological and Histopathologic Diagnosis