How do Vehicle Automated Features Help or Hurt Driving Performance?
It is anticipated that vehicles having automated features of Level 0 to Level 5 will coexist in the future. However, many people are unsure what role, if any, human drivers will play at these levels. How do these automated features affect drivers' performances? This article attempts to answer this question by reviewing critical information from human-automation system characteristics of vehicles with specific automated features (AV). Essential facts about the differences in functional features between human drivers and systems and automated features at various levels were clarified and summarized, including their characteristics, roles, and technical AV structures. Finally, drivers’ performances at all automation levels were discussed. This review provides the insight needed to understand how the automated features affect drivers' performances and to what extent. The results indicate that drivers’ performance does not improve as the automated level upgrades. Compared with no automation, active-safety and high automation can achieve lower workload and better driving performances for drivers. In contrast, driver assistance and partial/conditional automation impose more increased workloads and unstable (even risky) driving performance.
Introduction
The taxonomy and definitions of driving automated levels for on-road motor vehicles have been specified and continuously updated by the Society of Automotive Engineers (SAE) International [1]. These well-recognized automation levels include:
- Level 0 (L0): No driving automation. - Level 1 (L1): Driver assistance. - Level 2 (L2): Partial driving automation. - Level 3 (L3): Conditional driving automation. - Level 4 (L4): High driving automation. - Level 5 (L5): Full driving automation.
According to Society of Automotive Engineers International [1], the vehicle needs to be driven by humans until L5. So far, more vehicle products (e.g., Tesla) with lower automation levels (L1 and L2) have emerged in the automobile market [2, 3]. Also, many test vehicles (e.g., Waymo) with high automation levels (L4) have been deployed on public roads [4]. Therefore, it is very likely that vehicles having automation features of L0 to L5 will coexist in the future.
As the automation level increases, vehicles will have different features, and human drivers will behave differently. Accordingly, the performance of vehicles with certain automated features (hereinafter referred to as AV) might be different from the traditional human-driven vehicles (HV) [5].
In addition, there has been a considerable amount of as-built roadway infrastructures, which are designed and constructed based on the characteristics of human drivers or HV.
Therefore, it is necessary to consider human performance for AV. A critical question arises: How do these automated features affect driver performance? Will the automated features improve or impair driver performance? This article attempts to answer these questions following a thorough review of human-automation system characteristics of AV. This review presents in-depth knowledge of human-system interactions in AV that is essential to answer the above question.
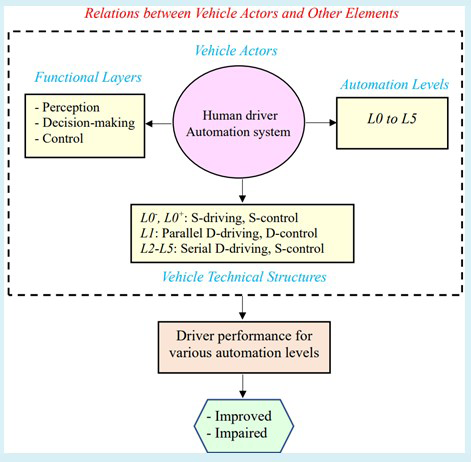
The article is organized as follows (see Figure 1). The next section describes the relationships between the actors (human drivers and automation systems) and functional layers, automation levels, and vehicle technical structures. The following section describes driver performance for different automation levels. Finally, several exciting considerations are then discussed, followed by conclusions.
Human Drivers and Automation Levels
How do automated features affect human driver performance? Before we can answer this question, some aspects of the differences between the actors (human drivers and automated systems) should be reviewed and clarified for the following elements: (a) the primary functional layers, (b) the automation levels, and (c) the vehicle technical structure. These aspects provide the rationale for answering the stipulated question.
Actors’ Differences Regarding Functional Layers
According to the data flow direction of the primary driving-functional layers, the executive elements of the human driver and the automated system at each functional layer are shown in Figure 2, where the administrative components are organs or software/hardware.
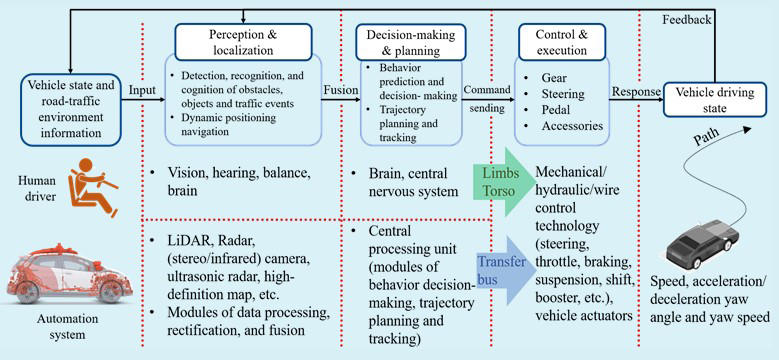
Specifically, first, the system employs a variety of perception sensors receiving information from the internal state of AV and the external roadway environment to complete the detection and self-positioning tasks. Among those tasks, the sensing module analyzes that information to realize the recognition and cognition of traffic targets or events. Second, based on the upstream sensing results, the onboard computing platform with the built-in algorithms (i.e., the central processing unit) determines the anticipated trajectory and updates the tracking commands. Then, these decision results are transmitted to the next control layer through the data transfer bus, followed by determining the control signals of each actuator (e.g., accelerator and brake).
Finally, each actuator responds to the corresponding control signal, followed by feeding the updated driving state back to the perception layer as internal signals. This process enables the closed loop of data propagation [6].
Figure 2 also shows how the human driver and the automation system complete the tasks of each functional layer. As noted, compared with the automation system, the driver uses body organs (e.g., limbs) and physical mechanisms (e.g., vision) to handle the same tasks in the same functional layer. However, they might perform differently. Table 1 shows the detailed performance differences between human driver and automation systems for various functional layers.
| Functional Layer | Performances in Functional Layers | |
|---|---|---|
| Human Driver | Automation System | |
| Perception | Large static field of vision (circa 120 deg), but the dynamic horizontal vision focuses on its centerline as driving speed increases, impairing the perception of surrounding obstacles, targets, and events [7]; No investigation of the vertical field of view. | Various perception sensors are deployed to increase the horizontal field of view (about 360 deg) and the range of acceptable electromagnetic wavelengths. Sensors have more explicit edges of vertical field of view. Redundancy and data-fusion technologies ensure perception results’ accuracy, reliability, and robustness. The field of view is not affected by driving speeds. However, cameras are susceptible to adverse weather. Also, it is difficult to address the problems of inaccurate or missed object detection caused by insufficient angular resolutions [8]. |
| Good at summarizing and processing information in complex or ambiguous scenarios, but difficult to process multiple perception tasks at the same time, resulting in increased reaction time; good learning ability but relatively long duration; good recognition accuracy, but vulnerable to adverse weather. | Capable of processing multiple perception tasks in numerous channels simultaneously and good at quantifying and measuring perception signals, but the pattern recognition ability for complex or ambiguous scenarios requires long training and learning time [9]. | |
| Decision- making | Good at judging and predicting the intentions of obstacles, targets, and traffic events but vulnerable to adverse driving conditions. | Decision-making and motion-planning algorithms can obtain results quickly, but they need long training and learning time to address multiple-solution scenarios; Difficult to evaluate the reliability of planning results in real time; and algorithms are vulnerable to outliers [10]. |
| Control | Easy to be affected by individual physiological and psychological states and driving styles, resulting in unstable maneuverability [11]. | Command the actuator through electrical signals to improve the steering, power, braking, and comfort, and ensure that the executions are highly consistent and repeatable, especially for DDTs that require the driver to be alert [12], but there is still an inevitable delay in signal transmission. |
Table 1: Differences between vehicle actors for each primary functional layer.
Actors’ Differences Regarding Automation Levels
As stated in Society of Automotive Engineers International [1], the automation levels are defined regarding the specific role played by the primary actors (human driver and automated system) in performing the dynamic driving tasks (DDT) and DDT fallback. Note that “role” in this context refers to the expected role of a given primary actor based on the design of the driving automation system instead of the actors’ actual performance. Therefore, based on the actors’ roles at each level, the required driving tasks or allowable non-driving activities within the corresponding operational design domain (ODD) are summarized in Table 2.
| Driving/Non-Driving Activities | Roles of Actorsa | ||||||||||||||
|---|---|---|---|---|---|---|---|---|---|---|---|---|---|---|---|
| L0- | L0+ | L1 | L2 | L3 | L4 | L5 | |||||||||
| A | A | B | A | B | A | B | A | B | A | B | A | B | |||
| DDT | Sustained vehicle motion control | Lateral | | | | b | | | | | | | | | |
| Longitudinal | | | | | b | | | | | | | | | ||
| DDT | Object and event detection and response | Road-traffic environment | | | | | c | | | | | | | | |
| Functional vehicle state | | | | | | | | | | | | | | ||
| Functional state of automation systems | | | | | | | | | | | | | | ||
| DDT fallback | | | | | | | | | | | | | | ||
| Non-driving activities | | | - | | - | | - | | - | | - | | - |
Table 2: Roles of vehicle actors at different automation levels [1]. a_a_ = human driver, _b_ = automation system, “Π” and “” de
Table 2: Roles of vehicle actors at different automation levels [1]. a_a_ = human driver, b = automation system, “Π” and “” denote the actor can and cannot participate in this driving/non-driving activity, respectively; “-” denotes that the system does not have the function of participating in non-driving activities. bWhen the system engages in sustained longitudinal or lateral motion control, the driver is required to conduct motion control in the remaining direction. Therefore, the table considers the system conducting longitudinal motion control as an example. cThe system conducts OEDR in the same direction as the motion control.
It is also important to note that the specification of automation levels adopted in China excludes the complete absence of automation from L0 and retains the features of Active Safety Systems (ASS), that is “Emergency Assistance (EA).” Although EA only provides an instant or temporary reminder/warning or maneuvering intervention to reduce or avoid potential risks, many previous studies have found that EA, with statistical significance, can: (a) help drivers perceive targets or events in advance, (b) improve their response-ability confronting emergencies, and (c) prompt and instruct their maneuverability [13, 14, 15]. Therefore, for the following review and discussions, the L0 specified in Society of Automotive Engineers International [1] is divided into two sub-levels: L0- and L0+. The former denotes neither driving automation nor ASS features are available, and the latter indicates that only ASS features are presented.
Table 2 shows that drivers can participate in non-driving activities since the L3 level. At levels below L4, the driver is still required to conduct all or part of the DDT. However, previous studies found that as the system participates in more DDT types, the driver is more inclined to engage in non- driving activities [16, 17] (e.g., texting, making phone calls, etc.), even at L1 or L2. In addition, the roles of the actors at L4 and L5 are identical, where the driver can choose whether to perform DDTs or not by will.
Actors’ Differences Regarding Vehicle Technical Structures
From the perspective of vehicle technical structures (VTS), the human driver and the system dominate the control of vehicles with L0- and L5 features, respectively. But at L0+ ~ L4, the human-system interaction driving (H-SID) technology is adopted. However, due to the ODD limitation, H-SID technology is still applied in L4.
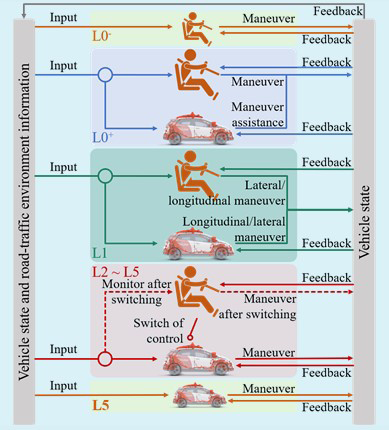
According to the results listed in Table 2 and existing H-SID technologies [18], VTSs adopted in all automation levels can be summarized as follows (see Figure 3):
- L0- and L0+: Single-driving, single-control structure.
- L1: Parallel dual-driving, dual-control (shared control) structure.
- L2 ~ L5: Serial dual-driving, single control (traded control) structure.
In the structures listed above, the number of actors with independent driving ability determines the single or dual- driving, and the number of actors who can participate in the driving operation determines the single or dual-control [18]. Also, the definition of “shared control” and “traded control” was first addressed by Sheridan and Verplank [19]. They
explained the shared control as: “In the case where both computer and human are working on the same task at the same time” and the traded control as: “when they work on the same task at different times”.
As illustrated in Figure 3, the difference in VTSs of all levels is essentially the difference in the allocation of DDTs control rights between the driver (if any) and the system (if any) along the same time dimension. It should be noted that, as stated above, because EA only provides temporary assistance, the system at L0+ has neither driving ability nor control rights. Also, as the driver’s console might be withdrawn completely at L5, the single-driving single-control structure is adopted in this case.
Moreover, a crucial control-switching process exists in the traded control structure [18]. In particular, a mandatory disengagement initiated by the L2 system requires the driver to take over immediately. After issuing a takeover request, the L3 system can execute a specific risk mitigation strategy to achieve a minimal risk condition.
However, it still needs the driver to be receptive and take over promptly. On the other hand, the takeover request issued by the L4 or L5 system does not require the driver to be respective, and it can self-achieve a minimal risk condition. This control-switching process also exists in the shared control structure. The driver in the loop of longitudinal DDTs must perform all lateral DDTs immediately after the system disengages.
Driver Performance for Automation Levels
Due to the significant differences in the automated features, drivers will not perform congruently at different levels. Previous studies investigated drivers’ performances mainly from the perspective of driving performances and workload [20, 21]. Driving performances refer to the behaviors during maneuvering, which are primarily evaluated by the driver’s reaction times [22] and maneuvering stability (e.g., the deviation from the lane centerline, speeds, etc.) [23]. The workload is evaluated by the driver’s physiological and psychological fatigue [24]. Based on the literature results, Figure 4 summarizes the variation trends of drivers’ performances with increased automation levels.
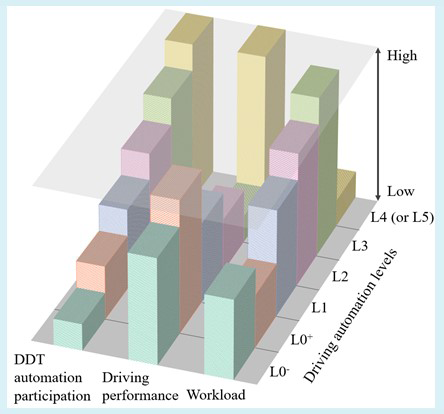
As shown in Figure 4, driver performance does not simply improve with the automation levels. Specifically:
- L0-, driver performance at this level is selected as a baseline.
- L0+, based on its definition previously stated, EA, as a supplement and monitor of a driver’s maneuverability, could reduce their workload effectively [15]. In this case, the driver with a lower workload prefers to improve their driving performance [15], which has been widely investigated and confirmed. For example, the pre-warning system can timely inform the driver of the forward/lateral potential crashes or trajectory deviations.
- L1: The system at this level is a further improvement of L0+ system in maneuvering ability. Widely-known functions include adaptive cruise control (ACC) and lane centring control (LCC) that paralyze the driver from longitudinal and lateral directions, respectively. Therefore, compared with the driver at L0+, they at L1 probably have a lower workload and participation extent in maneuverability when the system engages [16]. However, after the system disengages and the driver takes over subsequently, their workload increases and driving performances deteriorate significantly [25].
- L2: Although the driver is still required to monitor at all times (see Table 2), the results of both field tests and driving simulation tests show that the driver is more likely to be distracted, and the driving performance after taking over is worse than that at L0- [16, 17], but there is no statistical difference with that at L1 [26].
- L3: Due to the absence of DDTs, the driver needs to recover motor readiness and maneuvering stability from the state of low workload and situational awareness when the takeover request is receptive [27], which generally consumes a significant amount of time [28]. Also, the driving performance after taking over might be significantly worse than that at L0-, even lower than L1 and L2 [21]. Note that the system can execute a limited risk-mitigation strategy (e.g., braking at a comfort deceleration [1]) during the “extra” takeover time and before the preset “time budget [29]” ends. Also important to know is that both “motor readiness” and “situational awareness” are associated with driving performance significantly [21]. Situational awareness refers to the driver’s understanding of the road-traffic environment and events from a cognitive perspective [21]. Motor readiness refers to the driver’s willingness to achieve typical driving performance from a physio- psychological perspective [27].
- L4: A noticeable distinction in driver’s roles between L3 and L4 exists within their ODDs. The driver at L4 can actively take over when their motor readiness is completely recovered. Therefore, drivers at L4 can achieve much better performance than L0-.
- L5: Because whether to reserve the console at L5 is still under discussion, we tentatively suppose L5 to be the ideal L4. Their automated features can be considered equally when the ODD effects are excluded. Thus, driver performance at L5 is the same as those at L4.
Note that the results in Fig. 4 are limited by the existing automated driving technology and, so far, AV-related testing samples. Also, those results only focus on the general performance results reflecting a very large safety margin instead of capturing those in an ideal AV driving scenario without the system disengaging or the driver taking over.
For example, Naujoks, et al. [30] instructed drivers at L2 to closely pay attention to the environment ahead and hold the steering wheel throughout the trial. In this case, they found that drivers’ reaction times and maneuvering stability are much better than drivers at L0-. However, this instruction can affect the actual performance of drivers.
Exciting Considerations
Can Automation Impair Driving Performance?
Some studies have shown that vehicle automation can make drivers over-reliant on technology. In addition, if the driver is not engaged in non-driving tasks when an automated feature is on, the driver may become drowsy. These conditions may result in less monitoring of the road and less driving safety. Using a driving simulator, Dunn NJ, et al. [31] recently evaluated the effectiveness of in-vehicle displays in AV (adaptive cruise control and lane-keeping assistance) in supporting drivers’ anticipation of traffic conflicts. The results showed that drivers monitoring the road with automation was less than when the automated features were turned off. Therefore, it was recommended that the automated features be designed to keep drivers attentive.
He D, et al. [32] evaluated the effect of the automated features of L2 that can control some driving tasks for a long time, such as braking and steering. The data were collected using automated vehicles to evaluate distraction-related factors, such as eye-glance behavior and drowsiness. The results showed that drivers with prior experience with automated driving were substantially more distracted when automation was on than manual driving. In addition, drivers with less experience in automation showed less distraction but tended to be somewhat drowsy when driving with activated systems. The authors concluded that the automation experience resulted in over-trust of the advanced technologies, thus negating some safety benefits of automation.
Several exciting studies found that the lack of active involvement in the driving situation caused drivers with automation to be prone to become fatigued faster than human drivers. In addition, fatigue progression during automated driving (L3) and the driver’s ability to take back control were evaluated by Vogelpohl T, et al. [33] using a driving simulator. The results showed that drivers with automation took longer to first glance at the speed display than manual drivers after a takeover request. In addition, drivers could not stay alert during extended periods of automated driving without non- driving-related tasks. Therefore, the study concluded that driver fatigue monitoring and controllable distraction (using non-driving tasks) were necessary to ensure the driver’s alertness.
Driver’s Takeover Using Physiological Sensing
The driver’s takeover performance before a takeover request was evaluated by Du N, et al. [34] by analyzing drivers’ physiological and external environment data. In their experiments, drivers engaged in non-driving-related tasks during automated driving were asked to take control in various scenarios. The drivers’ physiological data included heart rate, galvanic skin response indices, and eye-tracking metrics. Drivers’ takeover performance was classified as good or bad based on their driving behaviors during the transition period. The takeover performance was analyzed using six machine learning methods, with the random forest classifier performing the best. The study recommended 3 s as the optimal time window length to predict takeover performance. This study’s findings should help develop algorithms for detecting the driver’s state and designing adaptive in-vehicle alert systems.
Key Challenge: 390-Year Safety Standards
Autonomous vehicles (L4 and L5) represent the ultimate solution to future automation, but their safety remains a challenge. Wang J, et al. [35] have reviewed the safety-related issues for AV using theoretical analysis of the AV systems and statistical investigation of the disengagements and crash reports for on-road testing. The results showed that 3.7 M miles on AVs have been tested by various manufacturers (2014 to 2018) and the disengagement frequency per mile for different manufacturers substantially varied (from almost 0 to 3). In addition, 128 crashes occurred during this period, with 63% caused in the autonomous mode. Of these crashes, 6% were directly related to the AV, and 94% were passively initiated by other parties, such as pedestrians, cyclists, and conventional vehicles. Therefore, safety can be substantially improved by adding AV capabilities to alert and avoid safety risks caused by other parties and to make safe decisions to prevent possible fatal crashes. As for the safety standards for AVs, the traffic safety standard is 3.4 M vehicle hours between fatal crashes and 61,400 vehicle hours between injuries.
These standards imply that one fatality and one crash may occur every 390 years and 7 years of non-stop driving. Such standards are very high. Further, there are questions about how to design an automated vehicle to be safe and demonstrate that this safety level has been achieved. For more details about these and other unresolved questions and the opportunities for early wins, the reader is referred to the excellent presentation by Shladover SE [36].
Concluding Remarks
This article has presented a review of human-automation system characteristics of AV to show how automated driving features impact driver performance for various automation levels and the nature of this impact. Based on this study, the following comments are offered:
- The study revealed that driver performance does not continually improve as the automation level upgrades. Compared with HV drivers, drivers at L0+, L4, and L5 can achieve lower workloads and better driving performance, while drivers at L1 to L3 are subjected to higher workloads and unstable (even risky) driving performance. In this context, the risky edge is L3, and the safe edge is L4. This highlights the importance of focusing on the impact of automated features on human factors and driving safety.
- This review has shown that the lower automation levels adversely impact driver performance. In particular, for conditional driving automation, drivers may be prone to fatigue and need a longer time to respond a takeover request. Therefore, some researchers have suggested adopting controllable distractions through the automated system using non-driving tasks. Such constant feedback from the drivers may provide information about the driving environment, thus helping the takeover before issuing a takeover request. In addition, the takeover- request lead time is still a challenging research area [37].
- Given the possible adverse impact on the human driver during the automation control, research has emerged regarding objective indicators (facial, behavioural, and eye tracking-based) to judge the driver’s readiness to take over the driving control. In addition, future automated driving systems may be required to decide, based on the drivers’ state obtained via in-vehicle monitoring system, whether: (a) to give back control to the driver or (b) to transfer the control to a safer state [33].
- The development of automated driving technology is still in its infancy. Drivers, in this case, lack learning and training opportunities, which might affect the review results of this article. Therefore, future research should continually update the results based on the latest progress and application status.
References
-
Society of Automotive Engineers International (2021) Taxonomy and Definitions for Terms Related to Driving Automation Systems for On-Road Motor Vehicles J 3016:_201806.
-
Tesla (2022) Electric Cars, Solar & Clean Energy.
-
Chen D, Srivastava A, Ahn S, Lia T (2019) Traffic Dynamics under Speed Disturbance in Mixed Traffic with Automated and Non-Automated Vehicles. Transportation Research Procedia 38: 709-729.
-
Boggs AM, Wali B, Khattak AJ (2020) Exploratory Analysis of Automated Vehicle Crashes in California: A Text Analytics & Hierarchical Bayesian Heterogeneity- Based Approach. Accident Analysis & Prevention 135: 105354.
-
Wang S, Yu B, Ma Y, Liu J, Zhou W (2021) Impacts of Different Driving Automation Levels on Highway Geometric Design from the Perspective of Trucks. Journal of Advanced Transportation 2021: 5541878.
-
Yurtsever E, Lambert J, Carballo A, Takeda K (2020) A Survey of Autonomous Driving: Common Practices and Emerging Technologies. IEEE Access 8: 1-28.
-
Habib K, Tawfeek MH, El-Basyouny K (2022) A System to Determine Advisory Speed Limits for Horizontal Curves Based on Mental Workload and Available Sight Distance. Canadian Journal of Civil Engineering 49(3).
-
Brummelen JV, O’brien M, Gruyer D, Najjaran H (2018) Autonomous Vehicle Perception: The Technology of Today and Tomorrow. Transportation Research Part C: Emerging Technologies 89: 384-406.
-
Wang Z, Wu Y, Niu Q (2020) Multi-Sensor Fusion in Automated Driving: A survey. IEEE Access 8: 2847-2868.
-
Hang P, Huang C, Hu Z, Xing Y, Lv C (2021) Decision Making of Connected Automated Vehicles at An Unsignalized Roundabout Considering Personalized Driving Behaviours. IEEE Transactions on Vehicular Technology 70(5): 4051-4064.
-
Storsaeter AD, Pitera K, McCormack ED (2020) The Automated Driver as a New Road User. Transport Reviews 41(5): 533-555.
-
González D, Pérez J, Milanés V, Nashashibi F (2016) A Review of Motion Planning Techniques for Automated Vehicles. IEEE Transactions on Intelligent Transportation Systems 17(4): 1135-1145.
-
Wu X, Boyle LN, Marshall D, O’Briena W (2018) The Effectiveness of Auditory Forward Collision Warning Alerts. Transportation Research Part F: Traffic Psychology And Behaviour 59: 164-178.
-
Aust ML, Engström J, Viström M (2013) Effects of Forward Collision Warning and Repeated Event Exposure on Emergency Braking. Transportation Research Part F: Traffic Psychology and Behaviour 18: 34-46.
-
Gaspar JG, Schwarz CW, Brown TL, Kang J (2019) Gaze Position Modulates the Effectiveness of Forward Collision Warnings for Drowsy Drivers. Accid Anal Pre 126: 25-30.
-
Young MS, Stanton NA (2007) Back to the Future: Brake Reaction Times for Manual and Automated Vehicles. Ergonomics 50(1): 46-58.
-
Naujoks F, Höfling S, Purucker C, Zeeb K (2018) From Partial and High Automation to Manual Driving: Relationship between Non-Driving Related Tasks, Drowsiness and Takeover Performance. Accident Analysis & Prevention 121: 28-42.
-
Winter JCD, Petermeijer SM, Abbink DA (2022) Shared Control Versus Traded Control in Driving: A Debate Around Automation Pitfalls. Ergonomics 1-27.
-
Sheridan TB, Verplank WL (1978) Human and Computer Control of Undersea Teleoperators. Technical Report, MIT Man-Machine Laboratory, Department of Mechanical Engineering, Cambridge, England.
-
Stanton NA, Young M, McCaulder B (1997) Drive-By- Wire: The Case of Driver Workload and Reclaiming Control with Adaptive Cruise Control. Safety Science 27(2-3): 149-159.
-
Winter JCD, Happee R, Martens MH, Stantond NA (2014) Effects of Adaptive Cruise Control and Highly Automated Driving on Workload and Situation Awareness: A Review of the Empirical Evidence. Transportation Research Part F: Traffic Psychology and Behaviour 27(Part B): 196- 217.
-
Zeeb K, Buchner A, Schrauf M (2015) What Determines the Take-Over Time? An Integrated Model Approach of Driver Take-Over after Automated Driving. Accid Anal Prev 78: 212-221.
-
Naujoks F, Purucker C, Wiedemann K, Marberger C (2019) Noncritical State Transitions During Conditionally Automated Driving on German Freeways: Effects of Non-Driving Related Tasks on Takeover Time and Takeover Quality. Human Factors: The Journal of the Human Factors and Ergonomics Society 61(4).
-
Eriksson A, Stanton NA (2017) Takeover Time in Highly Automated Vehicles: Noncritical Transitions to and from Manual Control. Human Factors: The Journal of the Human Factors and Ergonomics Society 59(4).
-
Larsson AFL, Kircher K, Hultgren JA (2014) Learning from Experience: Familiarity with ACC and Responding to a Cut-In Situation in Automated Driving. Transportation Research Part F: Traffic Psychology and Behaviour 27(Part B): 229-237.
-
Stanton NA, Young MS, Walker GH, Turner H, Randle S (2001) Automating the Driver’s Control Tasks. International Journal of Cognitive Ergonomics 5(3).
-
Merat N, Jamson AH, Lai FCH, Carsten O (2012) Highly Automated Driving, Secondary Task Performance, and Driver State. Human Factors: The Journal of the Human Factors and Ergonomics Society 54(5).
-
DinparastDjadid A, Lee JD, Domeyer J, Brown TL, Gunaratne P (2021) Designing for the Extremes: Modeling Drivers’ Response Time to take Back Control from Automation Using Bayesian Quantile Regression. Human Factors: The Journal of the Human Factors and Ergonomics Society 63(3).
-
Lotz A, Russwinkel N, Wohlfarth E (2019) Response Times and Gaze Behavior of Truck Drivers in Time Critical Conditional Automated Driving Take-Overs. Transportation Research Part F: Traffic Psychology and Behaviour 64: 532-551.
-
Naujoks F, Purucker C, Wiedemann K, Neukum A, Wolter S, et al. (2017) Driving performance at lateral system limits during partially automated driving. Accident Analysis & Prevention 108: 147-162.
-
Dunn NJ, Dingus TA, Soccolich S, Horrey WJ (2021) Investigating the Impact of Driving Automation Systems on Distracted Driving Behaviors. Accident Analysis & Prevention 156: 106152.
-
He D, Kanaan D, Donmez B (2021) In-Vehicle Displays to Support Driver Anticipation of Traffic Conflicts in Automated Vehicles**.** Accident Analysis & Prevention 149: 105842.
-
Vogelpohl T, Kühn M, Hummel T, Vollrath M (2019) Asleep at the Automated Wheel-Sleepiness and Fatigue during Highly Automated Driving. Accident Analysis & Prevention 126: 70-84.
-
Du N, Zhou F, Pulver EM, Tilbury DM, Robert LP, et al. (2020) Predicting Driver Takeover Performance in Conditionally Automated Driving. Accident Analysis & Prevention 148: 105748.
-
Wang J, Zhang, L, Huang Y, Zhao J (2020) Safety of Autonomous Vehicles. Journal of Advanced Transportation.
-
Shladover SE (2017) Road Vehicle Automation: Challenges and Opportunities_._ California PATH Program, University of California, USA.
-
Easa SM (2020) Transportation Ergonomics for Self-Driving Automated Vehicles: Outdated or Necessary? Ergonomics International Journal 4(4): 1-8.
- The Expanding Landscape of Road Rage: A Systematic Review of Conflicts Involving Drivers, Pedestrians, and Micromobility
- Validating Cognitive Models of Royal Navy Performance on Control Systems
- Comparing Standard and State-of-the-art Firefighter Coats on Postural Balance and Gait in a Live Burn Environment
- Investigating the Integration of Telemedicine into Clinicians Workflow: A Review of Methods
- Risk Assessment of Ergonomic Factors in a Textile Firm by RULA, REBA and Fine Kinney Methods
- Impact of Self-Esteem Training on Individuals with Disabilities Aged 17-30